Abstract
To gain increased insight into thermo-mechanical phenomena during cryopreservation, tensile stress relaxation experiments were conducted on vitrified blood vessels (vitreous in Latin means Glassy), and the results compared with various viscoelastic models. Using a recently presented device, isothermal stress-relaxation results were obtained for a bovine carotid artery model, permeated with the cryoprotectant cocktail VS55 and a reference solution of 7.05M DMSO. After a rapidly applied tensile strain, experimental results display exponential decay of stress with time; the stress at a given time increases with decreasing specimen temperature. Among the viscoelastic models investigated, the Williams-Landel-Ferry model was found to best-fit the variation of the stress relaxation data with temperature, while a Maxwell-Weichert model is used to represent the exponential decay of the stress with time. Blood vessel properties were found to dominate at temperatures above roughly −100°C, while the properties of the cryoprotectant dominate below this temperature. A suitably defined steady-state viscosity displayed a similar behavior for both cryoprotectants, when normalized with respect to the cryoprotectant glass transition temperature.
Keywords: Blood Vessels, Vitrification, Cryopreservation, Mechanical Testing, VS55, DMSO, Viscoelasticity
Introduction
Vitrification is an alternative to conventional cryopreservation of living biological materials, with ubiquitous applications in cell, tissue, and organ storage [8]. The presence of high concentrations of chemicals (cryoprotectants) that interact strongly with water prevent the water molecules from forming ice. It has been found that depressing the homogeneous nucleation temperature until it equals the glass transition temperature permits vitrification of macroscopic biological systems. Prevention of freezing means that the water in an organ remains liquid during cooling. However, as cooling progresses, the molecular motions in the liquid permeating the organ decrease and, eventually, an “arrested liquid” state—known as a glass—is achieved. It is this conversion of liquid into glass that is known as vitrification. Vitrification does not have any of the biologically damaging effects associated with freezing [15,20]. No appreciable degradation occurs over time in a living matter trapped within a vitreous matrix, and vitrification is potentially applicable to all biological systems.
Vitrification requires relatively high cooling rates, which result in non-uniform temperature distributions in the specimen. The resulting non-uniformity in temperature leads to non-uniform thermal expansion [5,6,9-11], and—when the specimen is of a significant size—may result in structural damage [13] with fracture formation as its most dramatic outcome [14]. While several studies have attempted to analyze the mechanical effects associated with vitrification [14,16,17,18], the lack of a detailed mechanical model for the vitrifying material is probably the biggest obstacle in providing the cryobiology community with guidelines about ways to prevent fracturing of cryopreserved specimens. The current experimental study is an effort to identify a mechanical model of the cryopreserved tissue during vitrification.
Mechanical testing may be used not only to study the mechanical behavior of the tissue at cryogenic temperatures, but also to assess the quality of the cryopreserved material post thawing [19,21]. Here, the mechanical properties are measured before and after cryopreservation, and the effect of the cryopreservation protocol on tissue integrity is inferred. By contrast, the current study is aimed at measuring the physical properties of the vitrified material at cryogenic temperatures, in order to develop tools to predict its mechanical behavior at these temperatures.
In broad terms, the response of an ideal viscous fluid to a constant load is a constant deformation rate (or flow); this material continues to deform irreversibly as long as the load is applied. The response of an ideal elastic solid to a constant load is a constant, reversible deformation; when the load is released, the material returns to its initial shape, as long as the resulting stress has not exceeded the strength of the material. A viscoelastic material responds to an external load with both viscous and elastic deformations, depending on the history of loading. For example, when a strain is rapidly increased and then held fixed, there is an initial elastic response, followed by a transient viscous response. The decay in stress with time due to viscous deformation is referred to as stress relaxation.
The current study is aimed at identifying a viscoelastic model that fits stress relaxation data from vitrified blood vessels at cryogenic temperatures, including the finite stress that remains when the strain is held fixed for long times. In particular, experiments were conducted on a bovine carotid artery model, permeated with the cryoprotectant cocktail VS55 and a reference solution of 7.05M DMSO, while using a specialized mechanical testing device for cryogenic temperatures [4].
Materials and Methods
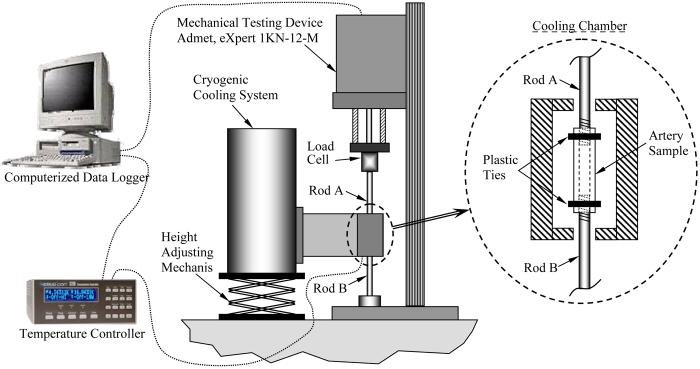
The experimental device used in the current study is presented in detail elsewhere [4], and is described here in brief, for the completeness of presentation. In broad terms, the experimental device is comprised of two systems (Fig. 1): a standard mechanical testing device (modified eXpert 1KN-12-M; Admet, Inc.), and a cryogenic cooling system, which allows replication of the cryopreservation protocol down to the mechanical-testing temperature and maintenance of steady-state thermal conditions during mechanical testing.
Figure 1.
Schematic illustration of the experimental device, comprising a self-controlled cryogenic cooling system and a standard mechanical testing device [4].
Tissue Model and CPA
The tissue model in the current study is the bovine carotid artery. Tissue specimens were permeated with the cryoprotectant cocktail VS55, and with a reference cryoprotectant solution of 7.05M dimethylsulfoxide (DMSO). VS55 is a cocktail of 242.1 g/ℓ DMSO (3.1M), 168.4 g/ℓ propylene glycol (2.2M), 139.6 g/ℓ formamide (3.1M), and 2.4 g/ℓ HEPES in EuroCollins solution. The mass of DMSO present in a 7.05M solution is the same as the total mass from the cryoprotectant ingredients of VS55, and hence it is considered as a reference (for more information about the relationship between VS55 and 7.05M DMSO see [9]). Note that DMSO in much lower concentrations is one of the most common cryoprotectants in conventional cryopreservation. The VS55 used in the current study has been prepared by Cell and Tissue Systems, Inc., Charleston, SC.
Fresh tissue specimens were harvested at a local slaughterhouse. Shortly thereafter, specimens were stored at 4°C in phosphate-NaCl buffer solution (PBS), for up to 24h prior to cryoprotectant permeation. Harvested specimens had typical dimensions of 30 mm in length, 6.5 mm OD, and 1 mm wall thickness. Mimicking a standard permeation protocol [6], the specimen was permeated by two-step immersion in cryoprotectant: in 50% cryoprotectant concentration for one hour (10 ml total cryoprotectant volume), followed by immersion in 100% cryoprotectant concentration for another hour (20 ml total cryoprotectant volume). The two-step protocol of permeation was performed to reduce the osmotic stress on cells. Note that up to six permeation steps may be applied during some cryopreservation procedures [2,15]. However, the two-step permeation protocol was deemed sufficient in the current study for the following reasons: (i) the current study is aimed at mechanical testing of the specimen only, (ii) viability post cryopreservation is outside the scope of the current study, and (iii) the pure cryoprotectant properties are expected to play a key role in mechanical testing, while the dry material of the tissue is expected to only have a secondary effect.
Testing Conditions
Mechanical testing experiments were conducted in a temperature range bounded by the glass transition temperature (−119.8°C for VS55 and −132.3°C for 7.05M DMSO [6]) as the lower limit and approximately −90°C as the upper limit. Note that the time scale of crystallization is inversely proportional to the viscosity. Further note that the viscosity is inversely proportional to the temperature. Mechanical testing results above −90°C indicated that the specimen may partially crystallize in a matter of minutes, while such effect was completely absent below about −90°C over any practical time scale of experimentation. Indeed, it is well established in the cryobiology literature that a hazardous temperature range exists, through which the vitrified specimen must be cooled rapidly [7]. The upper boundary of this region is the heterogeneous nucleation point (for example, −38°C for VS55 under similar testing conditions [12]), while the lower boundary is cooling rate dependent (for example, −89.1°C for 7.05M DMSO, under similar testing conditions [9]). An average cooling rate of 15°C/min was achieved in all experiments, which exceeds to the critical cooling rate for 7.05M DMSO and VS55 [9].
The specimen is secured onto the mechanical testing device and the experiment is started with activating the mechanical testing system in a load-control mode, set to zero load value. Next, the cryogenic cooling system was activated, and the specimen was cooled down to the cryogenic testing temperature. During cooling, the zero-load control ensured that mechanical stress will not build up due to thermal contraction of the specimen and the specimen-holding rods (Fig. 1). Once the specimen reached thermal equilibrium at the testing temperature, mechanical testing started under displacement-control mode with a constant elongation rate of 2 mm/s (the maximum displacement rate of the mechanical testing system), to an absolute elongation in the range of 1% to 3%. The absolute elongation was dependent on the testing temperature, since the viscosity increases with decreasing temperature, and higher stresses develop at lower temperatures for the same elongation rate; excessive elongations that would produce stresses approaching the strength of the material were avoided. Once the targeted elongation was reached, the moving head of the mechanical testing device was held stationary, and the decreasing load in the specimen was monitored. For each stress relaxation experiment, the stress was allowed to relax over a period of an hour, after which the cooling chamber was rewarmed to room temperature.
The experimental system is highly sensitive to changes in the surrounding temperature, since the mechanical testing device is maintained at room temperature while the specimen is cooled to cryogenic temperatures. The specimen-holding rods experience a temperature distribution ranging from the chamber temperature at one end, to room temperature at the other end. Each rod can be modeled as a thermal fin, where even small temperature changes—such as those resulting from the air conditioning system—can contribute to the strain on the specimen due to their thermal expansion. An upper bound for the variation in room temperature was 2.5°C. Such a shift in the temperature of the rods would result in a specimen elongation of 0.015 mm (thermal expansion coefficient for the rods is about 1.7×10⁻⁵ °C−1 and the overall rod length is 360 mm), assuming that the thermal mass of the mechanical testing device itself allows it to rapidly follow changes in room temperature. By selecting a specimen elongation greater than 0.6 mm, room temperature fluctuations would not contribute more than 2.5% to the uncertainty in load measurements. An elongation of 0.6 mm corresponds to about 3% strain of the average specimen length. However, when such a large elongation could not be applied, due to the relaxation modulus becoming too high as the glass transition temperature is approached, the air conditioning system was shut down in order to increase certainty in measurements.
Cross-Sectional Area Measurement
While the elongation and load on the specimen can be measured to a relatively high degree of certainty, measuring the cross-sectional area introduces significant uncertainty. In particular, the cross-section of a specific artery may vary axially, (it is known to vary between animals of the same species, and even between arteries from both sides of the same animal). Furthermore, measuring the dimensions of an artery requires dissection of the specimen and, therefore, can only be performed after the mechanical testing procedure has been completed.
At the end of the stress relaxation experiment, and after the specimen is rewarmed to room temperature, four rings of about 1 mm in width were cut from the specimen. All the rings were placed flat on a small dish with a black background, together with a measuring rod, and two digital photos were taken. Next, the area of each ring was calculated as follows: Using vector graphics, two ellipses were manually drawn to match the external and internal contours of the ring. The area of each ring was determined as the difference between the areas of the two ellipses. By comparing the size of the ellipses with the imaged measuring rod, the actual cross-sectional area was computed. The repeated calculation of cross-sectional areas on the second photograph was performed in order to reduce uncertainty associated with digital imaging analysis. The average cross-sectional area from all the four rings in the two photos was used as the representative cross-sectional area of the specimen for data analysis. As discussed in [4], the uncertainty in area calculation of one ring is estimated to be 0.4 mm2, the variation in the cross-sectional area from different rings of the same specimen was typically found in the range of 9%, and the variation in the average cross-sectional area between the first and the second photo is typically in the range of 5.4%.
Note that a constant cross-sectional area is applied in the current study for stress calculations, yielding so-called “engineering stress”, as opposed to the Cauchy stress calculation, in which the change in cross-sectional area is also taken into account as a result of the axial load. While the Cauchy stress is commonly used to analyze blood vessels at room temperature—or any other hyper-elastic material for that matter—the vitrified blood vessel does not behave hype-elastically in the relatively small strains applied in the current study, typically in the 3% range. At such low strains, the effect of using a constant area on the calculated engineering stress is negligible; the corresponding change in cross-sectional area is smaller than the uncertainty in measuring the area itself during experimentation.
Mathematical Modeling
The relaxation modulus, E(t), is defined as:
| (1) |
where F(t) is the load, A is the cross-sectional area, ΔL is the applied displacement (elongation), L0 is the initial length of the specimen, ε is the strain, and σ is the stress. It is noted that using a true stress analysis (i.e., taking into account changes in the cross-sectional area as a result of an axial elongation) was deemed unnecessary in the current analysis, as the uncertainty associated with cross-sectional area measurements is expected to be much larger than the contribution of 3% axial elongation to the decrease in cross-sectional area.
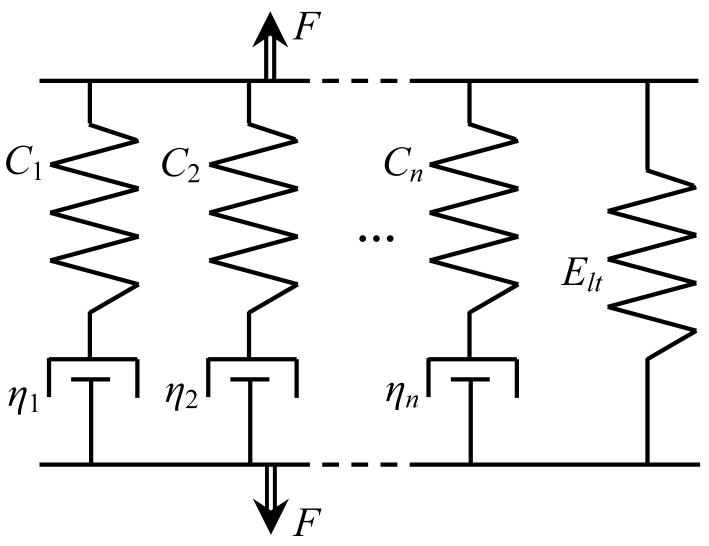
The vitrified blood vessel is assumed to have a behavior similar to the Maxwell-Weichert model [1]. With reference to Fig. 2, this model assumes an infinite number of parallel units, each consisting of a spring and a damper in series; the parallel unit series is truncated to the first n components for practical purposes. It follows that the relaxation modulus in response to instantaneous loading can be formulated as [1]:
| (2) |
where Ci and ηi are the spring and damping coefficients in Fig. 2, and the ratio:
| (3) |
is known as the relaxation time (of the ith unit).
Figure 2.
Schematic illustration of the modified Maxwell-Weichert model, with elastic constants Ci and viscous damping constants ηi; the right spring represents the long time elastic response.
Since the vitrified blood vessel is composed of cryoprotectant in the liquid phase and the blood vessel's solid structure (extracellular matrix), the classical Maxwell-Weichert model is modified in the current study to include also a long-time elastic component:
| (4) |
where Elt represents the long time relaxation modulus. Estimation of the parameters of the modified Maxwell-Weichert model could be performed by best-fitting experimental results of the relaxation modulus, calculated from Eq. (1), with Eq. (4). However, this parametric estimation would be feasible only if the shortest relaxation time of the model is much larger than the duration of initial loading of the specimen, and therefore loading could be considered instantaneous. Preliminary data analysis indicated that the shortest relaxation time, τ1, is of a magnitude of 0.2 sec, while specimen loading time, t0, was on average 0.5 sec. Therefore, mathematical modeling must account for relaxation already occurring during the loading period. For this purpose, the general expression for the stress as it depends on the relaxation modulus and the strain-rate is used [1]:
| (5) |
where ε̇ is the strain rate and t' is an integration variable. In the experimental protocol of the current study, the strain rate is constant, equal to ε̇0 , up to time t0, and zero thereafter; Eq. (5) then simplifies to:
| (6) |
Using the modified Maxwell-Weichert model, Eq. (4), in Eq. (6) yields:
| (7) |
Note that ΔL/L0t0 is substituted for ε̇0 in the right form of Eq. (7).
In order to find the modified Maxwell-Weichert model parameters, the relaxation modulus was first calculated from experimental results, using Eq. (1), and then compared with the modeled specimen response presented in Eq. (7). Using a best-fit least-squares approximation technique, the coefficients Elt, Ci and τi in Eq. (7) were estimated.
The steady-state viscosity for viscoelastic fluids, which is defined as the stress reached after long time under a constant strain rate, is given by:
| (8) |
In the current study, however, where a non-zero relaxation modulus is expected after long time, the steady-state viscosity is defined as:
| (9) |
Finally, substituting the relaxation modulus term in Eq. (9) with its explicit form from Eq. (7) yields:
| (10) |
Results and Discussion
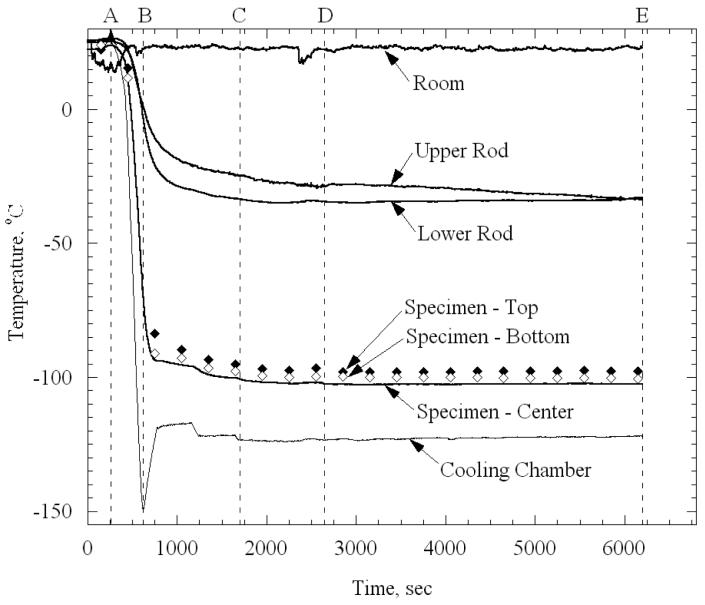
The thermal history in a typical experiment, performed on a specimen permeated with 7.05M DMSO, is displayed in Fig. 3. Initial rapid cooling was forced between points A and B, by activating the high-power (high-pressure) cooling unit [4]. This unit was turned off at point B, when the self-regulated low-power (low-pressure) cooling system was activated. The operator fine-tuned the set-temperature of the cooling chamber between points B and C, until the specimen reached the desired mechanical-testing temperature. Additional time was allotted between points C and D (20 min in this study) for the system to approach thermal equilibrium. At point D for this particular experiment, the temperature of the cooling chamber was −123°C and the average temperature of the artery was −100.8°C. Consistent with the description in the Materials and Methods section above, the mechanical device is activated in a load control mode, and set to zero load prior to the beginning of cooling, at point A. The stress relaxation experiment was conducted between points D and E (typically one hour in this study). Note that during the relaxation stage in the particular experiment shown in Fig. 3, the temperature of one of the rods decreased by 4°C, but the temperatures of the artery and the chamber remained fairly constant during this time. The contribution of thermal contraction of the rods to the calculated relaxation modulus is also discussed in the Materials and Methods section, above. Further note that the temperature at the ends of the artery were slightly warmer than at its center, due to heat transfer from the specimen-holding rods; the maximum temperature difference for this particular experiment is 5°C. The average specimen temperature reported in the current study is based on a weighting factor of 2 for the center temperature measurement and 1 for the end measurements.
Figure 3.
Typical thermal history a specimen loaded with 7.05M DMSO: (A-B) initial rapid cooling, (B-C) slow cooling, (C-D) approaching thermal equilibrium, and (D-E) mechanical testing while the specimen is at thermal equilibrium. The rod temperatures are measured at about 20 mm from the specimen ends, outside of the cooling chamber.
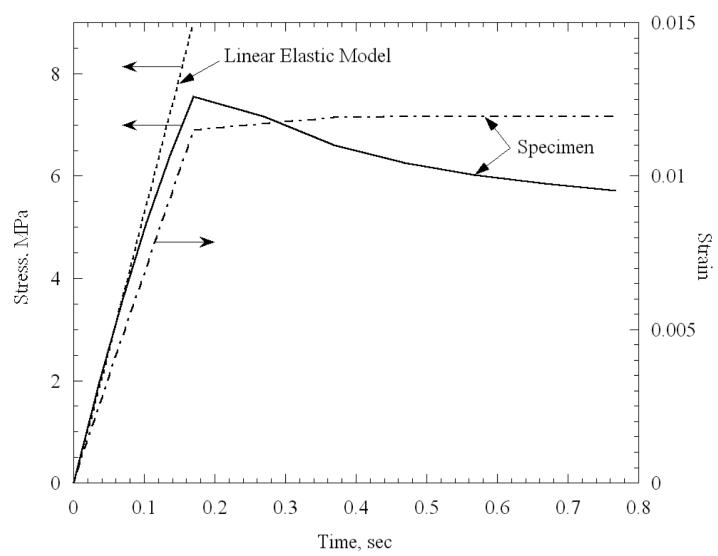
Figure 4 displays the early stage of loading for a specimen permeated with 7.05M DMSO, at an average temperature of −121.3°C, and subject to loading at a strain rate of about 0.06 sec−1. The final strain in this experiment was 1.2% (sample length was 29.7 mm) and it was reached after a loading period, t0, of about 0.2 sec. Also displayed in Fig. 4 is the ideal linear-elastic response, assuming no stress relaxation (a line with constant slope as measured at the origin). The deviation from a linear-elastic behavior in this case is of more than 20%, indicating that the first relaxation time constant is no greater than 0.2 sec, which necessitates the use of Eq. (7) for data analysis, as discussed in the Mathematical Modeling section.
Figure 4.
Early stage of mechanical loading for a specimen permeated with 7.05M DMSO, at an average temperature of −121.3°C, and subject to loading at a strain rate of 0.06 sec−1. Also displayed is the predicted stress response of the specimen, assuming a linear elastic response, with negligible stress relaxation.
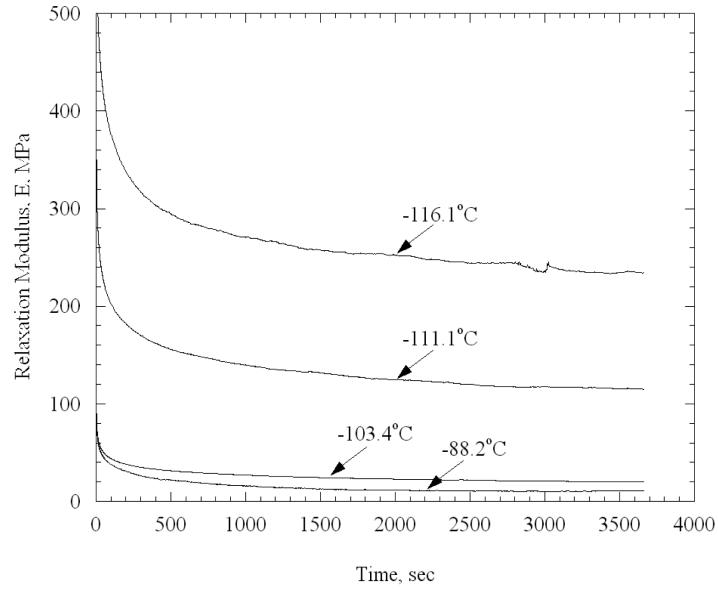
In total, 20 stress relaxation experiments were performed on arteries permeated with VS55 and 29 experiments were performed on arteries permeated with 7.05M DMSO. For example, Fig. 5 displays selected experiments on specimens permeated with VS55, indicating the long time response of the specimen, and its dependence on the testing temperature. No dependency of experimental results on the applied strain was observed. For example, for applied strains in the range of 1% to 3% at −90°C, the long time modulus deviated by ±20% from its average, which corresponds to 1.5% of its variation over the full range of temperatures tested.
Figure 5.
Selected experiments on specimens permeated with VS55.
Mechanical Model
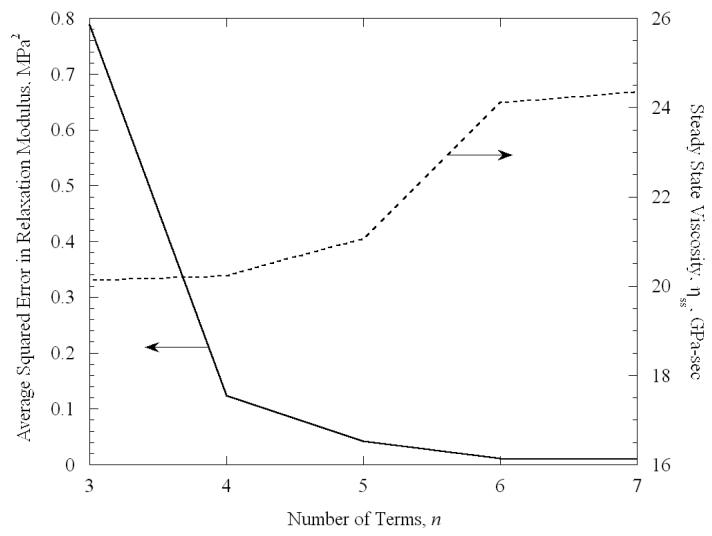
In the current study, the modified Maxwell-Weichert model, Eq. (4), is truncated after the first n terms. For example, Fig. 6 displays the effect of the value of n on the quality of the best-fit approximation, for a VS55 experiment at −101.2°C. It can be seen from Fig. 6 that the average squared error decreases exponentially with increasing number n, for a fixed number of experimental data. The contribution of the seventh term of the series is less than 1% decrease in the average squared error. Comparable results were obtained for other experimental conditions and, therefore, n equals 6 is considered adequate in this study. The sixth relaxation constant is typically in the order of 1000 sec, indicating that a testing time of one hour is adequate for the system to reach steady state. Contrary to our expectations, no temperature dependency was observed for the value of the relaxation constants. It can further be seen from Fig. 6 that the steady-state viscosity also converges to a constant value after 6 terms.
Figure 6.
The effect of the number of terms of the Modified Maxwell-Weichert model, Eq. (4), on the quality of the best-fit approximation of the relaxation modulus to experimental data, for a specimen permeation with VS55 and tested at a temperature of −101.2°C.
For the classic model of a rheologically simple material Ci would be temperature-independent, while τi would be temperature-dependent. Fitted data in the current study, however, did not display such a pattern: Ci were found to be quite temperature dependent, while τi did not display a consistent pattern with temperature. It may very well be that multiple relaxation processes are occurring simultaneously, including that of the CPA and that of the biological material, producing complex behavior that is not separable in the classic form.
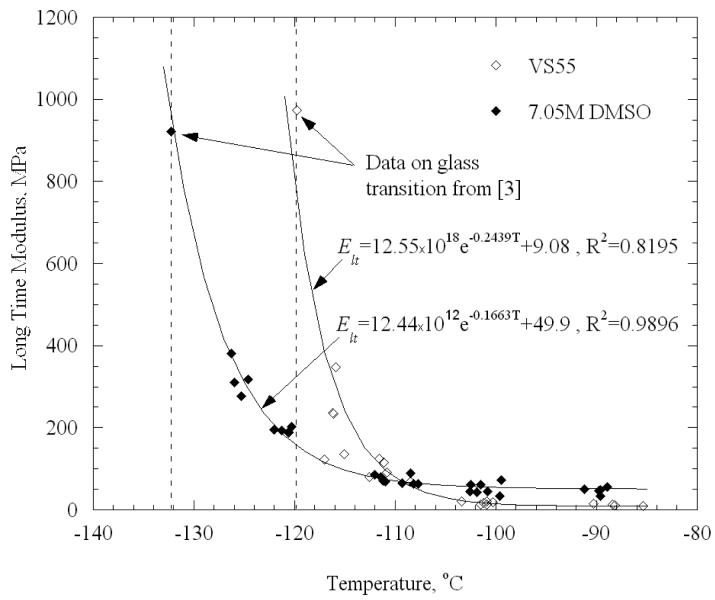
The classic model of a rheologically-simple material asserts that the glassy (short time) and rubbery (long time) elastic moduli are independent of temperature, and that the transition from glassy to rubbery behavior over time--described by the relaxation times--depends on temperature. For viscoelastic materials, the short time moduli are typically measured dynamically at high frequencies, and so cannot be observed here. The long time moduli—at least as measured in a test of one hour duration—do indeed depend on temperature. Since it is expected to increase exponentially with decreasing temperature, the long time modulus is modeled here as:
| (11) |
where E0, b and EH are model parameters. The latter term is used to account for the behavior above −100°C, which appeared to be temperature-independent.
Experimental data and best-fit approximations for Elt are displayed in Fig. 7, where glass transition data is taken from [4]. It can be seen from Fig. 7 that Eq. (11) fits the measured data reasonably well for the temperature range under consideration, even though different loading histories were applied above (stress relaxation tests) and below (standard stress-strain tests) below glass transition. Notice also that Elt for VS55 at the higher temperatures is around 9 MPa, which is of the same order of magnitude as the elastic modulus for blood vessels at room temperature.
Figure 7.
Long time modulus, Elt, as a function of temperature for VS55 and 7.05M DMSO along with linear-elastic modulus at glass transition taken from [4]. A simple exponential function is used to model the results. Temperature value for the empirical correlation is taken in degrees Kelvin.
The discussion turns to the steady-state viscosity, compiled with Eq. (10) from experimental results. Seeking the best representation of experimental data, steady-state viscosity was best-fitted with four fundamental models of viscosity: a simple exponential model, the Arrhenius model [22], the Williams-Landel-Ferry model (WLF) [22], and a simplified WLF model. The exponential model is conveniently presented as:
| (12) |
where η0 is a reference viscosity value, B0 is a model parameter, and T is in absolute temperature (K).
The Arrhenius model is presented as:
| (13) |
where A is the activation energy, and R is the universal gas constant; in practice, B0 is fitted to experimental data, not A.
The WLF model [22] is presented as:
| (14) |
where Tr is a reference temperature and Tg is the glass transition temperature (Tr is frequently taken as 51.6K for polymers [22]). The simplified WLF model [22] is presented in the current study as:
| (15) |
Table 1 lists the coefficients of best-fit approximation of experimental data with the models presented in Eqs. (12)-(15). Interestingly, the Tr value of 48.6K obtained by best-fitting VS55 results with the WLF model is close to the typical value for polymers of 51.6K.
Table 1.
Best-fit parameter values for the steady-state viscosity for (1) a simple exponential model, (2) the Arrhenius model, (3) the WLF model, and (4) a simplified version of the WLF; R2 is the coefficient of determination for each case (temperatures are presented in an absolute scale).
| Steady-State Viscosity Model | VS55 | 7.05M DMSO | ||||||
|---|---|---|---|---|---|---|---|---|
| η0 | B0 | Tr | R2 | η0 | B0 | Tr | R2 | |
| (1) ηss = η0 exp(−B0T) | 2.61×10⁹ | 6.46×10⁻² | - | 0.8138 | 1.15×10⁸ | 4.82×10⁻² | - | 0.7776 |
| 7.78×10⁻² | 2237.5 | - | 0.8723 | 5.56×10⁻¹ | 1815.2 | - | 0.9006 | |
| 1.868×10⁵ | 5.965 | 48.59 | 0.8752 | 1.004×10⁶ | 4.592 | 8.48 | 0.9562 | |
| 383.62 | 316.68 | 101.9 | 0.8752 | 9338.1 | 42.7 | 131.3 | 0.9560 | |
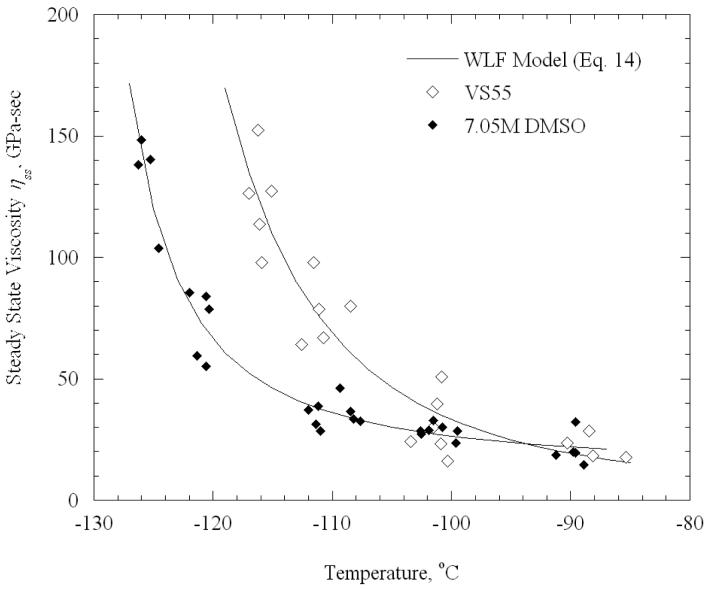
Figure 8 displays best-fitted results of VS55 and 7.05M DMSO with the WLF model. Overall, the standard deviation of the results from the models is 11% and 6% for VS55 and 7.05M DMSO respectively. This is consistent to the uncertainty in measurements for the experimental device (Appendix A). However, it should be noted that each data point in Figs. 7-8 represents a specimen from a different animal, and such a variation is reasonable between animals of the same species, especially when they vary in age and weight (the specimens are donated by a local slaughterhouse).
Figure 8.
Steady state viscosity for VS55 and 7.05M DMSO, and best-fit approximation results based on the WLF model (model parameters are listed in Table 1).
It can be seen that results for the two cryoprotectants above −100°C are within a narrow range. The viscosity of the CPAs is expected to be low above −100°C and, thus, to have a minor effect on the mechanical response of the specimen; it appears that the mechanical properties of the blood vessel dominate above −100°C. The steady-state viscosity and the long term relaxation modulus show a similar behavior when the specimen temperature approaches the respective glass transition temperatures for the two CPAs.
Temperature Dependant Model for the Relaxation Modulus
In total, 20 stress relaxation experiments were performed on arteries permeated with VS55 and 29 on arteries permeated with 7.05M DMSO. Data analysis of each experiment yielded a series of six Ci and six τi values (one specimen at one temperature)—a total of 240 coefficient values for VS55 and 348 coefficient values for 7.05M DMSO. In order to preserve the experimental data in an efficient way for further analyses, a unified time-temperature dependent relaxation modulus is suggested in the current study. Note that variation in properties between biological specimens—even at the same temperature—may make the best-fit approximation coefficients scattered, especially for the first couple of terms that are associated with the very short time response. While many forms may be suggested for the generalization of the relaxation modulus, the following form is suggested in the current study:
| (16) |
where B1, B2, and α, as well as τi and Ci, are model parameters and T is the absolute temperature. Thus, in contrast to the classic rheologically simple model for viscoelastic materials, in which the temperature dependence is captured by τi and the Ci are constant, the τi and Ci values in Eq. (16) are temperature independent, while the temperature dependence captured by the first term in Eq. (16).
Best-fit approximation results of Eq. (16) with experimental data are presented in Table 2. For this purpose, experimental data was sampled at 10 different times from each experiment, in exponentially increasing order: 0.5, 1.3, 3.6, 10, 26, 70, 187, 500, 1340, and 3600 seconds. While an n value of 6 was deemed adequate for best-fitting of an individual stress-relaxation result with the Maxwell-Weichert model, an n value of 4 is found adequate for the sampled results, at the time intervals specified above. A procedure similar to the one explained in Fig. 6 was used to reach this conclusion, initially varying the number of times at which the data were sampled.
Table 2.
Best-fit parameter values for the time-temperature empirical correlation of the relaxation modulus presented in Eq. (16)
| VS55 | 7.05M DMSO | |
|---|---|---|
| R2 | 0.9099 | 0.9726 |
| B1 | 12.0197×10¹⁰ | 24.7855×10¹⁰ |
| B2 | 70.989 | 70.998 |
| a | 0.1198 | 0.1376 |
| C1 | 0.276 | 0.527 |
| C2 | 0.192 | 0.368 |
| C3 | 0.152 | 0.293 |
| C4 | 0.128 | 0.280 |
| C5 | 0.220 | 0.701 |
| τ1 | 0.860 | 0.786 |
| τ2 | 9.15 | 7.87 |
| τ3 | 110.69 | 79.79 |
| τ4 | 1009.1 | 1021.9 |
Summary and Conclusions
The current study focuses on the viscoelastic response of vitrified blood vessels, using the cryoprotectant cocktail VS55 and the reference solution of 7.05M DMSO. A previously presented device [4] was used to reproduce a typical cryopreservation protocol, followed by stress-relaxation testing at constant cryogenic temperatures.
Results of this study indicate that the relaxation modulus increases with decreasing temperature. As would be expected for biological tissues, the relaxation modulus does not completely decay to zero in long times; the tissue structure, rather than the permeated CPA, is assumed responsible for this long time behavior. However, when the long time relaxation modulus is subtracted, a quantity analogous to the steady-state viscosity of a viscoelastic fluid can be extracted. This steady-state viscosity was found to increase exponentially with decreasing temperature. When best-fitted with four acceptable models of steady-state viscosity, the WLF model was found to best-fit experimental data.
Experimental results further indicate that the steady-state viscosity above −100°C is weakly-CPA dependent, suggesting that the properties of the blood vessel specimen itself dominate the mechanical response of the CPA-blood vessel system for temperatures higher than −100°C. Below the latter temperature, blood vessel specimens permeated with the two CPAs exhibit essentially the same behavior, with a shift of about 10°C; interestingly, that shift is close to the difference in glass transition temperatures of the two CPAs. It is concluded that the CPA dominates the mechanical response of the vitrified blood vessel at lower temperatures.
Finally, a simplified empirical correlation of the time-temperature dependency of the relaxation modulus is proposed for each CPA, with the anticipation that such a correlation will become useful in future theoretical analyses.
Acknowledgements
This study was supported in part by National Institute of Health (NIH), grant number R01HL069944-01A1, 02, 03, 04. The authors wish to thank Dr. Michael J. Taylor, Cell and Tissue Systems, Inc., Charleston, SC, for discussions about the permeation of cryoprotectants in tissue.
Appendix A - Uncertainty Analysis
Following standard practice [3], the uncertainty in this procedure is estimated as:
| (A.1) |
where δL, δLo, δA, and δF are the estimated uncertainties in measurement of the displacement, effective length, cross-sectional area, and load, respectively; typical corresponding values are: 3.4×10⁻³ mm (corresponding to the average elongation of the stainless steel rods under the load present during an experiment), 1 mm, 1.15 mm2 (9 %), and 0.15 N. When substituting the relaxation modulus from Eq. (1) into Eq. (A.1), the uncertainty is estimated as 12.5% of the long time value of the relaxation modulus for each case. The latter value represents the uncertainty introduced by the experimental apparatus [4], not taking into consideration variations between different specimens, which are expected to have a greater effect on measurements.
Uncertainty in temperature measurements is introduced by A/D conversion (22 bits at 0.333Hz) in the data acquisition module, cold-junction compensation, and quality of the thermocouple material. The combined effect of these uncertainties is estimated as ±0.8°C. This value, however, is small when compared with the temperature distribution along a single specimen (typically 5°C).
References
- 1.Aklonis J, MacKnight W, Shen M. Introduction To Polymer Viscoelasticity. Wiley & Sons; New York: 1972. p. 249. [Google Scholar]
- 2.Baicu S, Taylor MJ, Chen Z, Rabin Y. Vitrification of carotid artery segments: An integrated study of thermophysical events and functional recovery towards scale-up for clinical applications. Cell Preservation Technology. 2006;4(4):236–244. doi: 10.1089/cpt.2006.9994. Z. [DOI] [PMC free article] [PubMed] [Google Scholar]
- 3.Holman JP. Experimental Methods for Engineers. McGraw-Hill; New York: 1989. p. 549. [Google Scholar]
- 4.Jimenez-Rios JL, Rabin Y. A new device for mechanical testing of blood vessels at cryogenic temperatures. Experimental Mechanics. 2007;47:337–346. doi: 10.1007/s11340-007-9038-8. [DOI] [PMC free article] [PubMed] [Google Scholar]
- 5.Jimenez-Rios JL, Rabin Y. Thermal expansion of blood vessels in low cryogenic temperatures, Part I: A new experimental device. Cryobiology. 2006;52(2):269–283. doi: 10.1016/j.cryobiol.2005.12.005. [DOI] [PMC free article] [PubMed] [Google Scholar]
- 6.Jimenez-Rios JL, Rabin Y. Thermal expansion of blood vessels in cryogenic temperatures, Part II: Vitrification with VS55, DP6, and 7.05M DMSO. Cryobiology. 2006;52(2):284–294. doi: 10.1016/j.cryobiol.2005.12.006. [DOI] [PMC free article] [PubMed] [Google Scholar]
- 7.Karlsson J, Cravalho EG, Borel Rinkes IHM, Tompkins RG, Yarmush ML, Toner M. Nucleation and growth of ice crystals inside cultured hepatocytes during freezing in the presence of dimethyl sulfoxide. Biophysical Journal. 1993;65:2524–2536. doi: 10.1016/S0006-3495(93)81319-5. [DOI] [PMC free article] [PubMed] [Google Scholar]
- 8.Luyet BJ. The Vitrification of Organic Colloids and of Protoplasm. Biodynamica. 1937;1(29):1–14. [Google Scholar]
- 9.Plitz J, Rabin Y, Walsh JR. The effect of thermal expansion of Ingredients on the Cocktails VS55 and DP6. Cell Preservation Technologies. 2004;2(3):215–226. [Google Scholar]
- 10.Rabin Y, Plitz J. Thermal expansion of blood vessels and muscle specimens permeated with DMSO, DP6, and VS55 at cryogenic temperatures. Ann. Biomed. Eng. 2005;33(9):1213–1228. doi: 10.1007/s10439-005-5364-0. [DOI] [PubMed] [Google Scholar]
- 11.Rabin Y, Bell E. Thermal expansion measurements of cryoprotective agents. Part II: Measurements of DP6 and VS55, and comparison with DMSO. Cryobiology. 2003;46(3):264–270. doi: 10.1016/s0011-2240(03)00041-5. [DOI] [PubMed] [Google Scholar]
- 12.Rabin Y, Taylor MJ, Walsh JR, Baicu S, Steif PS. Cryomacroscopy of vitrification, Part I: A prototype and experimental observations on the cocktails VS55 and DP6. Cell Preservation Technology. 2005;3(3):169–183. doi: 10.1089/cpt.2005.3.169. [DOI] [PMC free article] [PubMed] [Google Scholar]
- 13.Rabin Y, Steif PS. Solid mechanics aspect of cryobiology. In: Baust JG, Baust JM, editors. Advances in Biopresevation. CRC Taylor & Francis; Boca Raton: 2006. pp. 359–382. Chap. 13. [Google Scholar]
- 14.Rabin Y, Steif PS, Hess KC, Jimenez Rios JL, Palastro M. Fracture formation in vitrified thin films of cryoprotectants. Cryobiology. 2006;53:75–95. doi: 10.1016/j.cryobiol.2006.03.013. [DOI] [PMC free article] [PubMed] [Google Scholar]
- 15.Song YC, Khirabadi BS, Lightfoot FG, Brockbank KGM, Taylor MJ. Vitreous cryopreservation maintains the function of vascular grafts. Nature Biotechnology. 2000;18:296–299. doi: 10.1038/73737. [DOI] [PubMed] [Google Scholar]
- 16.Steif PS, Palastro MC, Wen CR, Baicu S, Taylor MJ, Rabin Y. Cryomacroscopy of vitrification, Part II: Experimental observations and analysis of fracture formation in vitrified VS55 and DP6. Cell Preservation Technology. 2005;3(3):184–200. doi: 10.1089/cpt.2005.3.184. [DOI] [PMC free article] [PubMed] [Google Scholar]
- 17.Steif PS, Palastro MC, Rabin Y. Analysis of the effect of partial vitrification on stress development in cryopreserved blood vessels. Medical Engineering & Physic. 2006;29(6):661–670. doi: 10.1016/j.medengphy.2006.07.010. [DOI] [PMC free article] [PubMed] [Google Scholar]
- 18.Steif PS, Palastro MC, Rabin Y. Continuum mechanics analysis of fracture progression in the vitrified cryoprotective agent DP6. ASME Biomechanical Engineering. 2008;130(2):021006. doi: 10.1115/1.2898716. [DOI] [PMC free article] [PubMed] [Google Scholar]
- 19.Thakrar RR, Patel VP, Hamilton G, Fuller BJ, Seifalian AM. Vitreous cryopreservation maintains the viscoelastic property of human vascular grafts. FASEB J. 2006;20(7):874–81. doi: 10.1096/fj.05-5304com. [DOI] [PubMed] [Google Scholar]
- 20.Taylor MJ, Song YC, Brockbank KGM. Vitrification in tissue preservation: New developments. In: Fuller BJ, Lane N, Benson EE, editors. Life in the Frozen State. CRC Press; New York: 2004. pp. 603–641. [Google Scholar]
- 21.Venkatasubramanian RT, Grassl ED, Barocas VH, Lafontaine D, Bischof JC. Effects of freezing and cryopreservation on the mechanical properties of arteries. Ann Biomed Eng. 2006;34(5):823–32. doi: 10.1007/s10439-005-9044-x. [DOI] [PubMed] [Google Scholar]
- 22.Ward IM. Mechanical Properties of Solid Polymers. Wiley & Sons; New York: 1971. p. 475. [Google Scholar]


