Abstract
Purposes
The aim of this study was to compare the MR imaging features between estrogen receptor (ER) positive and negative breast cancers.
Materials and Methods
Breast MRI of 90 consecutive patients confirmed with invasive ductal carcinoma, 51 ER positive and 39 ER negative, were studied. The tumor morphology and dynamic contrast enhanced (DCE) kinetics were evaluated and compared based on ACR BI-RADS MRI lexicon. Enlarged axillary lymph nodes on MRI and choline detection using MR spectroscopy were also analyzed and compared. For patients receiving axillary node dissection the pathological nodal status was also compared.
Results
ER negative breast cancer had bigger tumors compared to ER positive cancer (3.6 ± 2.0 cm vs. 1.8 ± 1.3 cm, P < 0.00005). ER negative cancer was more likely to exhibit non-mass type enhancements compared to ER positive cancer (P < 0.005). Enlarged axillary lymph nodes were more frequently identified on MRI in ER negative compared to ER positive patients (P < 0.05 ). After excluding patients with more aggressive disease undergoing neoadjuvant chemotherapy, MRI and pathological axillary lymph node did not find significant differences between them. ER negative cancer was more likely to show the malignant type enhancement kinetics (P = 0.15), rim enhancement (P = 0.15), and choline detection on MRS (P = 0.23) compared to ER positive cancer, but not reaching the statistical significance level.
Conclusion
ER negative breast cancer was more aggressive, with larger tumor size and more non-mass type enhancement lesions, and was more likely to show malignant DCE kinetics and MRS features. These might be related to its poorer cellular differentiation and/or a higher angiogenesis.
Keywords: MR imaging, estrogen receptor, progesterone receptor, breast cancer, invasive ductal carcinoma, MR spectroscopy
Hormonal receptors, including estrogen receptor (ER) and progesterone receptor (PR), are important biomarkers that are evaluated at the time of diagnosis to decide the management protocol. It is used to determine whether the patient should receive hormonal therapy after completing all treatments. ER+/PR+ cancer is the most common type, followed by ER−/PR− then ER+/PR− [1, 2]. ER−/PR+ cancer is the most rare type [1]. The biology for mismatched ER and PR status is not clear [2]. ER negative cancer, which constitutes approximately 30% of the primary operable breast cancer, have unfavorable prognosis and fewer treatment options compared to ER positive cancer [3]. Patients with ER+/PR+ tumors tend to develop osseous not brain metastases, and those with ER−/PR− tumors tend to develop brain metastases [4]. Compared with ER+/PR+ cancer, ER−/PR− cancer has a poorer clinical outcome and shorter medium survival [5-9].
Correlation of dynamic contrast-enhanced MRI (DCE-MRI) findings with histopathological characteristics, prognostic factors, or tumor vasculature of breast cancer had been reported before [10-15]. ER, HER-2 (human epidermal growth factor), and Ki-67 (cell proliferation marker) are commonly analyzed prognostic biomarkers, as well as for determining targeted treatment, thus often available to be included in correlation analysis. The morphological features (margin and shape, rim enhancement) and contrast enhancement kinetics (early maximal enhancement and washout) of breast cancer shown on DCE-MRI have been correlated with tumor histological type, grade, and biomarkers including hormonal receptor, Ki-67, and HER-2 [10, 13-15]. However, these studies were not designed to focus on comparing MRI features between ER positive and negative breast cancer, based on descriptors defined in the Breast imaging reporting and data system atlas published by the American College of Radiology (BI-RADS atlas or ACR BI-RADS lexicon) [16].
The purpose of this study is to compare BI-RADS defined MR imaging features and lymph node status between ER positive and negative breast cancer. Since the increase of choline (Cho) is regarded as a marker for elevated cellular proliferation rates in breast cancer [17-19], choline measured by MR spectroscopy between ER positive and negative cancers is also reported.
MATERIALS AND METHODS
Patients
This retrospective study consisted of 92 consecutive patients enrolled into a breast MRI study from January 2004 to December 2005. Only patients who were confirmed to have invasive ductal carcinoma (IDC) were included. They were referred to the study from our University Medical Center and a local private hospital. Subjects either had suspicious findings or already had needle-biopsy proven invasive cancer. Two patients had excision biopsy prior to MRI, and were excluded. Therefore, a total of 90 patients were analyzed in this study, 51 with ER positive and 39 with ER negative cancer. Three patients had bilateral cancers; 2 had bilateral ER positive cancers and the other had bilateral ER negative cancers. Therefore, there were a total of 93 cancers from 93 affected breasts, 53 ER positive and 40 ER negative. The age range for the ER positive patients was from 36 to 77 years old (average 54 years old), and for ER negative patients was from 28 to 79 years old (average 48 years old, P < 0.05). Thirty-eight ER positive patients and 20 ER negative patients received surgery soon after the biopsy. Thirteen ER positive patients (13/51, 25%) and 19 ER negative patients (19/39, 49%, P < 0.05) received neoadjuvant chemotherapy before surgery.
The progesterone receptor (PR) status was available for 70 patients, including 36 ER positive patients (32 PR positive and 4 PR negative) and 34 ER negative patients (33 PR negative and 1 PR positive). The status of ER and PR was examined by pathologists at these two hospitals separately. It was considered negative if immunoperoxidase staining of tumor cell nuclei was less than 5%. The PR status was not consistently reported for patients referred from the private hospital. This study was approved by the institutional review board (IRB) and was HIPPA-compliant (Health Insurance Portability and Accountability Act, enacted by the U.S. Congress in 1996). All patients gave informed consent.
A subgroup of patients, including 30 ER positive patients and 18 ER negative patients, also had MR spectroscopy study for evaluation of choline using either single voxel (SV) method (42 patients) or multi-voxel chemical shift imaging (CSI) method (6 patients). The MRS protocol was added only when the subject could tolerate the additional scan time, therefore not all patients had MRS study in the scanning protocol.
MR Imaging Protocol
The MRI study was performed using a 1.5 T Phillips Eclipse MR scanner with a standard bilateral breast coil (Philips Medical Systems, Cleveland, Ohio). The imaging protocol consisted of high-resolution pre-contrast imaging from the concerned breast, bilateral dynamic contrast-enhanced imaging, and MR spectroscopy. After setting the IV line, the patient was placed into the scanner in prone position. The breasts were gently cushioned inside the coil with rubber foam to reduce motion. After the localizer scan to define the location of breasts, sagittal view unilateral pre-contrast T1-weighted images (T1WI) were acquired from the breast of concern, using a spin echo pulse sequence with TR = 1000 ms, TE = 12 ms, FOV = 20 cm, matrix size = 256 × 256. Thirty to forty slices with 3−4 mm thickness were prescribed to cover the entire breast and part of axillary region. Following this, a 3D SPGR (RF-FAST) pulse sequence with 16 frames (repetitions) was prescribed for bilateral dynamic imaging. Thirty-two axial slices with 4 mm thickness were used to cover both breasts. The imaging parameters were TR = 8.1 ms, TE = 4.0 ms, flip angle = 20°, matrix size = 256 × 128, FOV = 38 cm. The scan time was 42 sec per acquisition. The sequence was repeated 16 times for dynamic acquisitions, four pre-contrast, and 12 post-contrast sets. The 4 pre-contrast frames were for obtaining a good baseline, and the 12 post-contrast frames allowed for measurements of enhancement time course up to 8 minutes. The contrast agent (Omniscan®, 1 cc/10 lbs body weight) was manually injected at the beginning of the 5th acquisition, and was timed to finish in 12 seconds to make the bolus length consistent for all patients. Immediately following the contrast, 10 cc saline was injected to flush in all contrast medium.
After the dynamic scan was completed, subtraction images were generated on the scanner console, by subtracting the pre-contrast images acquired in Frame #3 from the 1-min post contrast enhanced images acquired in Frame #6. The maximum intensity projections (MIPs) were also generated from the set of subtraction images. The enhancement kinetics were analyzed from manually-drawn tumor ROI (region of interest) on each imaging slice containing the lesion, encompassing enhanced tissues on subtraction images taken at 1-min post injection. The MIP was used as the reference for ROI drawing. The vessels were clearly shown on the MIP, and could be excluded. This approach minimized subjective arbitrary ROI selection by the operator, also since it was based on early enhancements at 1-min after injection, only well perfused tissues were included. The percent enhancement time course was calculated by subtracting the pre-contrast signal intensity (mean of first 4 frames) from each of the subsequent 12 post-contrast signal intensities, then normalized to the pre-contrast signal intensity. The fitting was performed based on 2-compartmental pharmacokinetic model [20], using an in-house developed software written in Matlab (version 6.0.0.88, The MathWorks, Inc.).
MR Spectroscopy
Single-Voxel Acquisition
The localized single-voxel 1H MR spectra were acquired from 42 patients using the point-resolved spectroscopic sequence (PRESS) [21]. The spectroscopic voxel was placed on subtraction image acquired at 1-min post injection. The voxel size was 1.8 × 1.8 × 1.8 (or, 2.0 × 2.0 × 2.0) cm3. It was carefully positioned to maximize coverage of the enhanced lesion on the subtraction images and minimize the inclusion of adipose tissue shown on pre-contrast non fat-sat images. Voxel shimming was performed for optimization of field homogeneity, and the typical line width of the water peak (full width at half-maximum; FWHM) was 8 to 17 Hz. The water suppression was performed by using a three pulse chemical shift selective (CHESS) RF pulses [22], and fat signal was independently attenuated by using inversion recovery (STIR)-based signal nulling. The PRESS sequence parameters were: TE = 270 msec, TR = 2000 msec, data points = 2048, spectral bandwidth = 1953 Hz, and acquisition averages = 128. A fully relaxed, unsuppressed spectrum (24 averages) was also acquired to measure the water and lipid peaks as the internal reference for calculating absolute Cho concentration [23, 24].
Multiple-Voxel Chemical Shift Imaging
Six patients underwent CSI MRS study. The CSI grid was carefully positioned to maximize coverage of the hypointense lesion on the sagittal non fat-sat T1-weighted images and the contrast-enhancing lesions on the subtraction images, using PRESS. The parameters were TR/TE = 1627/270 ms, matrix size = 8 × 8, FOV = 8 cm, and sagittal section thickness =12mm. In order to improve the signal-to-noise, 4 acquisitions were taken. The resultant voxel size was 1.0 × 1.0 × 1.2 cm3. The echo signal was digitized with 2048 data points and a spectral width of 2040 Hz. To improve field homogeneity over the CSI localization volume, a relatively large single voxel shimming (i.e., 10 × 10 × 10 cm3) centering at the suspicious lesion was performed, and then these shim values were passed on to the CSI scans. After the shimming procedure the suppression of the water was accomplished with three CHESS RF pulses with a bandwidth of 64 Hz, and fat signal was attenuated by using frequency-selective presaturation pulse (FATSAT).
Interpretation of MRI Features and Analysis of MRS
MR imaging was interpreted by a board certified senior radiologist with 18 years experience in interpreting body imaging and 2.5 years in interpreting breast MRI. The morphological and enhancement kinetic features were analyzed based on ACR BI-RADS MRI lexicon. The morphology included mass type and non-mass type lesions. The mass type includes focus/foci (smaller than 5mm) and mass (equal to or greater than 5 mm). When a breast had more than one lesion and those lesions were not connected, it was categorized as having multiple lesions. The non-mass enhancement lesions can be further described as patchy, linear, ductal, segmental, regional, multiple regions, and diffuse enhancements.
The evaluation of enhancement kinetic curve was based on initial phase (within the first 2 minutes or when the curve starts to change), and late phase (after 2 minutes or after the change). The initial enhancement phase is further categorized into fast, medium, and slow. The late enhancement phase is described as persistent, plateau, and washout [16, 25-27]. For measurement of tumor size, the longest dimension of the tumor which appeared on the maximal intensity projection (MIP) image was recorded. When there were multiple lesions in one breast, only the biggest tumor was measured. Additionally, in mass lesions whether they were showing rim enhancement pattern was evaluated. The vessel enhancements could be easily identified and excluded on MIP.
The nodal status was evaluated by imaging, as well as by pathological examination for surgery patients who received axillary node dissection. The pathological nodal status of patients who received neoadjuvant chemotherapy before surgery was not analyzed. Imaging finding was evaluated based on empirical observation of the axillary node covered on sagittal view, non fat-sat, pre-contrast T1WI. An enlarged lymph node was defined as a node greater than 5 mm that showed loss of fatty hilum. It was considered as suspicious of malignancy. The size of the enlarged node, however, was not measured in this study.
For single voxel MR spectroscopy, the concentration of choline-containing compounds was calculated using water as an internal reference [23, 24]. When the concentration was greater than 1.0 mmol/kg, the lesion was considered Cho-positive. For multi-voxel MR spectroscopy, the CSI raw data were reconstructed using data analysis package on the MRI console. Phase and baseline corrections were manually done for each voxel. When the maximum peak of water was assigned to 4.7 ppm, typically the Cho peak was resolved at 3.22 ppm (range, 3.16 − 3.28 ppm) in breast tumors. The MR spectrum was further analyzed when Cho peak could be clearly identifiable above the baseline noise. The signal-to-noise ratio (SNR) of the Cho peak was calculated as the ratio of Cho peak height to background noise level, which was measured in the flat noise baseline region (> 8 or < 0 ppm). If there was any single voxel with Cho SNR > 2, the lesion was categorized as with Cho-positive [28].
Statistical Analysis
Patients’ age and tumor size between ER +/− groups were compared using two-tailed student t-test. Other imaging features including tumor morphology, presence of multiple lesions, rim enhancement, choline detection, axillary lymph node on MRI, and pathological axillary lymph nodes status were compared using Fisher's Exact test. The ratio of positive nodes over the total number of removed nodes between ER +/− groups were compared with the Chi-Square test.
RESULTS
MR Morphological Features
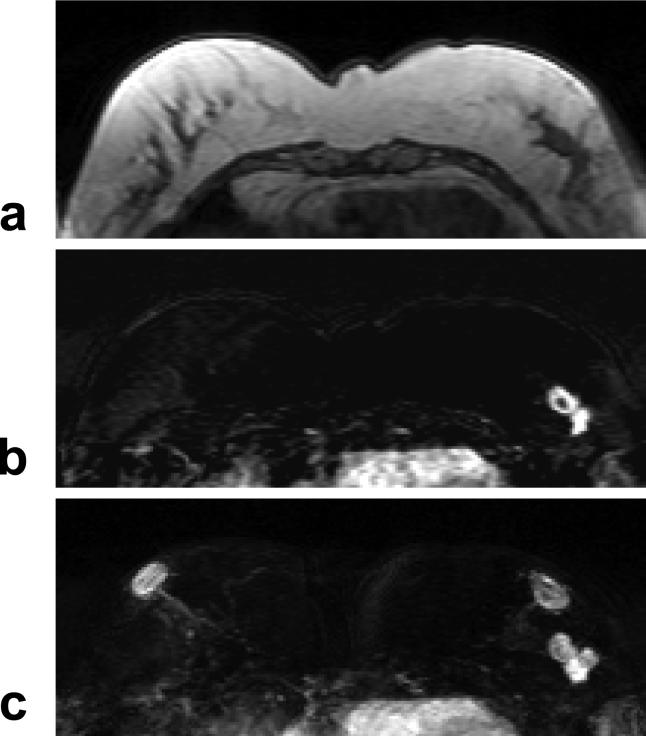
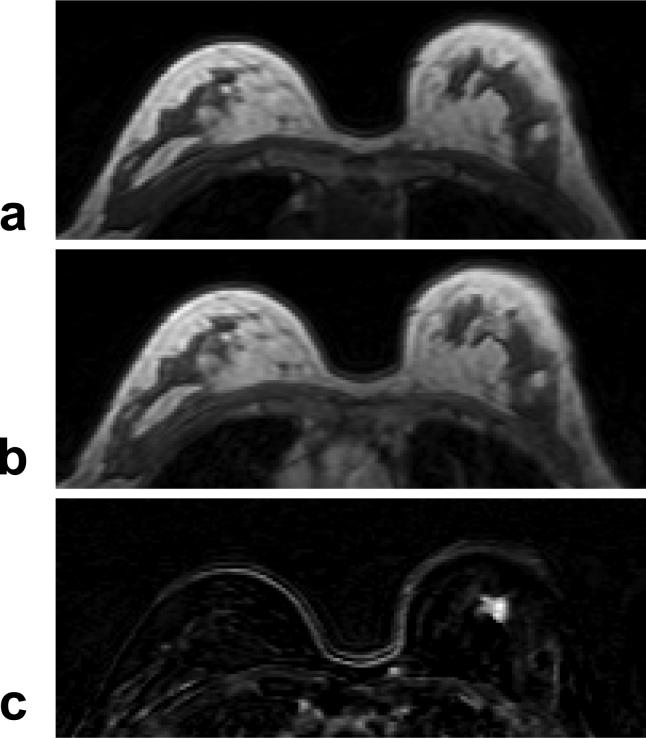
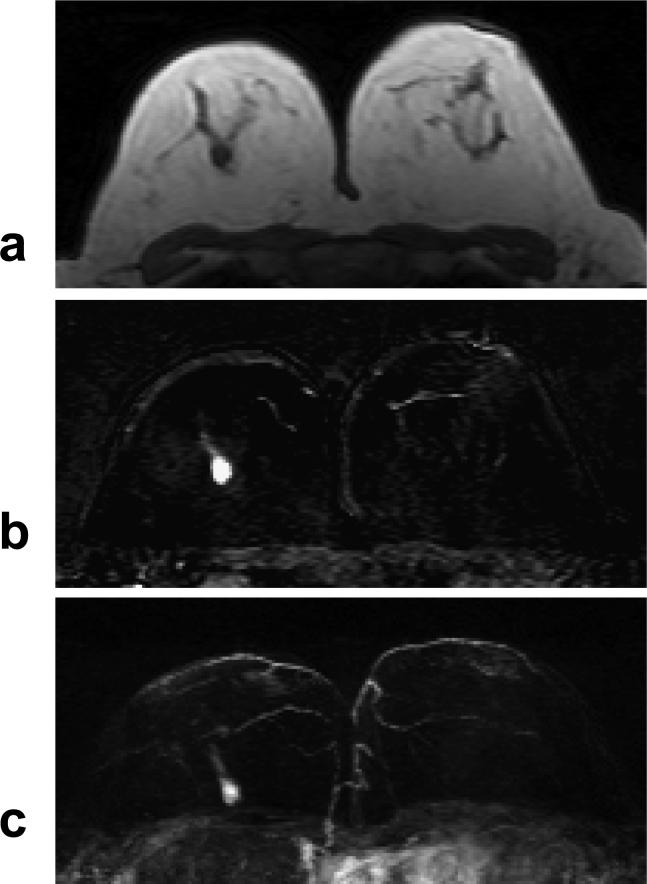
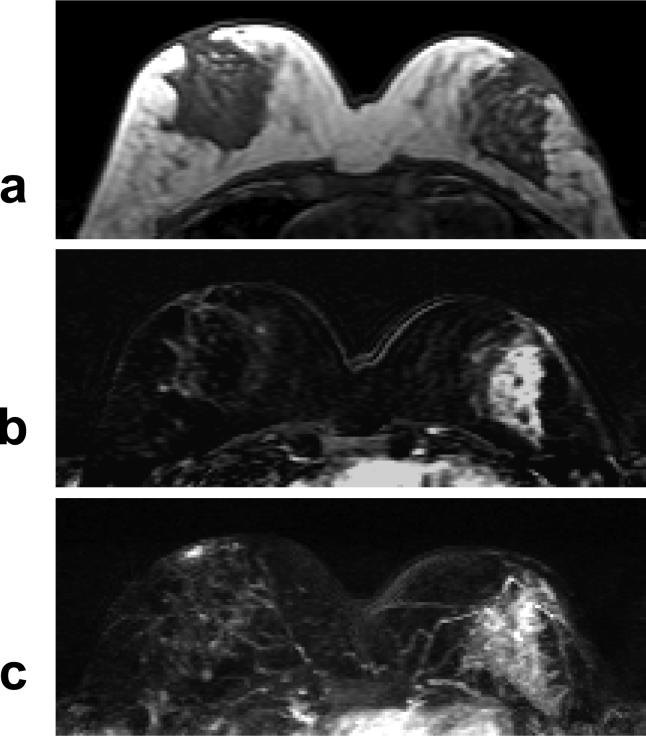
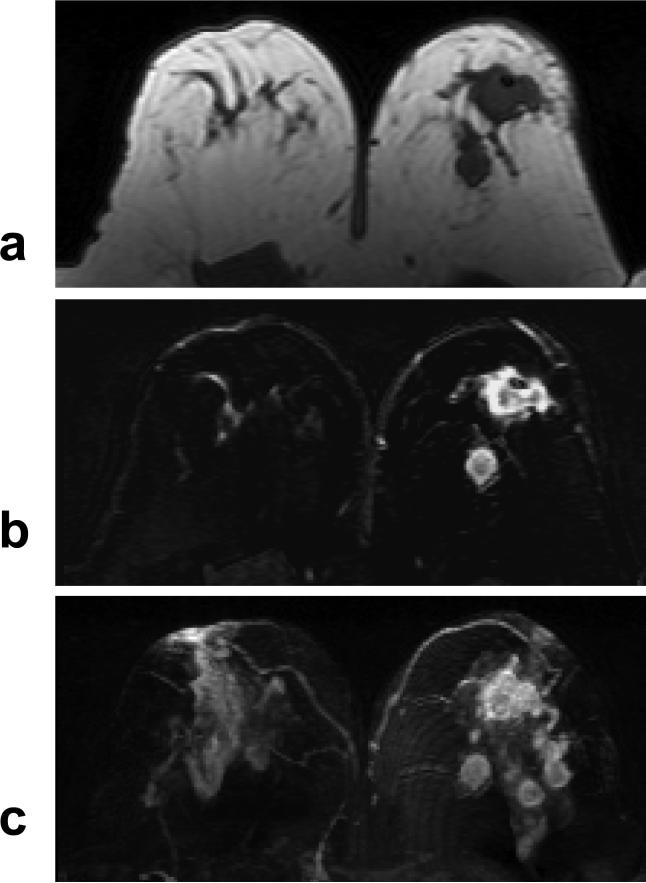
Table 1 summarizes the comparison of analyzed MRI features between the 53 ER positive cancers (from 51 patients, 2 with bilateral cancers) and 40 ER negative cancers (from 39 patients, 1 with bilateral cancers). All 53 ER positive cancers showed mass type lesions. Thirty-three of 40 ER negative cancers (82.5%) showed mass type lesions and 7 (17.5%) showed non-mass type enhancements, including 5 diffuse and 2 regional enhancements. Therefore, ER negative cancers were more likely to show non-mass type lesions (7/40 vs. 0/53, P < 0.005). Figure 1 and Figure 2 show two examples of ER positive mass lesions, Figure 3 shows a patient with ER negative mass lesion, and Figure 4 shows an ER negative non-mass lesion. Except for very ill-defined lesions, tumor size was measured for 52 ER positive cancers and 37 ER negative cancers. The tumor size in the ER negative group ranged from 8 mm to 9 cm (3.6 ± 2.0 cm), which was significantly larger than that in the ER positive group (4 mm to 6 cm, 1.8 ± 1.3 cm, P < 0.00005).
Table 1.
Comparison of MR Imaging Features between ER Positive and Negative Cancers
| ER positive | ER negative | P value | |
|---|---|---|---|
| MR imaging features | |||
| Tumor size | 1.8 ± 1.3 cm | 3.6 ± 2.0 cm | < 0.00005 |
| Mass-type lesion | 53/53 (100%) | 33/40 (82%) | < 0.005 |
| Non-mass type lesion | 0/53 (0%) | 7/40 (18%) | < 0.005 |
| Rim enhancement | 7/53 (13%) | 9/33 (27%) | 0.15 |
| Lesion multiplicity | 16/53 (30%) | 9/33 (27%) | 0.81 |
| Malignant DCE kinetics | 45/50 (90%) | 31/31 (100%) | 0.15 |
| Detectable choline | 16/30 (53%) | 13/18 (72%) | 0.23 |
Figure 1.
A 47 year-old woman with ER positive IDC. a: Pre-contrast T1 weighted image shows a hypointense lesion in the left breast. b: Post-contrast subtraction image at 1-min after injection shows a lesion with rim-enhancement, and another connected lesion. c: Maximal intensity projection (MIP) image shows three connected enhanced lesions, approximately 2 cm. The nipples in both breasts are enhanced. The MR spectrum measured this patient is shown in Figure 8b.
Figure 2.
A 63 year-old woman with ER positive IDC. a: Pre-contrast T1 weighted image does not show suspicious lesions. b: Post-contrast enhanced image taken at 5-min after injection. c: Post-contrast subtraction image taken at 5-min clearly shows a 1-cm enhanced lesion in the left breast. The DCE kinetics measured from this lesion is shown in Figure 7b.
Figure 3.
A 55 year-old woman with ER negative IDC. a: Pre-contrast T1 weighted image shows a hypointense mass in the right breast. b: Post-enhanced subtraction image shows a strongly enhanced 1-cm lesion. c: Maximal intensity projection (MIP) image shows a solitary lesion. The nipples in both breasts are not enhanced. The DCE kinetics measured this lesion is shown in Figure 7a.
Figure 4.
A 40 year-old woman with ER negative IDC. a: Pre-contrast T1 weighted image does not show suspicious lesion. b: Post-contrast subtraction image shows a non-mass type lesion with regional or segmental enhancements, without clearly-defined borders. c: Maximal intensity projection (MIP) image also demonstrates a non-mass type lesion.
The presence of rim enhancement pattern and multiple lesions was compared between mass type lesions in ER +/− groups. Seven of 53 ER positive mass cancers (7/53) and nine of 33 ER negative cancers (9/33) showed rim enhancement pattern (P = 0.15). Sixteen of 53 ER positive mass cancers (7/53) and nine of 33 ER negative cancers (9/33) showed multiple lesions (P= 0.81). Figure 5 shows an example from an ER negative patient with 4 separate mass lesions. These two features could not be evaluated in lesions exhibiting non-mass type enhancements.
Figure 5.
A 47 year-old woman with ER negative IDC. a: Pre-contrast T1 weighted image shows 2 hypointense mass lesions in the left breast. b: Contrast enhanced subtraction image shows two enhanced lesions with rim-enhancement pattern. c: Maximal intensity projection (MIP) image shows 4 enhanced lesions in the left breast, with unspecific fibroglandular enhancements in the right breast. The MRS spectrum measured from the largest mass is shown in Figure 8a.
MR Enhancement Kinetics
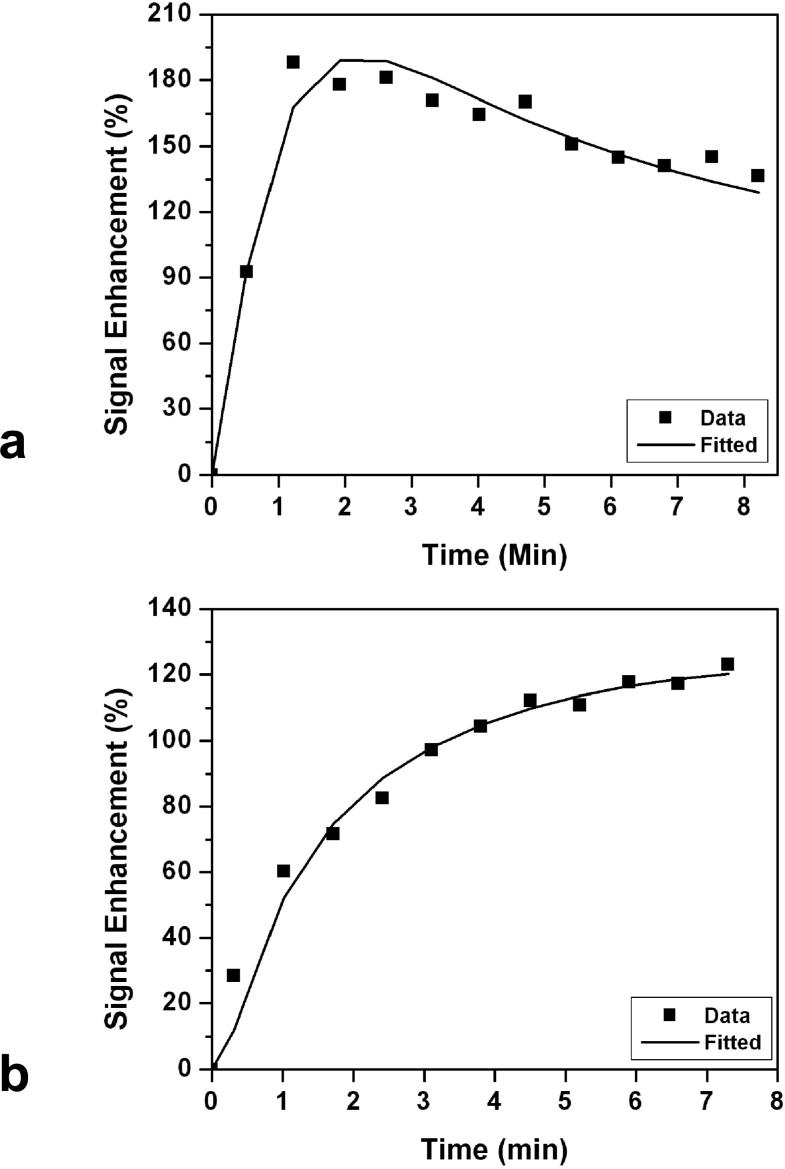
The enhancement kinetics was only measured from mass type lesions that were greater than 5 mm. All together the kinetics from 50 ER positive cancers and 31 ER negative cancers were measured. All 31 in ER negative group showed the malignant type kinetics with rapid enhancements in the initial phase followed by washout (N = 29) or reaching to a plateau (N = 2) in the late phase. Of the 50 ER positive cancers, 45 showed the malignant enhancement pattern (44 washout and 1 plateau in the late phase); and 5 showed the benign enhancement kinetics with the persistent enhancement pattern. The difference between ER positive and ER negative cancers showing malignant kinetic features was not statistically significant (45/50 vs. 31/31, P = 0.15). Figure 6 shows two examples of DCE kinetics, a malignant curve from a ER negative patient (shown in Figure 3), and a benign curve from a ER positive patient (shown in Figure 2).
Figure 6.
a: An example of malignant type DCE kinetics with rapid initial enhancement followed by wash-out in the late phase. This was measured from the lesion shown in Figure 3. b: An example of benign type DCE kinetics with continuous enhancements, measured from the lesion shown in Figure 2.
MR and Pathological Axillary Lymph Node Status
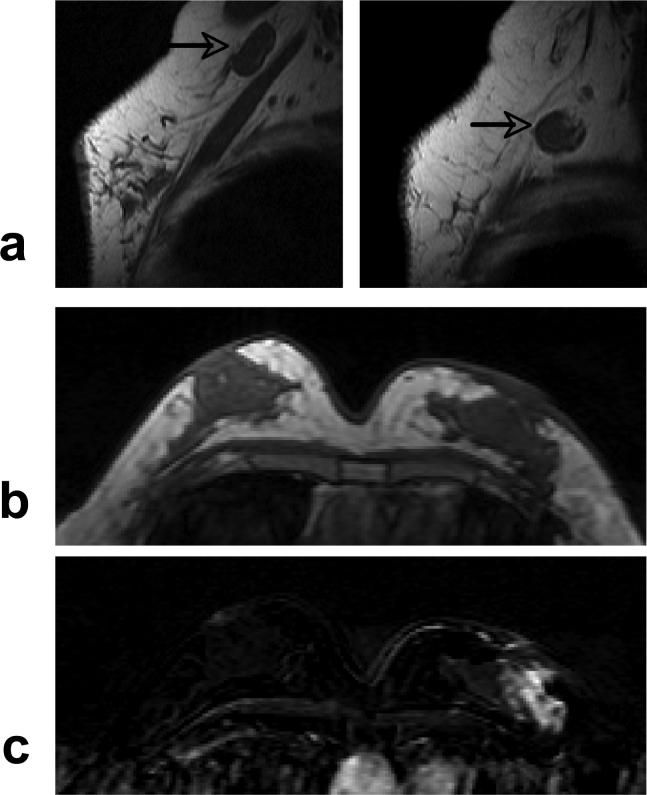
The lymph node findings are summarized in Table 2. Figure 7 shows an example from an ER negative patient with two enlarged axillary nodes, and a non-mass lesion in the breast. Eleven ER positive patients (11/51, 22%) and 17 ER negative patients (17/39, 44%) showed enlarged axillary lymph nodes on MRI, significantly higher in ER negative patients (P <0.05). For patients who received neoadjuvant chemotherapy, 5 of 13 ER positive patients (38%) and 12 of 19 ER negative patients (63%) showed enlarged nodes, higher in ER negative group (P = 0.28). For patients who received surgery soon after biopsy, 6 of 38 ER positive patients (16%) and 5 of 20 ER negative patients (25%) had enlarged nodes, which was not significantly different (P = 0.48).
Table 2.
MRI and Pathological Axillary Lymph Nodes in ER Positive and Negative Patients
| ER positive | ER negative | P value | |
|---|---|---|---|
| MRI Axillary Lymph Nodes | |||
| All Patients | 11/51 (22%) | 17/39 (44%) | < 0.05 |
| Neoadjuvant Chemo Patients | 5/13 (38%) | 12/19 (63%) | 0.28 |
| Surgery Patients |
6/38 (16%) |
5/20 (25%) |
0.48 |
| Pathological Axillary Lymph Nodes (Surgery Patients Only) | |||
| Number of patients with positive nodes after axillary node dissection | 6/12 (50%) | 6/9 (67%) | 0.66 |
| Total number of positive lymph nodes / total lymph nodes removed | 22/153 | 12/168 | 0.54 |
| Number of patients with ratio of positive nodes to total removed nodes ≥ 25% | 2/12 | 2/9 | 1.0 |
Figure 7.
A 51 year-old woman with ER negative IDC. a: Pre-contrast sagittal view T1 weighted images from two imaging slices show two enlarged lymph nodes (arrows), one oval and one round, with complete loss of fatty hilum. b: Pre-contrast axial view T1 weighted image does not show suspicious lesion. c: Post-contrast subtraction image shows a non-mass type lesion with regional enhancements.
Of the 38 ER positive and 20 ER negative patients who received surgery, 12 ER positive and 9 ER negative patients also underwent axillary lymph node dissection. Six of 12 ER positive patients (6/12, 50%) and 6 of 9 ER negative patients (6/9, 67%) have positive lymph nodes, which was not statistically different (P = 0.66). Other comparisons between ER positive vs. negative patients, including the number of positive nodes over the total removed nodes (22/153 vs. 12/168, P = 0.54), and number of patients with the ratio of positive nodes to total removed nodes ≥ 25% (2/12 vs. 2/9, P = 1), were also not significantly different.
Choline Detection Using MR Spectroscopy
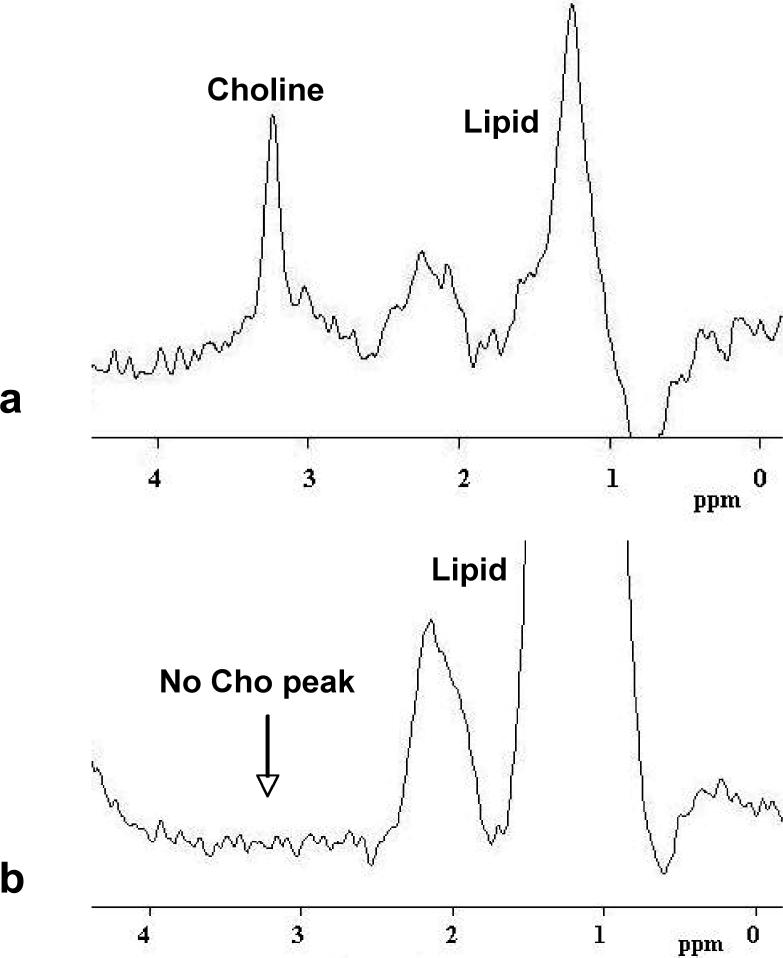
A total of 48 patients (30 ER positive and 18 ER negative patients) underwent MR spectroscopy for choline measurements (Table 3). Sixteen of the 30 ER positive patients (53%) and 13 of the 18 ER negative patients (72%) showed positive choline, which was not significantly different (P = 0.23). Figure 8 shows two examples of MRS spectrum, one from an ER negative patient (shown in Figure 5) with a clear Cho peak, and the other from an ER positive patient (shown in Figure 1) without an identifiable Cho peak. To take the possible confounding factor of lesion size into account, the detection of choline was further compared among patients with tumors larger than 1cm (25 of 30 ER positive patients and 17 of 18 ER negative patients). Still, no significant difference was found between them (16/25, 64% vs. 13/17, 76%; P = 0.5).
Table 3.
MR Spectroscopic Choline Measurement for ER Positive and Negative Patients
| ER positive (N=30) | ER negative (N=18) | P value | |
|---|---|---|---|
| MR spectroscopy methods | |||
| Single voxel (SV) | 15/27 (56%) | 10/15 (67%) | 0.53 |
| Chemical shift imaging (CSI) | 1/3 (33%) | 3/3 (100%) | 0.40 |
| Total | 16/30 (53%) | 13/18 (72%) | 0.23 |
Figure 8.
a: An example of MRS spectrum showing an identifiable Choline peak at 3.2 ppm. This spectrum was measured from the largest lesion shown in Figure 5. b: An example of MRS spectrum without an identifiable Choline peak around 3.2 ppm. This spectrum was measured from the lesion shown in Figure 1.
DISCUSSION
Positive ER in breast cancer is considered as a favorable prognostic indicator. Compared to ER negative counterpart, the cells are more likely to be well-differentiated, less aggressive, and it has more therapeutic options such as estrogen receptor blockers or aromatase inhibitors. It has been shown that ER-alpha expression in the transfected ER negative cancer cell lines inhibited their proliferation and metastatic potential [29]. The less aggressive phenotype of ER positive cancer was possibly mediated through lower grade (better cellular differentiation) and lower angiogenesis as compared to that of ER negative cancer. Koukourakis et al. reported an inverse association of microvascular density with ER expression [30]. In post-menopausal patients, a higher percentage of VEGF (vascular endothelium growth factor) positive cells were found in ER negative tumors. These ER-negative tumors were characterized by a higher proliferative activity [31]. The precise mechanisms for oncogenic and angiogenic activities in ER negative breast cancer are not fully understood [32]. However, a high level of ER-alpha is believed to be favorable in the prognosis and treatment of breast cancer because of its inhibitory effect on such angiogenic pathways.
In our study, the ER negative patients were significantly younger than that of the ER positive counterpart. This finding was consistent with results in Klauber-DeMore et al. reporting that younger women with breast cancer are more likely to be ER negative [33].
Our results showed that ER negative cancer had bigger tumors at the time of diagnosis, and more frequently presenting non-mass type lesions than that of ER positive caner. An in vivo study on tumor xenografts demonstrated that subsequent to ER-alpha overexpression, down-regulation of VEGF and an inhibition of vascularization were observed [29]. Tumor growth was found to be more aggressive in mice inoculated with parent Ishikawa (ISH) and vector-control ISH-NON cells, whereas it was significantly slower in the case of ER-transfected ISH-ER cells [29]. In a recent study by Esserman et al, they compared MRI features with the biology of ductal carcinoma in situ, and found that focal and small lesions with low-grade were more common in ER positive tumors, whereas clumped regional lesions were more frequently noted in large, ER negative, and highly proliferative tumors [34]. This result supported our finding that ER negative cancer had more non-mass type lesions. A pathological analysis of ER negative breast cancer provided evidence demonstrating that ER negative tumor had several common morphological features including high-grade comedo-type necrosis, lymphoid stroma, central necrosis/fibrosis and pushing margins [3]. These pathological features are more likely to present non-mass enhancements in MRI. The larger tumor size and more infiltrative pattern of non-mass type enhancements noted in the ER negative group might be due to increased tumor angiogenesis or higher grade of cell differentiation given the above-mentioned evidence; although non-mass type enhancements can also be seen in benign proliferative process such as fibrocystic changes [35].
We found that ER negative cancer was more likely to show rim enhancement pattern than ER positive counterpart, but not reaching the significance level. Several studies investigated the relationship between rim enhancement shown on MRI and the common histopathological prognostic factors [15, 36]. In a study of 106 women with invasive breast carcinomas, Jinguji et al. reported that rim enhancement pattern appeared more commonly in patients with negative ER status, lymph node metastasis, and blood vessels invasion [36]. It was also more frequent in cancer with a higher histological grade and larger tumor size. In a study of 86 malignant breast lesions by Teifke et al., rim enhancement was the most accurate prognostic criterion associated with negative ER status, high tumor grade, and positive lymph node [15]. ER negative tumors exhibited markedly higher microvessel density than did ER positive tumors.
Studies on the correlation of enhancement kinetics with ER status reported varying results [10, 13, 14]; some showed positive correlation of rapid enhancements with negative ER status [13], but others not [10, 14]. Our study did not demonstrate significant difference of enhancement kinetics between both groups, albeit ER negative cancer had slightly higher rate showing the malignant DCE kinetic features with rapid initial enhancement followed by washout. As the pattern of DCE kinetic was heavily dependent on the ROI selection, it might be difficult to compare between different studies.
The status of axillary lymph nodes is regarded as one of the most important prognostic factors for the overall and disease-free survival of patients with breast cancer. Several studies have consistently reported that both ER and PR were not reliable predictors of lymph nodes metastasis. The independent predictors were primary tumor size and aggressive pathology, such as presence of lymphatic/vascular invasion, infiltrative margin, and high histologic grade [37-40]. We did not find significant difference in the pathological axillary node status between ER positive and negative patients. Although a higher percent of ER negative patients (17/39, 44%) had enlarged nodes on MRI compared to ER positive patients (11/51, 22%), this finding seemed to reflect the more aggressive cancers of the ER negative patients enrolled into our study. A higher percent of ER negative patients (19/39, 49%) compared to ER positive patients (13/51, 25%) received neoadjuvant chemotherapy. Only patients with > 5 cm tumors or enlarged nodes were referred to the neoadjuvant chemotherapy protocol. Since the chemotherapy would down stage the nodal status, the pathological nodal examination was not performed in this group of patients.
Most ER positive patients in our study were accompanied with positive PR; and ER negative patients with negative PR. Only 4 patients showed ER+/PR− and one patient showed ER−/PR+. There were no published studies reporting the relationship between PR status and tumor angiogenesis, tumor morphology, or lymph nodes metastasis in breast cancer. Another biomarker, Her-2/neu, was known to be associated with an aggressive tumor phenotype and reduced survival rate, thus might affect the MRI features of breast cancer [41]. However, due to the small number of patients in our study, the interplay of different biomarkers on the presentation of MR imaging features can not be thoroughly investigated. A larger scale multivariate study is needed.
Choline kinase (ChoK) is the enzyme responsible for the generation of phosphorylcholine, a metabolite that is involved in cell proliferation. Choline transport rates and choline kinase activity were found to increase remarkably in the breast cancer cells with elevated expression of phosphocholine [18]. Ramirez et al. reported a significant association between ChoK overexpression with high histologic tumor grade and ER negative status (p =0.037) [42]. The association was possibly mediated through higher cell proliferation [3]. Our result showed a higher choline detection rate in ER negative patients (72%) compared to ER positive patients (53%), but not reaching the significance level. The Cho detection rate was relatively low, which might be related to technical difficulty in small cancers. When excluding tumors small than 1 cm, the Cho detection rate was increased to 64% in ER positive and 76% in ER negative cancers. A larger study is needed to further understand the association between Cho and ER status.
One major limitation of this study was the subject population not representing the normal patient composition in a diagnostic or a clinical setting, despite that they were consecutive patients referred to this study. This study had 51 patients (57%) with ER positive cancer and 39 patients (43%) with ER negative cancer, which did not reflect the composition in the clinical setting, approximately 70% ER positive and 30% ER negative. However, since we only included patients with IDC, this might shift the composition towards a higher ER negative rate. Invasive lobular cancer (ILC) was the second common type of breast cancer, and most ILC was ER positive. ILC is known to exhibit different lesion phenotype, and they had to be excluded in our analysis. Another limitation is the small number of subjects and the retrospective nature. A larger prospective study done in a diagnostic setting is optimal.
In summary, ER positive and ER negative breast cancers demonstrated different imaging features on MRI. ER negative cancer appeared to be more aggressive, with bigger tumor size, more prominent tumor infiltration showing non-mass enhancements. ER negative cancer had a higher frequency to show rim enhancement pattern and the malignant type enhancement kinetics, but not reaching the statistical significance level. These imaging features might be associated with its poorer cellular differentiation and/or a higher angiogenic activity. A higher percentage of ER negative patients had enlarged lymph nodes on MRI, which was associated with more aggressive disease and a higher number of patients undergoing neoadjuvant chemotherapy protocol. For patients who received surgery after biopsy, the MRI and pathological nodal status was not significantly different between ER positive and negative patients. Choline detection rate was slightly higher in ER negative patients, but not significant, which will need to be investigated in a larger study.
REFERENCES
- 1.Yasui Y, Potter JD. The shape of age-incidence curves of female breast cancer by hormone-receptor status. Cancer Causes Control. 1999;10:431–437. doi: 10.1023/a:1008970121595. [DOI] [PubMed] [Google Scholar]
- 2.Bernoux A, de Cremoux P, Lainé-Bidron C, Martin EC, Asselain B, Magdelénat H. Estrogen receptor negative and progesterone receptor positive primary breast cancer: pathological characteristics and clinical outcome. Institut Curie Breast Cancer Study Group. Breast Cancer Res Treat. 1998;49:219–225. doi: 10.1023/a:1006011328655. [DOI] [PubMed] [Google Scholar]
- 3.Putti TC, El-Rehim DM, Rakha EA, et al. Estrogen receptor-negative breast carcinomas: a review of morphology and immunophenotypical analysis. Mod Pathol. 2005;18:26–35. doi: 10.1038/modpathol.3800255. [DOI] [PubMed] [Google Scholar]
- 4.Maki DD, Grossman RI. Patterns of disease spread in metastatic breast carcinoma: influence of estrogen and progesterone receptor status. AJNR Am J Neuroradiol. 2000;21:1064–1066. [PMC free article] [PubMed] [Google Scholar]
- 5.Sanna G, Franceschelli L, Rotmensz N, et al. Brain metastases in patients with advanced breast cancer. Anticancer Res. 2007;27:2865–2869. [PubMed] [Google Scholar]
- 6.Tham YL, Sexton K, Kramer R, Hilsenbeck S, Elledge R. Primary breast cancer phenotypes associated with propensity for central nervous system metastases. Cancer. 2006;107:696–704. doi: 10.1002/cncr.22041. [DOI] [PubMed] [Google Scholar]
- 7.Stemmler HJ, Kahlert S, Siekiera W, Untch M, Heinrich B, Heinemann V. Characteristics of patients with brain metastases receiving trastuzumab for HER2 overexpressing metastatic breast cancer. Breast. 2006;15:219–225. doi: 10.1016/j.breast.2005.04.017. [DOI] [PubMed] [Google Scholar]
- 8.Chang J, Clark GM, Allred DC, Mohsin S, Chamness G, Elledge RM. Survival of patients with metastatic breast carcinoma: importance of prognostic markers of the primary tumor. Cancer. 2003;97:545–553. doi: 10.1002/cncr.11083. [DOI] [PubMed] [Google Scholar]
- 9.Wronski M, Arbit E, McCormick B. Surgical treatment of 70 patients with brain metastases from breast carcinoma. Cancer. 1997;80:1746–1754. doi: 10.1002/(sici)1097-0142(19971101)80:9<1746::aid-cncr8>3.0.co;2-c. [DOI] [PubMed] [Google Scholar]
- 10.Montemurro F, Martincich L, Sarotto I, et al. Relationship between DCE-MRI morphological and functional features and histopathological characteristics of breast cancer. Eur Radiol. 2007;17:1490–1497. doi: 10.1007/s00330-006-0505-x. [DOI] [PubMed] [Google Scholar]
- 11.Mussurakis S, Buckley DL, Horsman A. Dynamic MR imaging of invasive breast cancer: correlation with tumour grade and other histological factors. Br J Radiol. 1997;70:446–451. doi: 10.1259/bjr.70.833.9227224. [DOI] [PubMed] [Google Scholar]
- 12.Furman-Haran E, Schechtman E, Kelcz F, Kirshenbaum K, Degani H. Magnetic resonance imaging reveals functional diversity of the vasculature in benign and malignant breast lesions. Cancer. 2005;104:708–718. doi: 10.1002/cncr.21225. [DOI] [PubMed] [Google Scholar]
- 13.Szabo BK, Aspelin P, Kristoffersen WM, Tot T, Bone B. Invasive breast cancer: correlation of dynamic MR features with prognostic factors. Eur Radiol. 2003;13:2425–2435. doi: 10.1007/s00330-003-2000-y. [DOI] [PubMed] [Google Scholar]
- 14.Stomper PC, Herman S, Klippenstein DL, et al. Suspect breast lesions: findings at dynamic gadolinium-enhanced MR imaging correlated with mammographic and pathologic features. Radiology. 1995;197:387–395. doi: 10.1148/radiology.197.2.7480682. [DOI] [PubMed] [Google Scholar]
- 15.Teifke A, Behr O, Schmidt M, et al. Dynamic MR imaging of breast lesions: correlation with microvessel distribution pattern and histologic characteristics of prognosis. Radiology. 2006;239:351–360. doi: 10.1148/radiol.2392050205. [DOI] [PubMed] [Google Scholar]
- 16.American College of Radiology . Breast imaging reporting and data system atlas (BI-RADS atlas) American College of Radiology; Reston, VA: 2003. [Google Scholar]
- 17.Eliyahu G, Kreizman T, Degani H. Phosphocholine as a biomarker of breast cancer: molecular and biochemical studies. Int J Cancer. 200;120:1721–1730. doi: 10.1002/ijc.22293. [DOI] [PubMed] [Google Scholar]
- 18.Ting Y-LT, Sherr D, Degani H. Variations in energy and phopholipid metabolism in normal and cancer human mammary epithelial cells. Anticancer Res. 1996;16:1381–1388. [PubMed] [Google Scholar]
- 19.Bartella L, Morris EA, Dershaw DD, et al. Proton MR spectroscopy with choline peak as malignancy marker improves positive predictive value for breast cancer diagnosis: preliminary study. Radiology. 2006;239:686–692. doi: 10.1148/radiol.2393051046. [DOI] [PubMed] [Google Scholar]
- 20.Tofts PS. Modeling tracer kinetics in dynamic Gd-DTPA MR imaging. J Magn Reson Imaging. 1997;7:91–101. doi: 10.1002/jmri.1880070113. [DOI] [PubMed] [Google Scholar]
- 21.Bottomley PA. Spatial localization in NMR spectroscopy in vivo. Ann NY Acad Sci. 1987;508:333–348. doi: 10.1111/j.1749-6632.1987.tb32915.x. [DOI] [PubMed] [Google Scholar]
- 22.Hasse A, Frahm J, Hanicke W, Mattaei D. 1H NMR chemical shift selective (CHESS) imaging. Phys Med Biol. 1985;30:341–344. doi: 10.1088/0031-9155/30/4/008. [DOI] [PubMed] [Google Scholar]
- 23.Bolan PJ, Meisamy S, Baker EH, et al. In vivo quantification of choline compounds in the breast with 1H MR spectroscopy. Magn Reson Med. 2003;50:1134–1143. doi: 10.1002/mrm.10654. [DOI] [PubMed] [Google Scholar]
- 24.Baik HM, Su MY, Yu H, Mehta R, Nalcioglu O. Quantification of choline-containing compounds in malignant breast tumors by 1H MR spectroscopy using water as an internal reference at 1.5 T. MAGMA. 2006;19:96–104. doi: 10.1007/s10334-006-0032-4. [DOI] [PubMed] [Google Scholar]
- 25.Ercolani P, Valeri G, Amici F. Dynamic MRI of the breast. Eur J Radiol. 1998;27:265–271. doi: 10.1016/s0720-048x(98)00073-4. [DOI] [PubMed] [Google Scholar]
- 26.Esserman L, Hylton N, George T, Weidner N. Contrast-Enhanced Magnetic Resonance Imaging to Assess Tumor Histopathology and Angiogenesis in Breast Carcinoma. Breast J. 1999;5:13–21. doi: 10.1046/j.1524-4741.1999.005001013.x. [DOI] [PubMed] [Google Scholar]
- 27.Kaiser WA, Zeitler E. MR imaging of the breast: fast imaging sequences with and without Gd-DTPA. Preliminary observations. Radiology. 1989;170:681–686. doi: 10.1148/radiology.170.3.2916021. [DOI] [PubMed] [Google Scholar]
- 28.Jacobs MA, Barker PB, Bottomley PA, Bhujwalla Z, Bluemke DA. Proton magnetic resonance spectroscopic imaging of human breast cancer: a preliminary study. J Magn Reson Imag. 2004;19:68–75. doi: 10.1002/jmri.10427. [DOI] [PubMed] [Google Scholar]
- 29.Ali SH, O'Donnell AL, Balu D, et al. Estrogen receptor-alpha in the inhibition of cancer growth and angiogenesis. Cancer Res. 2000;60:7094–7098. [PubMed] [Google Scholar]
- 30.Koukourakis MI, Manolas C, Minopoulos G, Giatromanolaki A, Sivridis E. Angiogenesis relates to estrogen receptor negativity, c-erbB-2 overexpression and early relapse in node-negative ductal carcinoma of the breast. Int J Surg Pathol. 2003;11:29–34. doi: 10.1177/106689690301100107. [DOI] [PubMed] [Google Scholar]
- 31.Fuckar D, Dekanic A, Stifter S, et al. VEGF expression is associated with negative estrogen receptor status in patients with breast cancer. Int J Surg Pathol. 2006;14:49–55. doi: 10.1177/106689690601400109. [DOI] [PubMed] [Google Scholar]
- 32.Elkin M, Orgel A, Kleinman HK. An angiogenic switch in breast cancer involves estrogen and soluble vascular endothelial growth factor receptor 1. J Natl Cancer Inst. 2004;96:875–878. doi: 10.1093/jnci/djh140. [DOI] [PubMed] [Google Scholar]
- 33.Klauber-DeMore N. Tumor biology of breast cancer in young women. Breast Dis. 2005−2006;23:9–15. doi: 10.3233/bd-2006-23103. [DOI] [PubMed] [Google Scholar]
- 34.Esserman LJ, Kumar AS, Herrera AF, et al. Magnetic resonance imaging captures the biology of ductal carcinoma in situ. J Clin Oncol. 2006;24:4603–4610. doi: 10.1200/JCO.2005.04.5518. [DOI] [PMC free article] [PubMed] [Google Scholar]
- 35.van den Bosch Maurice A. A. J., et al. Magnetic resonance imaging characteristics of fibrocystic change of the breast. Investigative Radiology. 2005;40:436–441. doi: 10.1097/01.rli.0000167123.26334.c8. [DOI] [PubMed] [Google Scholar]
- 36.Jinguji M, Kajiya Y, Kamimura K, et al. Rim enhancement of breast cancers on contrast-enhanced MR imaging: relationship with prognostic factors. Breast Cancer. 2006;13:64–73. doi: 10.2325/jbcs.13.64. [DOI] [PubMed] [Google Scholar]
- 37.Mitsuyama S, Anan K, Toyoshima S, et al. Histopathological predictors of axillary lymph node metastases in patients with breast cancer. Breast Cancer. 1999;6:237–241. doi: 10.1007/BF02967177. [DOI] [PubMed] [Google Scholar]
- 38.Rivadeneira DE, Simmons RM, Christos PJ, Hanna K, Daly JM, Osborne MP. Predictive factors associated with axillary lymph node metastases in T1a and T1b breast carcinomas: analysis in more than 900 patients. J Am Coll Surg. 2000;191:1–6. doi: 10.1016/s1072-7515(00)00310-0. [DOI] [PubMed] [Google Scholar]
- 39.González-Vela MC, Garijo MF, Fernández FA, Buelta L, Val-Bernal JF. Predictors of axillary lymph node metastases in patients with invasive breast carcinoma by a combination of classical and biological prognostic factors. Pathol Res Pract. 1999;195:611–618. doi: 10.1016/S0344-0338(99)80126-5. [DOI] [PubMed] [Google Scholar]
- 40.Velanovich V, Szymanski W. Lymph node metastasis in breast cancer: common prognostic markers lack predictive value. Ann Surg Oncol. 1998;5:613–619. doi: 10.1007/BF02303831. [DOI] [PubMed] [Google Scholar]
- 41.Nahta R, Esteva FJ. Herceptin: mechanisms of action and resistance. Cancer Lett. 2006;232:123–138. doi: 10.1016/j.canlet.2005.01.041. [DOI] [PubMed] [Google Scholar]
- 42.Ramirez de Molina A, Gutierrez R, Ramos MA, et al. Increased choline kinase activity in human breast carcinomas: clinical evidence for a potential novel antitumor strategy. Oncogene. 2002;21:4317–4322. doi: 10.1038/sj.onc.1205556. [DOI] [PubMed] [Google Scholar]


