Abstract
In the present study, we tried to establish an efficient assay for total antioxidant capacity (TAC) in human plasma using a 96-well microplate. TAC was assessed using lag time by antioxidants against the myoglobin-induced oxidation of 2,2'-azino-di(3-ethylbenzthiazoline-6-sulfonic acid (ABTS) with hydrogen peroxide, and expressed as Trolox equivalent. The linearity of the calibration curve with Trolox was maintained with the Trolox concentration range from 2.5 µM to 25 µM (R2 = 0.997). The assay was applied to the measurement of TAC in healthy human plasma. Coefficient of variation in intraday assay was 2.4%. Difference was not observed in interday assay. Plasma TAC of men ((569 ± 41) µM Trolox equivalent; n = 6) was higher than that of women ((430 ± 28) µM Trolox equivalent; n = 4). After the vegetable juice was drunk for 1 week, the increase in plasma TAC was observed in almost all the volunteers. In summary, we developed the efficient assay for plasma TAC using a 96-well microplate.
Keywords: total antioxidant capacity, lag time, human plasma, microplate, ABTS
Introduction
Total antioxidant capacity (TAC) has been used for the assessment of antioxidant status. Several methods have been developed for the measurement of TAC; the oxygen radical absorbance capacity (ORAC) [1], the ferric reducing ability of plasma (FRAP) [2], the total radical trapping antioxidant potential (TRAP) [3], and the Trolox equivalent antioxidant capacity (TEAC) [4]. Most of the assays could not treat many samples simultaneously. Therefore, it will take long time to measure TAC of many samples. The development of an efficient assay for TAC is expected. TAC of many samples can be measured simultaneously if a 96-well plate is used for the assay.
The oxidation system of 2,2'-azino-di(3-ethylbenzthiazoline-6-sulfonic acid (ABTS) by myoglobin with hydrogen peroxide (H2O2) has been used for TAC assay as TEAC [5]. This is a model system of oxidation by hemeprotein. Myoglobin reacts with H2O2 and ferrylmyoglobin is formed (equation 1) [6]. Ferrylmyoglobin oxidizes ABTS to ABTS cation radical (equation 2; ABTS•+) and its formation can be monitored at 600 nm or 734 nm. The oxidation of ABTS is inhibited via the reaction of Trolox or antioxidants with ferrylmyoglobin (equation 3) [7]. Trolox also reacts with ABTS•+ (equation 4) [8].
Myoglobin (Mb-FeIII) + H2O2 → Ferrylmyoglobin (Mb-FeIV = O) + H2O (1)
Mb-FeIV = O + ABTS → Mb-FeIII + ABTS•+ (600 nm) (2)
Mb-FeIV = O + Trolox (Antioxidant) → Mb-FeIII + Trolox radical (Antioxidant radical) + −OH (3)
ABTS•+ + Trolox (Antioxidant) → ABTS + Trolox radical (Antioxidant radical) (4)
Therefore, in the present study, we tried to develop an efficient TAC assay with a 96-well microplate using the myoglobin-induced oxidation of ABTS and investigated whether the intake of antioxidants from vegetable juice to blood was assessed using this assay.
Materials and Methods
Chemicals
H2O2 and ABTS were purchased from Wako Pure Chemical Industries, Ltd. (Osaka, Japan). Myoglobin (from equine skeletal muscle) was obtained from Sigma Chemical Co. (St. Luis, MO). Trolox was from MERK (Darmstadt, Germany). Solvents and other reagents were of the highest grade commercially available. Concentration of H2O2 was calculated with the molar extinction coefficient at 240 nm (39.4 M−1s−1) [9] using the spectrophotometer (model: UV-1200; Shimadzu Corp., Kyoto, Japan).
TAC assay
Ninety microliter of 10 mM phosphate-buffered saline (pH 7.2), 50 µl of myoglobin solution, 20 µl of 3 mM ABTS solution (final concentration: 300 µM), and 20 µl of diluted plasma or Trolox solution were added to 8 wells of 96-well microplate, mixed by vibration, and maintained at 25°C for 3 min. Reaction was started by the addition of H2O2 (20 µl) and followed at 600 nm with the microplate reader (model: VERSAmax; Molecular Devices Corp., Sunnyvale, CA) for 5 min (25°C).
To investigate stock duration of plasma for the assay, plasma was stored at −80°C.
Application of the assay to TAC measurement of human plasma after the intake of the vegetable juice
All the volunteers gave the informed consent before the trial was started. Subjects were allowed to continue their normal dietary habits. The ten healthy subjects (6 men and 4 women, age: 23–41 years) had taken the commercially available vegetable juice for 1 week (3 bottles per day; morning, noon, and night). Two hundreds and eighty-five ml of vegetable juice was contained in a bottle. The concentrations of α-tocopherol, ascorbic acid, β-carotene, and lycopene in the vegetable juice were 9.0–32.6 µM, 896.5 µM, 32.5–116.6 µM, and 82.3 µM, respectively (calculation from the data mentioned on a bottle of vegetable juice). Before and after the trial, blood was drawn from the antecubital vein into a heparinized syringe before lunch. Immediately after drawing blood, plasma was prepared by centrifugation at 3,000 rpm, and then plasma TAC was measured.
Analysis of uric acid in human plasma
Plasma (10 µl) was mixed with 4 volumes of methanol, vortexed vigorously for 1 min, and centrifuged at 12,000 rpm for 3 min at 4°C. Methanol extract of plasma (10 µl) was injected into the HPLC equipped with the UV detector (model: L-7400; Hitachi, Ltd., Tokyo, Japan). Uric acid was separated with acetonitrile/40 mM monobasicphosphate (3/7, v/v) and the CAPCELL PAK NH2 column (2.0 × 150 mm, 5 µm; Shiseido Co., Ltd., Tokyo, Japan) as mobile phase and column, respectively. Flow rate was 100 µl/min. Uric acid was monitored at 265 nm.
Statistical analysis
Data on the interday reproducibility of the assay and the intake of vegetable juice were analyzed using the paired t-test.
Results
Measurement condition and linearity of the assay
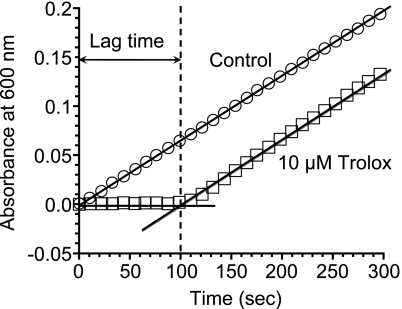
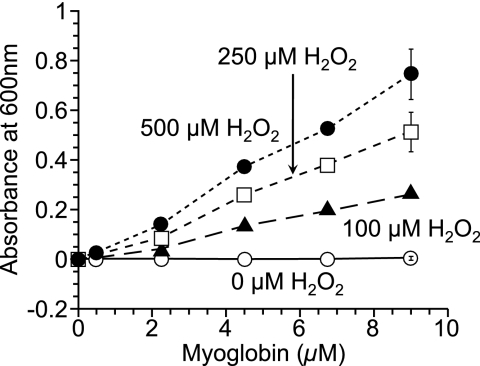
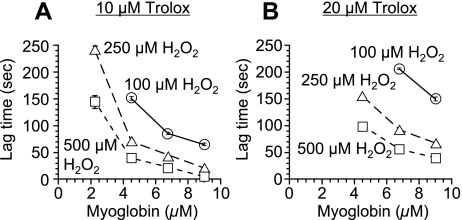
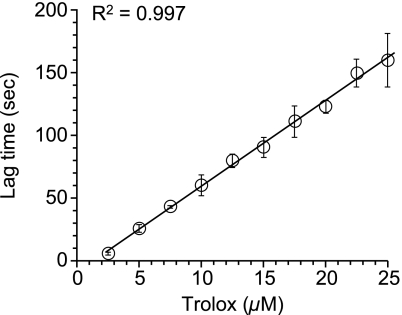
The oxidation of ABTS by myoglobin with H2O2 proceeded linearly as a function of time (Fig. 1). When inhibitor (such as Trolox) existed in a reaction mixture, suppression period of ABTS oxidation (lag time) was observed (Fig. 1). Plasma TAC was assessed using the lag time and expressed as Trolox equivalent. To determine the condition for the oxidation of ABTS by myoglobin with H2O2, various concentrations of myoglobin and H2O2 were tested. At each concentration of H2O2, the oxidation of ABTS was in proportion to the concentration of myoglobin (Fig. 2). The oxidation of ABTS was also in proportion to the concentration of H2O2. When there is no myoglobin or H2O2 in the reaction mixture, oxidation of ABTS was not observed. In various oxidation systems of ABTS using myoglobin and H2O2, lag times by 10 µM or 20 µM Trolox was examined (Fig. 3). Since optimum lag time for the assay was obtained, 250 µM H2O2 and 4.5 µM myoglobin were used in the subsequent experiments. Under this condition, the linearity of the calibration curve with Trolox was maintained with the Trolox concentration range from 2.5 µM to 25 µM (Fig. 4). The correlate coefficient (R2) was 0.997. Lag time by plasma was linear with dilution range from 1:25 to 1:50. Plasma diluted 1:50 was used in the subsequent experiment.
Fig. 1.
Oxidation of ABTS (300 µM) by myoglobin (4.5 µM) with H2O2 (250 µM) and its inhibition by Trolox (10 µM) at 25°C.
Fig. 2.
Oxidation of ABTS (300 µM) by various concentrations of myoglobin with various concentrations of H2O2. Increase in the absorbance at 600 nm for 5 min (25°C) was plotted. Results are expressed as mean ± standard deviation (n = 3).
Fig. 3.
Relationship between the concentrations of myoglobin and the lag time by Trolox (A: 10 µM; B: 20 µM) in the myoglobin-induced oxidation of ABTS (300 µM) at various concentrations of H2O2 (25°C). Results are expressed as mean ± standard deviation (n = 3).
Fig. 4.
Calibration curve with Trolox for the TAC assay. ABTS (300 µM) was oxidized by myoglobin (4.5 µM) with H2O2 (250 µM) at 25°C. Results are expressed as mean ± standard deviation (n = 3).
Precision and accuracy of the assay
Precision and accuracy of the assay were assessed with human plasma. The intraday assay coefficient of variation (CV) was 1.6 – 4.1% (Table 1). To assess the interday reproducibility, TACs obtained from the same plasma in different days were compared (Table 2). No difference was observed in all the cases tested. Plasma could be stored for the assay at −80°C for 4 weeks.
Table 1.
Intraday precision values for the TAC assay
| Sample (human plasma) | TAC (µM Trolox equivalent; n = 3) |
CV (%) | |
|---|---|---|---|
| Mean | SD | ||
| A | 522 | 12 | 2.2 |
| B | 406 | 9 | 2.3 |
| C | 567 | 9 | 1.6 |
| D | 398 | 16 | 4.1 |
| E | 596 | 12 | 2.0 |
Table 2.
Intrerday reproducibility of the TAC assay
| Sample (human plasma) | TAC (µM Trolox equivalent) |
ap value | |
|---|---|---|---|
| Day 1 | Day 2 | ||
| a | 520 ± 23 | 525 ± 14 | 0.824 |
| b | 410 ± 14 | 410 ± 10 | 0.973 |
| c | 500 ± 27 | 500 ± 46 | 1.000 |
| d | 400 ± 27 | 400 ± 20 | 0.991 |
| e | 590 ± 10 | 575 ± 13 | 0.102 |
Results are expressed as mean ± standard deviation (n = 3).
apaired t test (Day 1 vs Day 2)
Application of the assay
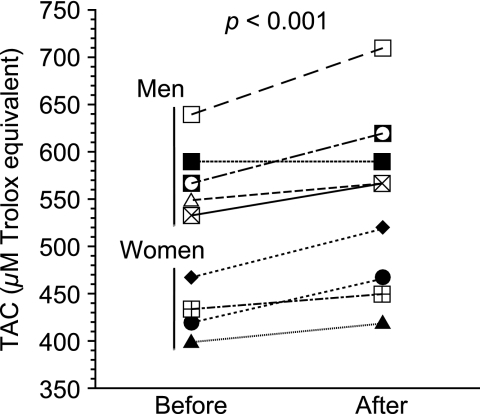
TAC in plasma from the 10 healthy volunteers was measured before and after the intake of the vegetable juice for 1 week (Fig. 5). The average of plasma TAC before the trial was (513 ± 80) µM Trolox equivalent. The difference was observed between men and women; (569 ± 41) µM Trolox equivalent (n = 6) and (430 ± 28) µM Trolox equivalent (n = 4), respectively. TAC increased in plasma of almost all the volunteers after the trial. The average of plasma TAC was (548 ± 81) µM Trolox equivalent. No difference in the increased values of plasma TAC between men and women was observed (men: (35 ± 25) µM Trolox equivalent; women: (34 ± 18) µM Trolox equivalent). Uric acid can increase by the metabolic effect of fructose [10]. However, the level of uric acid in plasma did not change before and after the trial ((366 ± 91) µM and (360 ± 94) µM, respectively).
Fig. 5.
Change in plasma TAC before and after intake of the vegetable juice for 1 week. Results are expressed as mean ± standard deviation (n = 3).
Discussion
Many assay for TAC (ORAC [1], FRAP [2], TRAP [3], and TEAC [4]) have been developed. In most cases, TAC is assessed by the single point fixed time measurement or the area under the curve quantitation. However, they are unreliable because lag time is observed during oxidation of substance in the presence of antioxidant as shown in Fig. 1 and oxidation reaction dose not proceed linearly. In such a case, it is important to follow time course of the reaction to obtain lag time. The results of the single fixed time measurement were different from those of the measurement using lag time [11]. Therefore, lag time is better index for TAC and we used lag time assay for TAC measurement in the present study.
We used 96-well microplate to examine TAC of many samples simultaneously in the present study. TAC assays using 96-well plates have already been reported [12–14]. Moreover, automated TAC assays [15, 16], as a simple TAC assay, have also been reported. The ABTS•+ decolorization method or the crocin bleaching method was used in these assays and the results were obtained by the single point fixed time measurement. In these methods, reaction is stopped when all antioxidants are consumed. In some cases, reaction may not be stopped when data are recorded. Therefore, to follow time course of a reaction is also important to obtain accurate results in these cases. Our assay followed time course of inhibitory reaction by antioxidants against the myoglobin-induced oxidation of ABTS.
Since myoglobin, ABTS, and Trolox (or plasma) were added to each well before reaction was started and incubated for 3 min, the addition of them to each well did not affect the lag time for reaction. Time for adding H2O2 and/or recording data affected the lag time of the reaction when more than 8 wells of 96-well microplate were used simultaneously. Therefore, we used 8 wells for the simultaneous measurement of TAC.
Oxidative stress is defined as “the disbalance in pro-oxidant-antioxidant equilibrium in favor of the pro-oxidant” [17]. Prevention of oxidative damage is important for health care, because oxidative stress is involved in various diseases [18]. Biological systems construct defense system using antioxidants against oxidative stress [19]. Thus, antioxidants would be used for the prevention of oxidative stress-related diseases and antioxidant status in plasma would give useful information for health care. Plasma TAC can be changed by disease. Serum TACs (measured by the corcin bleaching method) of inflammatory bowel disease patients or Crohn’s disease patients are lower than those of normal controls [20]. The level of serum TAC of patients was related with disease activity and location [20]. Serum TACs (measured by TRAP) of sepsis patients are higher than those of healthy controls and correlated with clinical score [21]. Plasma TAC (measured by the corcin bleaching method) of asymptomatic carrier of Neisseria meningtidis was lower than those of healthy control children [22]. Serum TAC (ABTS·+ decolorization method) of hypertension patients was lower than controls [23]. Therefore, monitoring plasma TAC periodically would be useful for the health care. Our assay can be applied for this purpose. The change in TAC in breast milk after delivery was also reported [24].
Vegetables or fruits have various antioxidants such as ascorbic acid, β-carotene, polyphenol, and catechin. We have previously demonstrated that Kinobeon A, purified from safflower culture cells, showed antioxidant activity [25, 26]. Thus, the intake of vegetables and fruits (as antioxidants) is important to prevent oxidative stress-related diseases. The increase in plasma or serum TAC by the intake of foods (such as red grape juice [27], strawberries [28], spinach [28], red wine [28], beer [29], tomato products with olive oil [30], blueberry [31], chocolate [32], and Mey flower decoction [33]) and supplements (such as Vitamin C [28], and vitamin and mineral complex [34, 35]). The increase in plasma TAC by the intake of vegetable juice could be assessed using our TAC assay in the present study. Therefore, our assay would be used for the assessment of the intake of antioxidants from foods or supplements to blood.
Components giving the increase in plasma TAC after the intake of vegetable juice were discussed. The concentration of uric acid, which is main component of plasma TAC, did not change, but that of ascorbic acid increased in plasma after the intake of vegetable juice. Contribution of ascorbic acid to the increase in plasma TAC was roughly calculated by the depletion of ascorbic acid in plasma using ascorbate oxidase. The increase in ascorbic acid corresponded to about 30% of that in plasma TAC. TAC of plasma, in which uric acid and ascorbic acid were depleted using uricase and ascorbate oxidase, also increased after the intake of vegetable juice. More than twenty kinds of vegetables were contained in the vegetable juice. Therefore, many antioxidants (including α-tocopherol, β-carotene, and lycopene) would exist in the vegetable juice and contribute to the increase in plasma TAC.
In summary, we developed the efficient assay for TAC using a 96-well microplate. Using this assay, we could assess the increase in plasma TAC by the intake of the vegetable juice for 1 week. Our assay would be useful for the health care and screening for oxidative stress-related diseases by monitoring plasma TAC.
Acknowledgement
This work was supported in part by a Grant-in-Aid for Scientific Research from the Ministry of Education, Culture, Sports, Science and Technology of the Japanese Government.
Abbreviations
- ABTS
2,2'-azino-di(3-ethylbenzthiazoline-6-sulfonic acid
- ABTS•+
ABTS cation radical
- FRAP
ferric reducing ability of plasma
- ORAC
oxygen radical trapping antioxidant potential
- TAC
total antioxidant capacity
- TEAC
Trolox equivalent antioxidant capacity
- TRAP
total radical trapping antioxidant potential
References
- 1.Cao G., Alessio H.M., Cutler R.G. Oxygen-radical absorbance capacity assay for antioxidants. Free Radic. Biol. Med. 1993;14:303–311. doi: 10.1016/0891-5849(93)90027-r. [DOI] [PubMed] [Google Scholar]
- 2.Benzie I.F.F., Strain J.J. The ferric reducing ability of plasma (FRAP) as a measure of “antioxidant power”: The FRAP assay. Anal. Biochem. 1996;239:70–76. doi: 10.1006/abio.1996.0292. [DOI] [PubMed] [Google Scholar]
- 3.Wayner D.D.M., Burton G.W., Ingold K.U., Locke S. Quantitative measurement of the total, peroxyl radical-trapping antioxidant capability of human blood plasma by controlled peroxidation. The important contribution made by plasma proteins. FEBS Lett. 1985;187:33–37. doi: 10.1016/0014-5793(85)81208-4. [DOI] [PubMed] [Google Scholar]
- 4.Miller N.J., Rice-Evans C., Davies M.J., Gopinathan V., Milner A. A novel method for measuring antioxidant capacity and its application to monitoring the antioxidant status in premature neonates. Clin. Sci. 1993;84:407–412. doi: 10.1042/cs0840407. [DOI] [PubMed] [Google Scholar]
- 5.Yu T.W., Ong C.N. Lag-time measurement of antioxidant capacity using myoglobin and 2,2'-azino-bis(3-ethylbenzthiazoline-6-sulfonic acid): Rationale, application, and limitation. Anal. Biochem. 1999;275:217–223. doi: 10.1006/abio.1999.4314. [DOI] [PubMed] [Google Scholar]
- 6.Irwin J.A., Østdal H., Davies M.J. Myoglobin-induced oxidative damage: evidence for radical transfer from oxidized myoglobin to other proteins and antioxidants. Arch. Biochem. Biophys. 1999;362:94–104. doi: 10.1006/abbi.1998.0987. [DOI] [PubMed] [Google Scholar]
- 7.Giulivi C., Romero F.J., Cadenas E. The interaction of Trolox C, a water-soluble vitamin E analog, with ferrylmyoglobin: reduction of the oxoferryl moiety. Arch. Biochem. Biophys. 1992;299:302–312. doi: 10.1016/0003-9861(92)90279-6. [DOI] [PubMed] [Google Scholar]
- 8.Re R., Pellegrini N., Proteggente A., Pannala A., Yang M., Rice-Evans C. Antioxidant activity applying an improved ABTS radical cation decolorization assay. Free Radic. Biol. Med. 1999;26:1231–1237. doi: 10.1016/s0891-5849(98)00315-3. [DOI] [PubMed] [Google Scholar]
- 9.Nelson D.P., Kiesow L.A. Enthalpy of decomposition of hydrogen peroxide by catalase at 25°C (with molar extinction coefficients of H2O2 solutions in the UV) Anal. Biochem. 1972;49:474–478. doi: 10.1016/0003-2697(72)90451-4. [DOI] [PubMed] [Google Scholar]
- 10.Lotito S.B., Frei B. The increase in human plasma antioxidant capacity after apple consumption is due to the metabolic effect of fructose on urate, not apple-derived antioxidant flavonoids. Free Radic. Biol. Med. 2004;37:251–258. doi: 10.1016/j.freeradbiomed.2004.04.019. [DOI] [PubMed] [Google Scholar]
- 11.Charalabopoulos K., Assimakopoulos D., Karkabounas S., Danielidis V., Kiortsis D., Evangelou A. Effects of cigarette smoking on the antioxidant defence in young healthy male volunteers. Int. J. Clin. Pract. 2005;59:25–30. doi: 10.1111/j.1742-1241.2004.00340.x. [DOI] [PubMed] [Google Scholar]
- 12.Lussignoli S., Fraccaroli M., Andrioli G., Brocco G., Bellavite P. A microplate-based colorimetric assay of the total peroxyl radical trapping capacity of human plasma. Anal. Biochem. 1999;269:38–44. doi: 10.1006/abio.1999.4010. [DOI] [PubMed] [Google Scholar]
- 13.Ching S.Y.L., Hall J., Croft K., Beilby J., Rossi E., Ghisalberti E. Antioxidant inhibition of oxygen radicals for measurement of total antioxidant capacity in biological samples. Anal. Biochem. 2006;353:257–265. doi: 10.1016/j.ab.2006.02.027. [DOI] [PubMed] [Google Scholar]
- 14.Hay K.X., Waisundara V.Y., Timmins M., Ou B., Pappalardo K., McHale N., Huang D. High-throughput quantitation of peroxyl radical scavenging capacity in bulk oils. J. Agric. Food Chem. 2006;54:5299–5305. doi: 10.1021/jf061410v. [DOI] [PubMed] [Google Scholar]
- 15.Kampa M., Nistikaki A., Tsaousis V., Maliaraki N., Notas G., Castanas E. A new automated method for the determination of the total antioxidant capacity (TAC) of human plasma, based on the crocin bleaching assay. BMC Clinic. Pathol. 2002;2:3. doi: 10.1186/1472-6890-2-3. [DOI] [PMC free article] [PubMed] [Google Scholar]
- 16.Erel O. A novel automated direct measurement method for total antioxidant capacity using a new generation, more stable ABTS radical cation. Clin. Biochem. 2004;37:277–285. doi: 10.1016/j.clinbiochem.2003.11.015. [DOI] [PubMed] [Google Scholar]
- 17.Sies H. In: Oxidative stress: introductory remarks, in Oxidative Stress. Sies H., editor. Academic Press; London: 1985. p. 18. [Google Scholar]
- 18.Halliwell B., Gutteridge J.M.C. Free radicals in biology and medicine, Third Edition. Oxford University Press; Oxford: 1999. [Google Scholar]
- 19.Kambayashi Y., Yamashita S., Niki E., Yamamoto Y. Oxidation of rat liver phospholipids: Comparison of pathways in homogenous solution, in liposomal suspension and in whole tissue homogenates. J. Biochem. 1997;121:425–431. doi: 10.1093/oxfordjournals.jbchem.a021606. [DOI] [PubMed] [Google Scholar]
- 20.Koutroubakis I.E., Malliaraki N., Dimoulios P.D., Karmiris K., Castanas E., Kouroumalis E.A. Decreased total and corrected antioxidant capacity in patients with inflammatory bowel disease. Dig. Dis. Sci. 2004;49:1433–1437. doi: 10.1023/b:ddas.0000042242.22898.d9. [DOI] [PubMed] [Google Scholar]
- 21.Chuang C.-C., Shiesh S.-C., Chi C.-H., Tu Y.-F., Hor L.-I., Shieh C.-C., Chen M.-F. Serum total antioxidant capacity reflects severity of illness in patients with severe sepsis. Crit. Care. 2006;10:R36. doi: 10.1186/cc4826. [DOI] [PMC free article] [PubMed] [Google Scholar]
- 22.Uberos J., Molina-Carballo A., Galdo-Muñoz G., Muñoz-Hoyos A. Total antioxidant capacity of plasma in asymptomatic carrier state of Neisseria meningitidis. Epidemiol. Infect. 2007;135:857–860. doi: 10.1017/S0950268806007539. [DOI] [PMC free article] [PubMed] [Google Scholar]
- 23.Kasap S., Gönenç A., Senr D., Hisar I. Serum cardiac markers in patients with acute myocardial infarction: oxidative stress, C-reactive protein and N-terminal probrain natriuretic peptide. J. Clin. Biochem. Nutr. 2007;41:50–57. doi: 10.3164/jcbn.2007007. [DOI] [PMC free article] [PubMed] [Google Scholar]
- 24.Ezaki S., Ito T., Suzuki K., Tamura M. Association between total antioxidant capacity in breast milk and postnatal age in days in premature infants. J. Clin. Biochem. Nutr. 2008;42:133–137. doi: 10.3164/jcbn.2008019. [DOI] [PMC free article] [PubMed] [Google Scholar]
- 25.Kanehira T., Takekoshi S., Nagata H., Matsuzaki K., Kambayashi Y., Osamura R.Y., Homma T. A novel and potent biological antioxidant, Kinobeon A, from cell culture of safflower. Life Sci. 2003;74:87–97. doi: 10.1016/j.lfs.2003.06.033. [DOI] [PubMed] [Google Scholar]
- 26.Kambayashi Y., Takekoshi S., Nakano M., Shibamori M., Hitomi Y., Ogino K. Kinobeon A, purified from cultured safflower cells, is a novel and potent singlet oxygen quencher. Acta Biochim. Pol. 2005;52:903–907. [PubMed] [Google Scholar]
- 27.Day A.P., Kemp H.J., Bolton C., Hartog M., Stansbie D. Effect of concentrated red grape juice consumption on serum antioxidant capacity and low-density lipoprotein oxidation. Ann. Nutr. Metab. 1997;41:353–357. doi: 10.1159/000178006. [DOI] [PubMed] [Google Scholar]
- 28.Cao G., Russell R.M., Lischner N., Prior R.L. Serum antioxidant capacity is increased by consumption of strawberries, spinach, red wine or vitamin C in elderly women. J. Nutr. 1998;128:2383–2390. doi: 10.1093/jn/128.12.2383. [DOI] [PubMed] [Google Scholar]
- 29.Ghiselli A., Natella F., Guidi A., Montanari L., Fantozzi P., Scaccini C. Beer increases plasma antioxidant capacity in humans. J. Nutr. Biochem. 2000;11:76–80. doi: 10.1016/s0955-2863(99)00077-7. [DOI] [PubMed] [Google Scholar]
- 30.Lee A., Thurnham D.I., Chopra M. Consumption of tomato products with olive oil but not sunflower oil increases the antioxidant activity of plasma. Free Radic. Biol. Med. 2000;29:1051–1055. doi: 10.1016/s0891-5849(00)00440-8. [DOI] [PubMed] [Google Scholar]
- 31.Kay C.D., Holub B.J. The effect of wild blueberry (Vaccinium angustifolium) consumption on postprandial serum antioxidant status in human subjects. Br. J. Nutr. 2002;88:389–398. doi: 10.1079/BJN2002665. [DOI] [PubMed] [Google Scholar]
- 32.Serafini M., Bugianesi R., Maiani G., Valtuena S., De Santis S., Crozier A. Plasma antioxidants from chocolate. Dark chocolate may offer its consumers health benefits the milk variety cannot match. Nature. 2003;424:1013. doi: 10.1038/4241013a. [DOI] [PubMed] [Google Scholar]
- 33.Ranjbar A., Khorami S., Safarabadi M., Shahmoradi A., Malekirad A.A., Vakilian K., Mandegary A., Abdollahi M. Antioxidant activity of Iranian Echium amoenum Fisch & C.A. Mey flower decoction in humans: A cross-sectional before/after clinical trial. Evid. Based Complement Alternat. Med. 2006;3:469–473. doi: 10.1093/ecam/nel031. [DOI] [PMC free article] [PubMed] [Google Scholar]
- 34.Voronin M.V., Sidneva E.S., Lisitsyna T.A., Zhanataev A.K., Durnev A.D. Total antioxidant capacity of blood plasma from healthy donors receiving vitamin and mineral complex. Bull. Exp. Biol. Med. 2004;137:457–459. doi: 10.1023/b:bebm.0000038152.44483.66. [DOI] [PubMed] [Google Scholar]
- 35.Wouters-Wesseling W., Wagenaar L.W., de Groot L.C.P.G.M., Bindels J.G., van Staveren W.A. Biochemical antioxidant levels respond to supplementation with an enriched drink in frail elderly people. J. Am. Coll. Nutr. 2003;22:232–238. doi: 10.1080/07315724.2003.10719298. [DOI] [PubMed] [Google Scholar]


