Abstract
Dichloroacetate (DCA) is an investigational drug for certain metabolic diseases. It is biotransformed principally by the ζ-1 family isoform of glutathione transferase (GSTz1), also known as maleylacetoacetate isomerase (MAAI), which catalyzes the penultimate step in tyrosine catabolism. DCA causes a reversible peripheral neuropathy in several species, including humans. However, recent clinical trials indicate that adults are considerably more susceptible to this adverse effect than children. We evaluated the kinetics and biotransformation of DCA and its effects on tyrosine metabolism in nine patients treated for 6 months with 25 mg/kg/day and in rats treated for 5 days with 50 mg/kg/day. We also measured the activity and expression of hepatic GSTz1/MAAI. Chronic administration of DCA causes a striking age-dependent decrease in its plasma clearance and an increase in its plasma half-life in patients and rats. Urinary excretion of unchanged DCA in rats increases with age, whereas oxalate, an end product of DCA metabolism, shows the opposite trend. Low concentrations of monochloroacetate (MCA), which is known to be neurotoxic, increase as a function of age in the urine of dosed rats. MCA was detectable in plasma only of older animals. Hepatic GSTz1/MAAI-specific activity was inhibited equally by DCA treatment among all age groups, whereas plasma and urinary levels of maleylacetone, a natural substrate for this enzyme, increased with age. We conclude that age is an important variable in the in vivo metabolism and elimination of DCA and that it may account, in part, for the neurotoxicity of this compound in humans and other species.
Human exposure to dichloroacetate (DCA) extends over approximately a 103-fold concentration range. Environmental exposure to contaminated fog, rain, and chlorinated drinking water, which contain microgram per liter concentrations (Römpp et al., 2001; Ammini and Stacpoole, 2003), results in DCA doses of a few micrograms per kilogram per day, whereas milligram per kilogram per day doses are administered clinically for the investigational treatment of certain metabolic diseases, such as congenital mitochondrial disorders (for review, see Stacpoole et al., 1998; Ammini and Stacpoole, 2003).
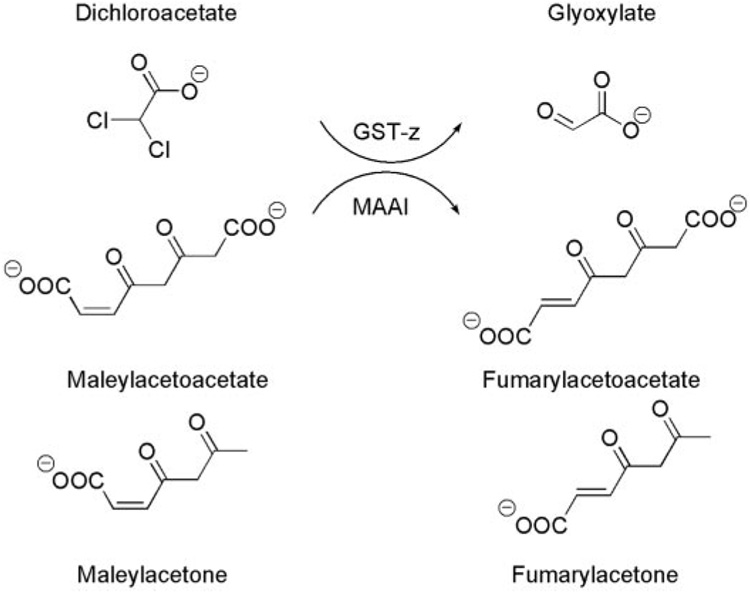
The first step in DCA biotransformation is complete dechlorination to glyoxylate in a reaction catalyzed by glutathione transferase ζ-1 (GSTz1) (Cornett et al., 1999; Anders et al., 2001). No other primary pathway of DCA biotransformation has been reported. The glyoxylate subsequently is converted to oxalate, glycine, and CO2 (James et al., 1998). It is well established that DCA inhibits its own metabolism in rodents and humans across the environmental to clinical concentration range (Stacpoole et al., 1998; Guo et al., 2006; Jia et al., 2006), apparently by a post-translationally mediated inhibition of hepatic GSTz1. This enzyme is identical in mammals to maleylacetoacetate isomerase (MAAI), which catalyzes the penultimate step in tyrosine catabolism (Mitchell et al., 2001). Inhibition of GSTz1/MAAI after exposure to DCA results in accumulation of maleylacetoacetate and its decarboxylated product maleylacetone (MA) (Cornett et al., 1999) (Fig. 1). Both maleylacetoacetate and maleylacetone are chemically reactive molecules and can form protein adducts (Lantum et al., 2002).
Fig. 1.
Reactions catalyzed by the glutathione-dependent bifunctional enzyme GSTz/MAAI. GSTz dehalogenates DCA to glyoxylate, and it is the major route of DCA biotransformation. MAAI is the penultimate enzyme in the catabolism of phenylalanine and tyrosine that isomerizes maleylacetoacetate to fumarylacetoacetate and maleylacetone to fumarylacetone.
Possibly because of its effect on tyrosine catabolism, chronic administration of DCA to adult rodents, adult dogs, and some humans causes reversible peripheral neuropathy and hepatotoxicity (Stacpoole et al., 1998). In a recent test, two randomized, double-blind, placebo-controlled trials have shed light on the pharmacotoxicology of chronic DCA treatment when administered by mouth at doses of 12.5 mg/kg twice daily. In one study, 43 children with genetically heterogeneous causes of congenital lactic acidosis, whose mean ± S.D. age at entry was 5.6 ± 5 years, were randomized to receive DCA or placebo for 6 months (Stacpoole et al., 2006). Serial quantitative evaluation of peripheral nerve amplitude and velocity in upper and lower extremities disclosed no evidence of drug-related neurotoxicity. In contrast, a second controlled trial was conducted in 30 adolescents and adults (mean age at entry 30 ± 14 years), all of whom had the same A3742G point mutation in mitochondrial DNA that gives rise to the syndrome of mitochondrial encephalomyopathy, lactic acidosis, and stroke-like episodes (MELAS) (Kaufmann et al., 2006). This study was terminated prematurely because of a high incidence of symptomatic peripheral neuropathy associated with DCA administration for several weeks or months.
The ontogeny of GSTz1/MAAI is unknown. In rats, expression of α, µ, and π GST isoforms reached adult levels by postnatal day 10 (Tee et al., 1992). Studies of GST activities with several substrates, including 1-chloro-2,4-dinitrobenzene and 1,2-dichloro-4-nitrobenzene, in rats aged 6 to 30 months showed no changes in activity with 1-chloro-2,4-dinitrobenzene over this age range, but they showed a decline in activity with 1,2-dichloro-4-nitrobenzene at up to 30 months (Chen et al., 1994). In mice aged 8 to 10 weeks and 60 weeks, elimination of a single dose of DCA was reduced in 14-month-old control mice compared with 2-month old mice (Schultz et al., 2002). However, although chronic DCA treatment markedly reduced DCA elimination in young mice, it had no effect on DCA toxicokinetics in 14-month-old animals. DCA treatment caused a 90% loss in the ability of liver S10 fractions to metabolize DCA in the 2-month-old mice, but only a 65% loss in the 14-month-old mice. There was no difference in GSTz/MAAI expression in liver S10 fractions of control 2- and 14-month-old mice. However, DCA treatment did not reduce GSTz/MAAI expression as much in old as in young animals (Schultz et al., 2002). The authors concluded that hepatic GSTz/MAAI expression and activity were not the only factors controlling the elimination of DCA from mice.
We hypothesized that the apparent age-dependent variability in interspecies tolerance to chronic DCA administration may be associated with differences in its metabolism or elimination. Therefore, we investigated the effect of age on the plasma kinetics of DCA after chronic oral administration to humans and short-term oral administration to rats at doses of 25 or 50 mg/kg/day, respectively. We found age to be a strong determinant of the kinetics and biotransformation of DCA and of its effects on tyrosine metabolism.
Materials and Methods
Chemicals
We purchased sodium 1,2-[13C]DCA (99% pure) from Cambridge Isotopes Laboratories (Andover, MA). We verified the purity of the compound by gas chromatographic-mass spectrometric (GC-MS) analysis (Shroads et al., 2004), and we found that it contained <0.1% of [12C]DCA and <0.001% of [13C]monochloroacetate (MCA). We purchased unlabeled clinical grade sodium DCA from TCI America (Portland, OR), and we analyzed the product by the same method for the presence of MCA and trichloroacetic acid. We found <0.001% of these compounds were present. We obtained 1-[14C]DCA (specific activity 52.3 mCi/mmol) from American Radio-labeled Chemicals (St. Louis, MO), and we converted it to its sodium salt with NaHCO3. We synthesized maleylacetone as described previously (Cornett et al., 1999), and we verified its structure by mass spectrometry and NMR analysis. We obtained 12% boron trifluoride in methanol and sodium 2-oxopentanoic acid (99% pure) from Sigma-Aldrich (St. Louis, MO) and sodium 2-oxohexanoic acid (97% pure) and penta-fluorobenzyl bromide (99% pure) from Sigma-Aldrich. We purchased fresh-frozen human plasma and fresh whole blood from LifeSouth (Gainesville, FL). Since DCA is typically found in municipal water, we used spring water (Zephyrhills, FL) for the animal’s drinking water that we analyzed using EPA Method 552.1, and we found both DCA and MCA to be below the method’s detection limits. All other chemicals used were reagent grade or higher, and they were obtained from commercial suppliers.
Clinical Studies
The major results of the studies of DCA conducted in children (Stacpoole et al., 2006) and adults (Kaufmann et al., 2006) with genetic mitochondrial diseases have been published. Both were prospective, randomized, placebo-controlled, and double-blind clinical trials in which DCA was administered by mouth at a twice-daily dose of 12.5 mg/kg to subjects who were previously naive to the drug. Both studies were approved by the respective institutional review boards, and they were conducted in General Clinical Research Centers at the University of Florida (children) and Columbia University (adolescents and adults). Patients studied at Florida had congenital lactic acidosis due to a biochemically proven deficiency in pyruvate dehydrogenase or in one or more complexes of the respiratory chain, or they had a pathological mutation in mitochondrial DNA. The patients enrolled in the Columbia trial had MELAS due to the common A3742G point mutation. Although all subjects had clinical manifestations consistent with their disease, none had clinically or biochemically significant hepatic or renal insufficiency or any other complication known to alter the bioavailability, kinetics, or metabolism of DCA (see Stacpoole et al., 1998).
Many children were too young or debilitated to undergo formal pharmacokinetic investigations. In addition, the clinical trial involving the patients with MELAS was stopped prematurely because of drug-associated neuropathy; so, only a few subjects received DCA for 6 months, which was the intended duration of initial exposure. Therefore, we conducted the kinetics studies reported here in five children enrolled in the Florida trial who ranged in age from 2.2 to 7.1 years (mean 5.2 ± 1.8 years) and in four patients enrolled in the Columbia trial who ranged in age from 14.0 to 33.9 years (mean 23.6 ± 10.0 years) at the time of the first DCA dose. We gave each pediatric patient 12.5 mg/kg 1,2-[13C]DCA by mouth after an over-night fast, and we withdrew 1 to 2 ml of venous blood from an upper extremity vein at time 0, 15, and 30 min and 1, 2, 4, 6, 8, and 12 h after dosing. We centrifuged samples at 5°C, and then we aliquoted the plasma into 2-ml cryo-vials and stored the vials at −80°C until analysis. Immediately after we withdrew the 12-h blood sample, we administered a dose of 12.5 mg/kg [12C]DCA to complete the 25 mg/kg/day dose schedule. We also collected urine over the 24 h immediately following the first drug dose. After 6 months of twice-daily administration of [12C]DCA, we dosed each child with 12.5 mg/kg [13C]DCA, and we obtained blood samples at the time intervals mentioned above.
The clinical trial conducted in older subjects at Columbia University did not include the administration of [13C]DCA, nor was urine collected for pharmacological studies. Therefore, the kinetics of DCA in these subjects was evaluated using the 12C isotope, and we used the identical dosing and sampling scheme used in the children for the initial 12.5-mg/kg DCA dose. The dose was administered after 6 months of twice-daily treatment.
Animal Studies
We purchased male Sprague-Dawley rats representing three age groups from Harlan (Indianapolis, IN). At the time of initial DCA dosing, “young” rats (n = 4) were 5 to 6 weeks old and they weighed 120 to 150 g, “adult” rats (n = 5) were 7 months old and they weighed 425 to 500 g, and “old” rats (n = 5) were 15 months old and they weighed 495 to 530 g. Animals were housed individually at the Animal Research Facility at the University of Florida under constant temperature (22°C) and humidity on a 12-h light/dark cycle to minimize stress, and they were allowed free access to drinking water and rat chow. The Institutional Animal Care and Use Committee of the University of Florida approved the experimental protocol of this investigation, and animal care and treatment were conducted in accordance with established guidelines.
Before experimentation, we fitted the rats with a jugular catheter as described previously (James et al., 1998), and we allowed them to recover from surgery for 1 day before experimentation. We administered sodium 1,2-[12C]DCA (50 mg/kg/day) by gavage in a volume of 1 ml of distilled water for 4 days followed by 100% 1,2-[13C]DCA (50 mg/kg/day) on the fifth day. Control animals received vehicle alone. We gave [13C]DCA to the rats on the final day because two metabolites of DCA, glyoxylate and oxalate, occur naturally in plasma and urine. Analysis by mass spectrometry can readily distinguish the different isotopes of DCA and its metabolites, and it can also discriminate between the endogenous levels of glyoxylate and oxalate from their concentrations due to DCA administration (Shroads et al., 2004). We collected blood on day 5 at 0, 10, 20, and 40 min and 1, 2, 4, 6, 8, 10, and 12 h after 1,2-[13C]DCA administration, and we immediately centrifuged the whole blood at 500g to isolate the plasma. We mixed the remaining red blood cells with heparinized saline (10 units/ml) to a volume equal to the removed plasma, and we reintroduced the red cell/heparinized saline solution into the rats through the cannula before each sampling time to minimize fluctuations in intravascular fluid volume and hematocrit. We froze the plasma at −80°C before analysis by GC-MS. We collected urine from the animals for 24 h after [13C]DCA administration, and we froze it at −80°C. At the conclusion of blood sampling, we anesthetized the animals with carbon dioxide, and we sacrificed them by decapitation.
Analysis of DCA and DCA Metabolites
We measured 1,2-[12C]DCA and 1,2-[13C]DCA by GC-MS after derivatization in plasma and urine to their methyl esters with 12% boron trifluoride in methanol and subsequent extraction with methylene chloride (Shroads et al., 2004). We prepared calibration standards daily by adding varying amounts of [12C]DCA and [13C]DCA to fresh-frozen human plasma and derivitizing and analyzing as described above. We used fresh-frozen human plasma as the matrix for the calibration curves for both human and rat studies because it was more readily available, and we required several milliliters of plasma for the daily standards. Comparison of the slopes of the calibration curves (response versus concentration) of DCA, MCA, and maleylacetone showed no statistically significant difference between standards prepared in human plasma and rat plasma (data not shown). We obtained linear calibration curves (correlation coefficient >0.995) for [12C]DCA and [13C]DCA over a 0.05 to 100-µg/ml range. When sample concentrations exceeded this range, we diluted the sample extracts in methylene chloride to ensure that their measured concentration was within the concentration range of the calibration curves. In addition to the calibration samples, we prepared analytical blanks, fortified samples, and replicates each day in accordance with good laboratory practice. We used Zephyrhills Spring water for blank samples, and the water was found to be free of all analytes. We added the internal standard (50 µg/ml 2-oxohexanoic acid) to all samples and standards before derivatization and extraction, and we analyzed them using an Agilent 5972 GC-MS (Agilent Technologies, Palo Alto, CA) under analytical conditions reported previously (Shroads et al., 2004). We determined the levels of both carbon-12 and carbon-13 isotopes of DCA, MCA, glyoxylate, and oxalate using this method. We used the concentrations of 1,2-[13C]DCA in the plasma for pharmacokinetic modeling.
Analysis of Tyrosine Metabolites
We measured the tyrosine catabolites maleylacetone and succinylacetone using a PolarisQ ion-trap mass spectrometer (Thermo Electron Corporation, Waltham, MA) operated in the electron capture negative chemical ionization mode, after extraction and derivatization under similar analytical conditions as reported previously (Zolodz et al., 2006). We combined 100 µl of plasma or urine in a glass centrifuge tube with 500 µl of (6% trifluoroacetic acid and 1% KCl) aqueous solution, 5 µl of internal standard (100 µg/ml 2-oxopentanoic acid), 1 ml of methylene chloride, and 300 mg of Na2SO4. The sample was vortex-mixed for 2 min, sonicated for 5 min and centrifuged at 1200g at 15°C for 30 min. We transferred 750 µl of the lower organic layer to an amber conical vial, and we concentrated it under a gentle stream of nitrogen to less than 20 µl. We added 500 µl of methylene chloride to the original aqueous plasma solution, and we vortex mixed and centrifuged, as described above. We added the methylene chloride layer to the conical vial containing the earlier extraction, and we evaporated the sample under the nitrogen to less than 10 µl. We derivatized each sample by adding 100 µl of methyl tert-butyl ether, 50 µl of triethylamine, and 150 µl of the penta-fluorobenzyl bromide solution, and then we sonicated the samples for 30 min in a 50°C water bath. We transferred the samples to an amber vial for analysis. The gas chromatograph was equipped with a Zebron (Phenonmenex, Torrance, CA) ZB5 column of 30-m length, with an inside diameter of 0.25 mm and film thickness of 0.25 µm. Retention times of the compounds were 16.5 min for 2-oxopentanoic acid (internal standard) and 18.1 min for maleylacetone. The mass spectrometer was operated using the analytical conditions described previously (Zolodz et al., 2006). We analyzed sample blanks, replicates, and fortified samples daily for quality control purposes.
Pharmacokinetic Analysis
We fitted the plasma-concentration time curve for all DCA measurements into a noncompartmental pharmacokinetic model for each patient and animal using WinNon-Lin, version 5.01 software (Pharsight, Mountain View, CA), obtained through the academic license program. We determined the maximum plasma concentration of DCA (Cmax) and the time to achieve Cmax (Tmax). Through the WinNonLin software, we calculated the area under the plasma concentration-time curve from time 0 to the last measurable concentration of DCA (AUC0–t) using the linear-trapezoidal method and the area under the plasma concentration-time curve from time 0 extrapolated to infinity (AUC0–∞). We used at least three sampling points to estimate the first order elimination rate constant (λz) for each curve. The software calculated the terminal phase elimination half-life (t1/2) as ln (2)/λz and the total body clearance (CL) of DCA as the dose/AUC (0–∞). We estimated the apparent volume of distribution (Vz/F) as CL – F/λz, where F is the bioavailability. We previously reported the bioavailability of DCA for humans is 1 (Curry et al., 1991).
GSTz1/MAAI Activity
We removed the rat livers immediately after sacrifice, and we prepared and analyzed cytosolic fractions for protein concentration. We measured hepatic GSTz1/MAAI specific activity as described previously (James et al., 1997) using liver cytosol fractions incubated with 0.2 mM 1-[14C]DCA and 1 mM glutathione. The percentage of conversion of [14C]DCA to [14C]glyoxylate was determined by high-performance liquid chromatography, and specific activity was expressed as nanomoles of [14C]glyoxylate formed per minute per milligram of protein.
GSTz1/MAAI Expression
We used a known amount of human GSTz1-1 as the standard for Western immunoblotting. Procedures for generating this recombinant protein were published recently (Guo et al., 2006). We resolved recombinant human GSTz1-1 (0.05 µg) and hepatic cytosol fractions from control (10 µg of protein) and DCA-treated rats (40 µg of protein) by SDS-polyacrylamide gel electrophoresis on a 12% polyacrylamide gel (Bio-Rad, Hercules, CA). We transferred proteins to nitrocellulose membranes, and we immunoblotted them as described previously (Guo et al., 2006).
Analysis of MCA in DCA-Fortified Whole Blood
We prepared solutions of 1, 2, and 5 mM [12C]DCA in fresh whole blood and in spring water. We selected these concentrations based on those we measured in blood after the 25 mg/kg/day dosing. We placed four separate 1-ml aliquots of each concentration into glass culture tubes, and we shook the samples at 160 rpm at a temperature of 37°C for 1 h in a Thermo Forma model 420 orbital shaker (Thermo Electron Corporation). We also prepared unfortified whole blood and spring water for quality control purposes, and we analyzed these samples using the same conditions. We measured the DCA and MCA concentrations in the blood by mass spectrometry (Shroads et al., 2004).
Statistical Analyses
We determined the mean, S.D., and statistical significance of the data using Excel software (Microsoft, Redmond, WA). We used a two-sided Student’s t test to analyze kinetic and metabolic data between treatment groups or between kinetic parameters and age and a two-sided analysis of variance test to evaluate differences in hepatic GSTz1/MAAI activity among the three age groups of rats. In all cases, a p value of ≤0.05 was considered to be statistically significant. Where analytes were below the limit of detection, we set values at the limit of detection/√2 for purposes of statistical analysis. To compare the correlation between age and kinetics, the values from the two human studies were combined, and a least-squares linear regression was performed on the resultant data set to obtain the coefficient of the determination (R2).
Results
Pharmacokinetics and Biotransformation
Clinical Studies
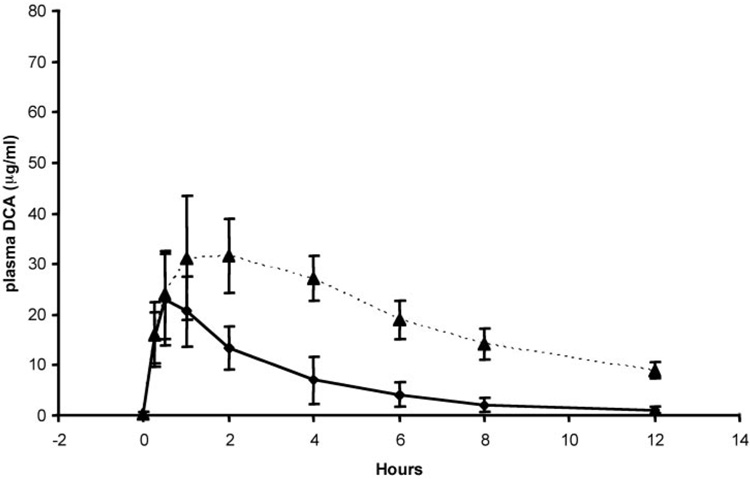
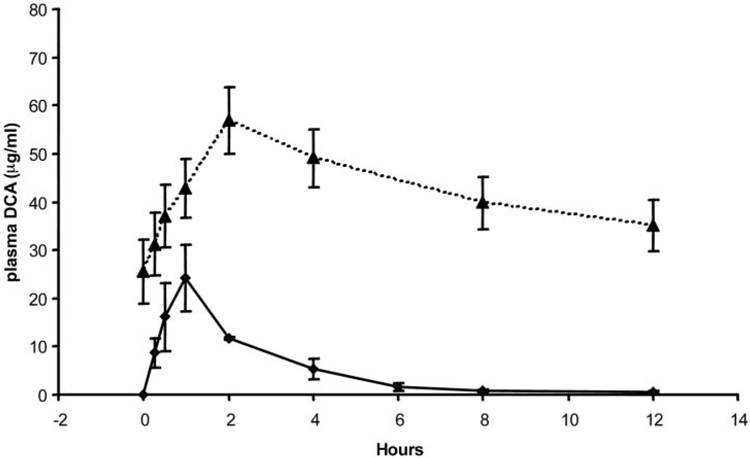
Table 1 shows the mean and S.D. values of the pharmacokinetic parameters of DCA for the five children who participated in the clinical trial at the University of Florida and for the four adults who participated in the trial conducted at Columbia University. In each study, DCA-naive individuals received 12.5 mg/kg DCA for kinetic modeling. We found no statistically significant differences in any pharmacokinetic parameter between the age groups after the initial dosage. Figure 2 and Figure 3 represent the mean ± S.D. values of the individual time versus concentration curves for the subjects studied at Florida and Columbia, respectively, and they indicate the patient groups exhibit closely similar kinetic behavior consistent with the data in Table 1. However, we found significant differences in the kinetics of plasma DCA between the groups after 6 months of continuous treatment of 25 mg/kg/day DCA. The t1/2 of DCA was 6.4 ± 3.4 h in the pediatric group, and it was 21 ± 5.8 h in the older subjects (p < 0.05). The area under the time-concentration curve extrapolated to infinity (AUC0–∞) for DCA was almost 5-fold higher in the adults, compared with the children (1500 ± 700 vs. 340 ± 130 µg/ml; p < 0.05), although total body clearance (CL) of DCA was 4-fold lower in the adults than in the children (37 ± 14 versus 8.3 ± 4.6 ml/h; p < 0.05). There was no statistical difference in the Cmax values of DCA between the groups. Figure 2 and Figure 3 also illustrate the composite time-concentration profiles after 6 months of continuous exposure to DCA. The values at time 0 represent the plasma levels of DCA carried over from the previous dose, and they clearly demonstrate that the drug is not cleared in the adult patients within the 12-h dosing interval. In contrast, both [12C]DCA and [13C]DCA are cleared from the plasma of the pediatric patients within the same dosing interval.
TABLE 1. Plasma DCA kinetics in humans.
Subjects received 12.5 mg/kg DCA. Data are mean ± S.D. of results obtained after the first DCA dose and after 6 months of daily exposure to 12.5 mg/kg every 12 h. Kinetic parameters were determined from a noncompartmental pharmacokinetic model using WinNonLin software, version 5.01.
| Parameter | First Dose |
Six Months |
||
|---|---|---|---|---|
| Children | Adults | Children | Adults | |
| No. subjects | 5 | 4 | 5 | 4 |
| Age (yr) | 5.2 ± 1.8 | 24 ± 10 | 5.7 ± 1.8 | 24.5 ± 10 |
| t1/2 (h) | 2.5 ± 0.4 | 2.1 ± 1.5 | 6.4 ± 3.4 | 21 ± 5.8 |
| Cmax (µg/ml) | 23 ± 9.1 | 25 ± 6.6 | 35 ± 10 | 53 ± 18 |
| AUC0–∞ (µg/ml · h) | 83 ± 33 | 70 ± 18 | 340 ± 130 | 1500 ± 700 |
| Clearance | 150 ± 60 | 180 ± 46 | 37 ± 14 | 8.3 ± 4.6 |
Fig. 2.
Concentration-time profile of [13C]DCA in plasma of samples obtained in five previously drug-naive young children (ages 2.2–7.1 years) after receiving an initial dose of 12.5 mg/kg (♦) and after 6 months of 12.5 mg/kg administered twice daily (▲).
Fig. 3.
Concentration-time profile of [12C]DCA in plasma of samples obtained in four previously drug-naive older subjects (ages 14.0–33.9 years) after receiving an initial dose of 12.5 mg/kg (♦) and after 6 months of 12.5 mg/kg administered twice daily (▲).
When the data from both patient groups were combined, there were no correlations between age and any kinetic parameter measured after the first DCA dose (Table 2). In contrast, moderate-to-strong correlations were obtained between age and the kinetics of DCA after 6 months of continuous exposure.
TABLE 2. Correlations between age and pharmacokinetic parameters.
Correlations between age and kinetic parameters were made from data obtained after the first DCA dose and after 6 months of daily exposure to 12.5 mg/kg every 12 h.
| Parameter | Correlation with Age (R2) (Two-Sided p Value) |
|
|---|---|---|
| First Dose (n = 9) | Six Months (n = 9) | |
| Cmax | 0.08 (0.47) | 0.40 (0.066) |
| t1/2 | 0.19 (0.23) | 0.63 (0.012) |
| AUC0–∞ | 0.14 (0.32) | 0.75 (0.003) |
| CL | 0.11 (0.38) | 0.67 (0.007) |
Rat Studies
Because of the limited number of patients in whom the age dependence of the kinetics and metabolism of DCA could be investigated, we performed more probative experiments of the drug’s toxicokinetics and biotransformation in rats of varying ages.
[13C]DCA
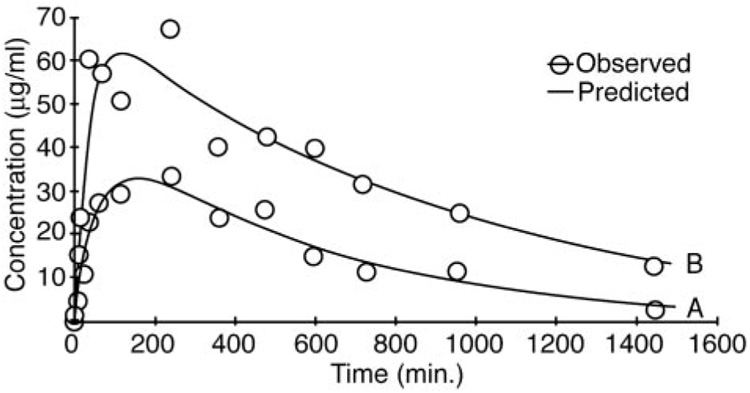
Table 3 shows the mean ± S.D. values derived from pharmacokinetic modeling of the concentration-time curves for [13C]DCA after the fifth (final) oral dose of 50 mg/kg/day as a function of age. There were differences in Cmax values (p < 0.01) between the adult and old rats and between the young and adult rats (p < 0.02), but the Cmax values in the young and the old rats were similar. There were no differences in the mean residence time or volume of distribution among the animal groups. However, plasma half-life increased as a function of age, and it was significantly higher (p < 0.03) in old animals (7.0 ± 1.1 h), compared with young rats (4.5 ± 1.5 h). In addition, the plasma AUC for DCA in the older rats (700 ± 220 µg/ml · h) was higher (p < 0.004) than that found in adult (290 ± 67 µg/ml · h) and young (370 ± 47 µg/ml · h) (p < 0.02) animals. CL was significantly lower in the oldest age group (71 ± 22 ml/h) compared with the young (130 ± 17 ml/h; p < 0.02) and adult (170 ± 40 ml/h; p < 0.01) rats. Figure 4 shows representative plasma concentration-time curves of DCA plasma elimination for young and old rats. The smaller AUC and shorter half-life are readily observed in the kinetic curve of the younger animals (Fig. 4A), compared with the older animals (Fig. 4B). In all age groups, the urinary concentration of unmetabolized 1,2-[13C]DCA in the final 24-h urine samples was approximately 200 µg/ml/animal.
TABLE 3. Plasma kinetics of DCA in rats.
Animals ranged in age from 5 to 7 weeks (young), to 7 months (adult), to 15 months (old), and they received 5 days of 50 mg/kg/day DCA, as described under Materials and Methods. Kinetic parameters were determined from a noncompartmental pharmacokinetic model using WinNonLin software, version 5.01. Data are mean ± S.D.
| Parameter | Rat Age Group |
||
|---|---|---|---|
| Young | Adult | Old | |
| Cmax (µg/ml) | 35 ± 5.0 | 24 ± 5 | 47 ± 15 |
| Tmax (h) | 1.8 ± 1.6 | 3.8 ± 2.3 | 2.8 ± 2.0 |
| Mean residence time (h) | 8.3 ± 1.2 | 10.5 ± 1.6 | 11.3 ± 1.4 |
| Volume of distribution (ml) | 0.44 ± 0.11 | 0.72 ± 0.09 | 0.40 ± 0.15 |
| t1/2 (h) | 4.5 ± 1.5 | 5.8 ± 1.3 | 7.0 ± 1.1 |
| AUC0–∞ (µg/ml · h) | 370 ± 47 | 290 ± 67 | 700 ± 220 |
| CL (ml/h) | 130 ± 17 | 170 ± 40 | 71 ± 22 |
Fig. 4.
Concentration-time profile of [13C]DCA in plasma of a representative young (A) and old (B) rat on day 5, after four daily doses of 50 mg/kg [12C]DCA.
[12C]DCA and oxalate
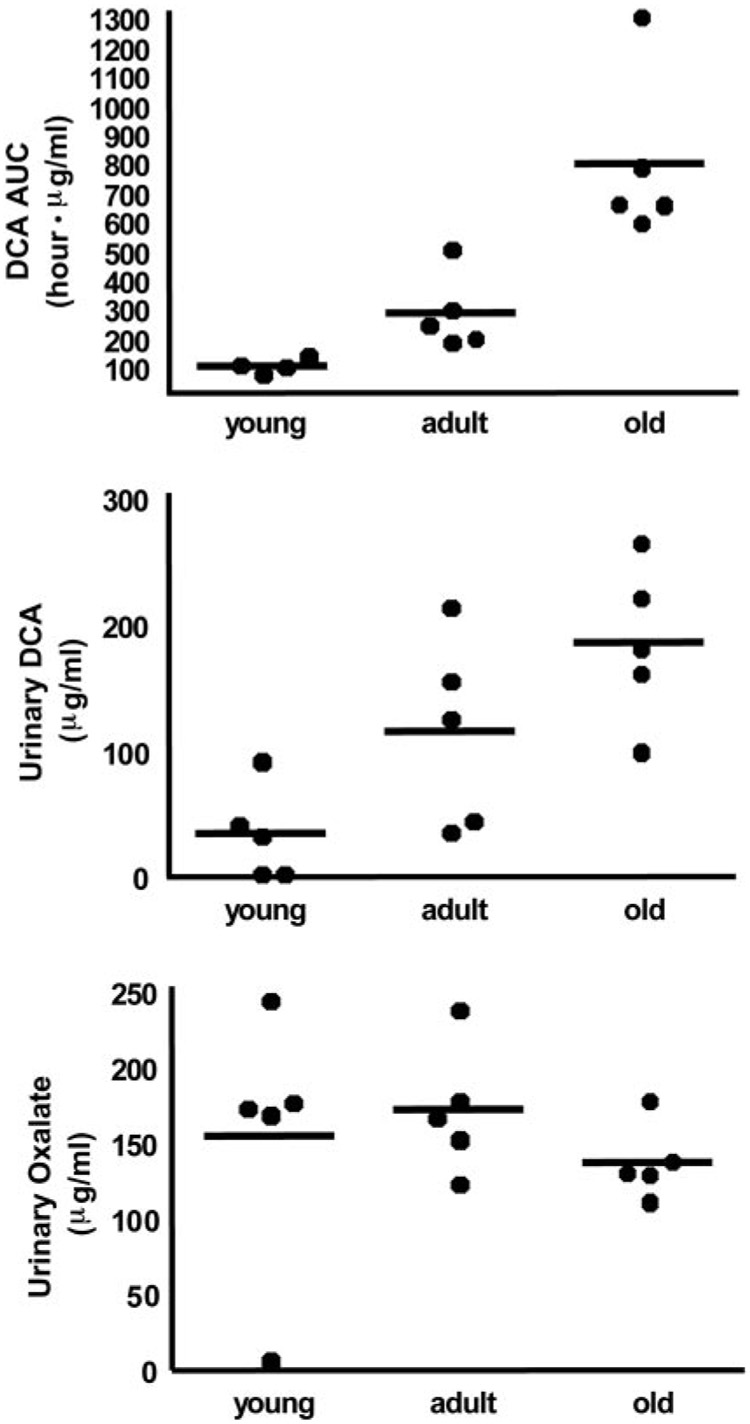
Rats received 4 days of [12C]DCA before receiving [13C]DCA administered on day 5. Figure 5A shows individual AUCs for [12C]DCA that remained in the plasma throughout day 5 when the peak plasma concentration of [12C]DCA reached 120 µg/ml in the oldest animals (data not shown), and the total DCA concentrations ([13C]DCA and [12C]DCA combined) were approximately 1 mM. The increase of the AUC of the [12C]DCA on day 5 was directly associated with age of the animals (p < 0.01), particularly between young and old rats. In addition, we found higher levels of [12C]DCA in the urine of adult and old rats compared with the young rats (Fig. 5B; p < 0.02). There was no difference in the levels of measured [13C]oxalate and [12C]glyoxylate among the age groups. However, the urinary concentration of [12C]oxalate, an end product of DCA metabolism, was lower (p < 0.04) in old rats compared with young rats (Fig. 5C).
Fig. 5.
Kinetics and biotransformation of [12C]DCA in rats as a function of age. Blood was collected on the fifth day of DCA administration at a dose of 50 mg/kg/day. Results are expressed as data from individual animals (n = 5/group) and group means (bars). AUC of [12C]DCA (A), [12C]DCA concentrations (B), and [12C]oxalate concentrations in urine (C). No urinary DCA was detected in two young rats, and no urinary oxalate was detected in one young rat, and this value was set as LOD/√2 for statistical analyses.
MCA concentrations
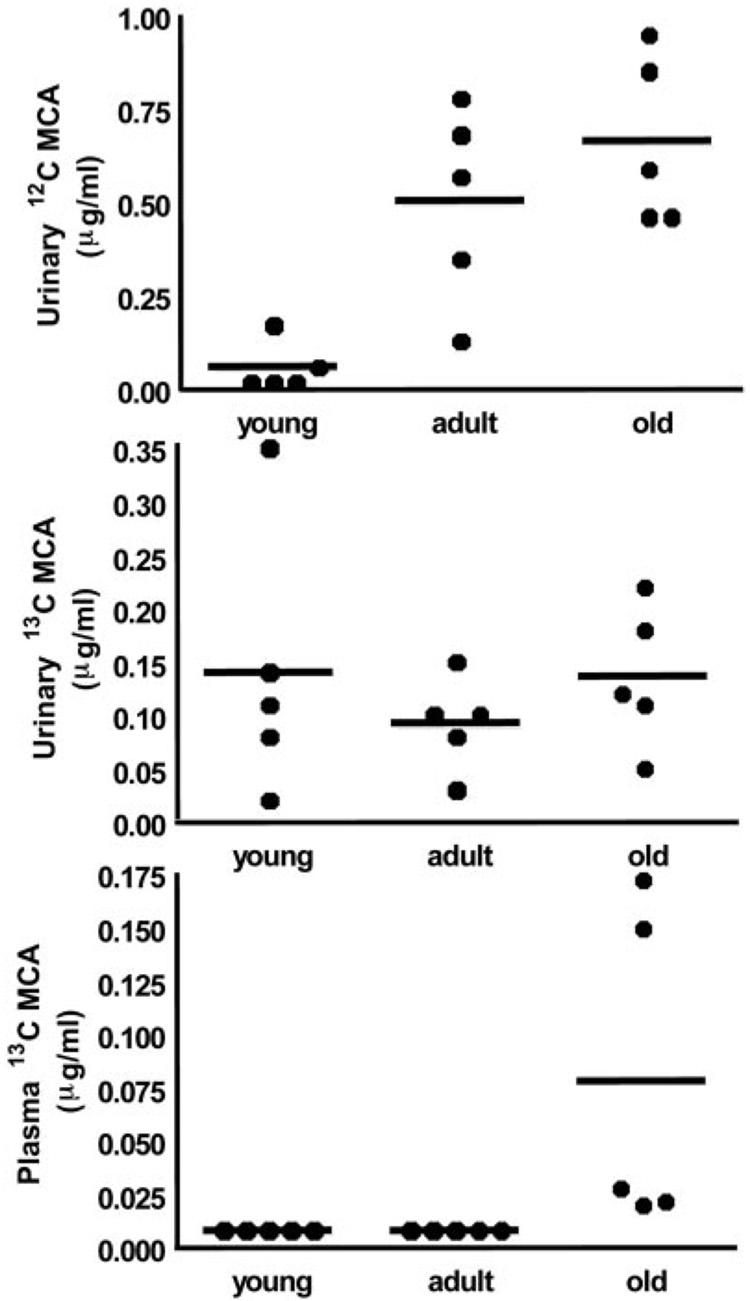
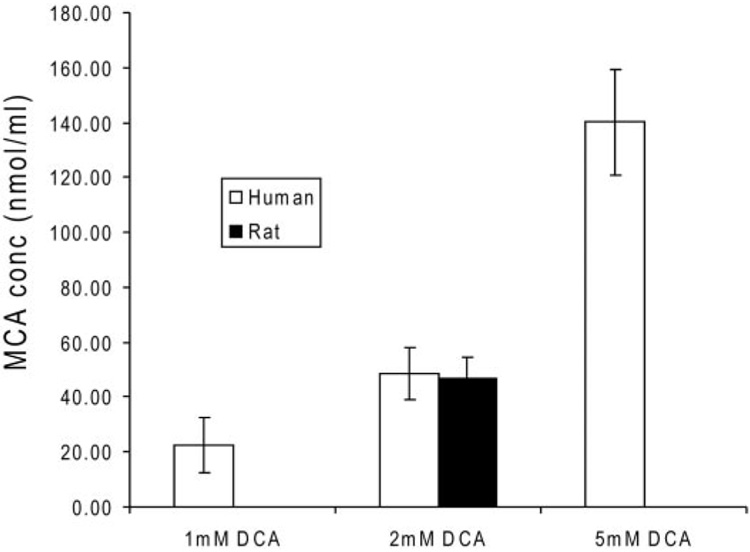
We measured urinary [12C]MCA in two of the five young rats. Similar to the data obtained for DCA, urinary levels of [12C]MCA increased with age (Fig. 6A), although the groups contained similar concentrations of [13C]MCA (Fig. 6B). We found no detectable MCA (<0.01 µg/ml) in the plasma of young and adult rats, whereas [13C]MCA was detectable in the plasma of old rats (Fig. 6C). To test the hypothesis that DCA conversion to MCA occurs in the blood compartment, we incubated [12C]DCA with whole blood from human and rat sources, and we detected the presence of MCA under all experimental conditions (Fig. 7). Rat and human blood produced similar amounts of MCA when incubated in the presence of 2 mM DCA. The levels of MCA measured in blood were proportional to the concentration of DCA added, and they were approximately 1% of the original DCA concentrations. We found no MCA in samples of organic-free (spring) water incubated for 1 h at 37°C with 1, 2, or 5 mM DCA.
Fig. 6.
Urinary (A and B) and plasma (C) concentrations of MCA as a function of age. Data are from individual animals (n = 5/group) and group means (bars). No urinary [12C]MCA was detected in three young rats, and no urinary [13C]MCA was detected in one young rat, and these values were set at LOD/√2 for statistical analysis.
Fig. 7.
[12C]MCA concentrations (nanomoles per milliliter) in human whole blood incubated with [12C]DCA (millimolar)-fortified whole blood. Data are the mean ± S.D. of the measured MCA concentrations of four separate replicates. Studies were conducted in whole blood incubated for 1 h with 1, 2, or 5 mM DCA and from blood from an adult female Sprague-Dawley rat incubated for 1 h with 2 mM DCA.
GSTz/MAAI activity and expression and tyrosine catabolites
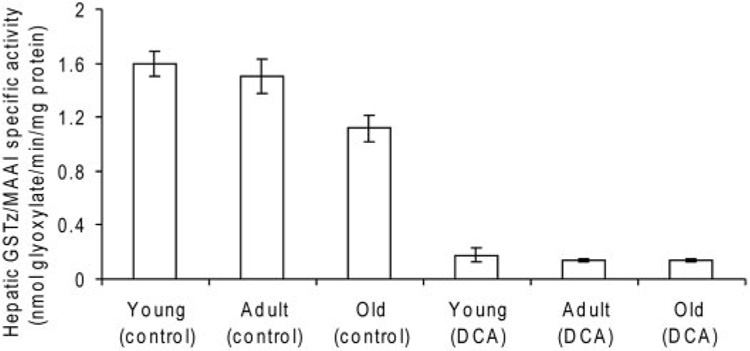
Hepatic GSTz1/MAAI specific activity in DCA-naive animals was inversely related to age (Fig. 8). The activity in young rats (1.60 ± 0.09 nmol/min/mg protein) was 1.4-fold greater than that measured in the livers of old animals (1.12 ± 0.01 nmol/min/mg protein; p < 0.01). GSTz1/MAAI activity decreased approximately 90% after 5 days of treatment among all ages. The expression of GSTz1/MAAI assessed by Western immunoblots was similar at baseline among age groups, and it decreased approximately 80% among all groups after 5 days of DCA exposure (data not shown).
Fig. 8.
GSTz/MAAI specific activity with DCA as substrate in liver cytosol of control and DCA-treated rats, expressed as nanomoles of glyoxylate formed per minute per milligram of protein. Data are mean ± S.D., with five animals per group. p < 0.04 in old control rats compared with young and adult rats; p < 0.001 between age-appropriate control and DCA-treated groups.
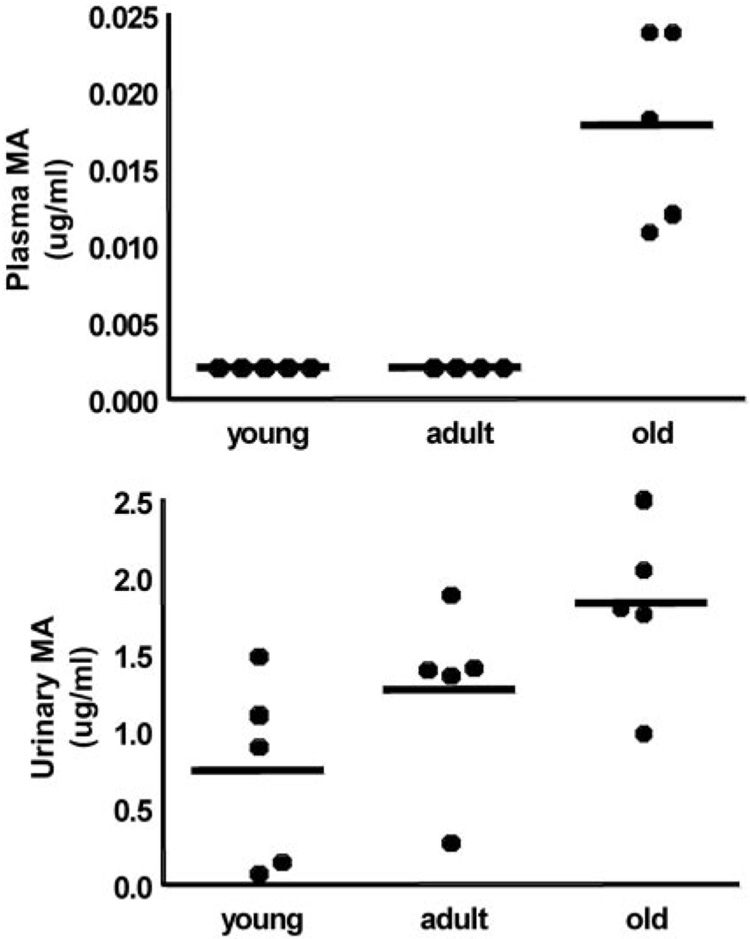
We detected maleylacetone, a potentially toxic tyrosine metabolite, in the plasma of only old rats exposed to DCA (Fig. 9A). Furthermore, we found that the concentration of maleylacetone in the final 24-h urine samples was higher (p < 0.04) in old rats compared with young animals (Fig. 9B). We did not detect succinylacetone in any of the samples.
Fig. 9.
Plasma (A) and urinary (B) MA concentrations after 5 days of DCA (50 mg/kg/day) as a function of age. Data are values of individual animals (n = 5/group) and group means (bars). There was no detectable urinary MA in one young rat and this value was set at LOD/√2 for statistical analysis.
Discussion
These data indicate that age is an important variable in the kinetics and metabolism of DCA and in its effects on tyrosine biochemistry. Although adequate data on the pharmacokinetics of DCA were available for only a few of the patients who participated in the two clinical trials of DCA, it is clear that age is directly proportional to the rate at which the drug is cleared from the plasma after chronic exposure. This interpretation is consistent with the finding that, despite very similar kinetic profiles between drug-naive children and adults, the subsequent changes in all the measured kinetic parameters (Table 1) and plasma concentration-time curves (Fig. 2 and Fig. 3) are disproportionately greater in the adults. Indeed, the results presented in Table 2 suggest that the changes in the plasma kinetics of DCA in individuals chronically exposed to the drug are fairly linear over the first three decades of life.
The data obtained in the rat experiments also shed new light on the effect of age on DCA metabolism. Total body clearance of the drug in rats is directly associated with age of the animal, leading to increased plasma accumulation of DCA as shown in the increase of AUC0–∞ (Table 3). The reduced biotransformation of DCA to glyoxylate in the oldest rat group leads to decreased urinary excretion of one of its terminal end products, oxalate (Fig. 5). In contrast, conversion of DCA to MCA through a minor pathway seems to increase markedly in older rats, compared with young or adult animals (Fig. 6). The mechanism accounting for reductive monodehalogenation of DCA in vivo is unknown. However, it seems that one site of DCA biotransformation to MCA is the circulation, based on findings obtained upon incubating DCA ex vivo in whole blood from either rats or humans (Fig. 7). We speculate that the age-dependent formation of MCA occurs as a result of the greater accumulation of DCA in the blood of older animals because of its diminished rate of plasma clearance.
The plasma concentration of MCA even in old animals is only a small fraction of the DCA dose administered. Nevertheless, MCA is severalfold more toxic to rodents than DCA or trichloroacetic acid, and it has been associated with neurotoxicity in animals and with life-threatening lactic acidosis in both humans and rodents after topical or systemic exposure (Stacpoole, 1989; Stacpoole et al., 1998). [13C]MCA has been detected occasionally in the plasma of healthy subjects administered clinically relevant doses of [13C]DCA (A. L. Shroads, G. N. Henderson, and P. W. Stacpoole, unpublished observation), but the toxicological significance of this finding to humans chronically exposed to DCA is unknown.
Maleylacetone and its acid analog, maleylacetoacetate, are intermediates in the pathway of tyrosine catabolism, and they are capable of forming adducts with GSTz/MAAI (Lantum et al., 2002). Maleylacetoacetate and its isomer, fumary-lacetoacetate, are thought to be causative in the hepatotoxicity associated with patients with hereditary tyrosinemia type I (Mitchell et al., 2001). We found higher levels of maleylacetone in the urine and plasma of the oldest rats (Fig. 9), consistent with the notion that the effects of chemical (DCA) knockdown of GSTz/MAAI (Ammini et al., 2003) are greatest in older animals and that they lead to accumulation of the natural substrates for the enzyme.
Given these observations regarding age-dependent changes in the plasma kinetics and biotransformation of DCA and its effect on circulating maleylacetone levels, it was somewhat surprising that the effects of DCA in reducing GSTz1/MAAI activity and expression in rat liver were qualitatively similar regardless of age (Fig. 8). These findings differ from results reported with mice, in which DCA treatment caused a greater lowering of hepatic GSTz activity in young compared with old animals (Schultz et al., 2002). It is clear that the age-dependent decrease in the plasma clearance of DCA, together with the accumulation of both MCA and maleylacetone in old rats, cannot be accounted for by any measurable effect of the drug on its primary metabolizing enzyme. Another possible explanation for these findings is that there are age-related differences in the elimination of DCA, MCA, and maleylacetone. If transporter proteins are involved in elimination of these compounds, there may be age-related differences in their expression and function. Alternative pathways for the accumulation of maleylacetone and MCA are possible, but to our knowledge they have not been evaluated directly, except for the apparent capacity of whole blood to biotransform DCA to MCA (Fig. 7) (Li et al., 2006).
Regardless of what mechanism accounts for the altered DCA kinetics and metabolism with advancing age, our findings have potential clinical significance in elucidating the neurotoxicity of this agent in humans. Despite anecdotal reports of occasional reversible peripheral neuropathy in patients chronically treated with DCA over the 25 to 50 mg/kg/ day dose range (Stacpoole et al., 1998), only two randomized, placebo-controlled trials have prospectively evaluated the effect of the drug on peripheral nerve function in two populations of patients with genetic mitochondrial diseases (Kaufmann et al., 2006; Stacpoole et al., 2006). These reports demonstrated marked differences in susceptibility to DCA-associated neurotoxicity, with older subjects manifesting a high incidence of peripheral neuropathy, compared with no demonstrable adverse peripheral nerve effects in young children in whom the duration of exposure to DCA was even greater.
Further assessment of long-term tolerance to open label DCA in nine pediatric patients (current mean age and standard deviation 12.9 ± 2.9 years) treated for up to 10 years with the compound have revealed some decline in peripheral nerve function (Stacpoole et al., 2008). However, it cannot be determined whether this change in nerve conduction is related more to long-term DCA exposure or to the natural progression of the underlying disease of the patients, in whom peripheral neuropathy is common (Stickler et al., 2006).
The present study provides a possible explanation for the divergent toxicological findings in children and adults. Accordingly, for reasons that remain to be elucidated, young age may be an important factor in tolerating chronic DCA because of a proportionately greater ability to clear the drug and its metabolites from the circulation and cause less accumulation of the potential toxins maleylacetone and MCA. Further research is required to determine with certainty the effect of age on DCA and tyrosine metabolism in humans. However, the present data have important implications for the long-term administration of DCA in genetic mitochondrial and other chronic diseases.
Acknowledgments
We thank the patients and their families for participation; the dedicated staffs of the general clinical research centers; Dr. Petra Kaufmann and Kris Engelstad of the Department of Neurology, Columbia University, for access to patient samples; Dr. Jon Shuster for statistical advice; and Candace Caputo for editorial assistance.
This study was supported by National Institutes of Health Grants ES-007355, ES-07375, ES-014617, and M01 RR-000082; some of this work was presented previously in abstract form: Stacpoole PW, Shroads AL, Felitsyn NM, Notterpek L, Calcutt NA (2006) Mechanism of age dependence of dichloroacetate-induced peripheral neuropathy. United Mitochondrial Disease Foundation; 2006 Jun 14–18; Atlanta, GA. United Mitochondrial Disease Foundation, Pittsburgh, PA.
ABBREVIATIONS
- DCA
dichloroacetate
- GSTz1
ζ-1 family isoform of glutathione transferase
- MAAI
maleylacetoacetate isomerase
- MA
maleylacetone
- MELAS
mitochondrial encephalomyopathy, lactic acidosis, and stroke-like episodes
- GC-MS
gas chromatography-mass spectrometry
- MCA
monochloroacetate
- AUC
area under the plasma-concentration time curve
- CL
total body clearance
- LOD
limit of detection
References
- Ammini CV, Stacpoole PW. Biotransformation, toxicology and pharmacogenomics of dichloroacetate. In: Gribble GW, editor. The Handbook of Environmental Chemistry. New York: Springer-Verlag New York Inc; 2003. pp. 215–234. [Google Scholar]
- Ammini CV, Fernandez-Canon J, Shroads AL, Cornett R, Cheung J, James MO, Henderson GN, Grompe M, Stacpoole PW. Pharmacologic or genetic ablation of maleylacetoacetate isomerase increases levels of toxic tyrosine catabolites in rodents. Biochem Pharmacol. 2003;66:2029–2038. doi: 10.1016/j.bcp.2003.07.002. [DOI] [PubMed] [Google Scholar]
- Anders MW, Anderson WB, Hoffman BML, Board PG. Activation of halocarbons by GSTz. Drug Metab Rev. 2001;33 Suppl 1:5. [Google Scholar]
- Chen LH, Hu N, Snyder DL. Effects of age and dietary restriction on liver glutathione transferase activities in Lobund-Wistar rats. Arch Gerontol Geriatr. 1994;18:191–205. doi: 10.1016/0167-4943(94)90013-2. [DOI] [PubMed] [Google Scholar]
- Cornett R, James MO, Henderson GN, Cheung J, Shroads AL, Stacpoole PW. Inhibition of glutathione S-transferase zeta and tyrosine metabolism by dichloroacetate: a potential unifying mechanism for its altered biotransformation and toxicity. Biochem Biophys Res Commun. 1999;262:752–756. doi: 10.1006/bbrc.1999.1287. [DOI] [PubMed] [Google Scholar]
- Curry S, Lorenz A, Chu PI, Limacher M, Stacpoole PW. Disposition and pharmacodynamics of dichloroacetate (DCA) and oxalate following oral DCA dose. Biopharm Drug Dispos. 1991;12:375–390. doi: 10.1002/bdd.2510120507. [DOI] [PubMed] [Google Scholar]
- Guo X, Dixit V, Liu H, Shroads AL, Henderson GN, James MO, Stacpoole PW. Inhibition and recovery of rat hepatic glutathione S-transferase ζ and alteration of tyrosine metabolism following dichloroacetate exposure and withdrawal. Drug Metab Dispos. 2006;34:36–42. doi: 10.1124/dmd.105.003996. [DOI] [PubMed] [Google Scholar]
- James MO, Cornett R, Yan Z, Henderson GN, Stacpoole PW. Glutathione-dependent conversion to glyoxylate, a major pathway of dichloroacetate biotransformation in hepatic cytosol from humans and rats, is reduced in dichloroacetate-treated rats. Drug Metab Dispos. 1997;25:1223–1227. [PubMed] [Google Scholar]
- James MO, Yan Z, Cornett R, Jayanti VM, Henderson GN, Davydova N, Katovich MJ, Pollock B, Stacpoole PW. Pharmacokinetics and metabolism of [14C]-dichloroacetic acid in the male Sprague-Dawley rat: identification of glycine conjugates, including hippurate, as urinary metabolites of dichloroacetate. Drug Metab Dispos. 1998;26:1134–1143. [PubMed] [Google Scholar]
- Jia M, Coats BS, Chadha M, Frentzen B, Perez-Rodriguez J, Chadik PA, Yost RA, Henderson GN, Stacpoole PW. Human kinetics of orally and intravenously administered low dose 1,2-13C-dichloroacetate. J Clin Pharmacol. 2006;46:1449–1459. doi: 10.1177/0091270006292627. [DOI] [PubMed] [Google Scholar]
- Kaufmann P, Engelstad K, Wei Y, Jhung S, Sano MC, Shungu DC, Millar WS, Hong X, Gooch CL, Mao X, et al. Dichloroacetate causes toxic neuropathy in MELAS. Neurology. 2006;66:324–330. doi: 10.1212/01.wnl.0000196641.05913.27. [DOI] [PubMed] [Google Scholar]
- Lantum HB, Liebler DC, Board PG, Anders MW. Alkylation and inactivation of human glutathione transferase zeta (hGSTZ1-1) by maleylacetone and fumarylacetone. Chem Res Toxicol. 2002;15:707–716. doi: 10.1021/tx025503s. [DOI] [PubMed] [Google Scholar]
- Li YP, Cao HB, Zhang Y. Electrochemical dechlorination of chloroacetic acids (CAAs) using hemoglobin-loaded carbon nanotube electrode. Chemosphere. 2006;63:359–364. doi: 10.1016/j.chemosphere.2005.07.014. [DOI] [PubMed] [Google Scholar]
- Mitchell GA, Grompe M, Lambert M, Tanguay RM. Hypertyrosinemia. In: Scriver R, Beaudet AL, Sly WS, Valle D, editors. The Metabolic and Molecular Bases of Inherited Disease. 8th ed. New York: McGraw-Hill Companies; 2001. pp. 1777–1805. [Google Scholar]
- Römpp A, Klemm O, Fricke W, Frank H. Haloacetates in fog and rain. Environ Sci Technol. 2001;35:1294–1298. doi: 10.1021/es0012220. [DOI] [PubMed] [Google Scholar]
- Schultz IR, Merdink JL, Gonzalez-Leon A, Bull RJ. Dichloroacetate toxicokinetics and disruption of tyrosine catabolism in B6C3F1 mice: dose-response relationships and age as a modifying factor. Toxicology. 2002;173:229–247. doi: 10.1016/s0300-483x(02)00034-3. [DOI] [PubMed] [Google Scholar]
- Shroads AL, Henderson GN, Cheung J, James MO, Stacpoole PW. Unified gas chromatographic-mass spectrometric method for quantitating tyrosine metabolites in urine and plasma. J Chromatogr B. 2004;808:153–161. doi: 10.1016/j.jchromb.2004.05.005. [DOI] [PubMed] [Google Scholar]
- Stacpoole PW. The pharmacology of dichloroacetate. Metabolism. 1989;38:1124–1144. doi: 10.1016/0026-0495(89)90051-6. [DOI] [PubMed] [Google Scholar]
- Stacpoole PW, Gilbert LR, Neiberger RE, Carney PR, Valenstein E, Theriaque DW, Shuster JJ. Evaluation of long-term treatment of children with congenital lactic acidosis with dichloroacetate. Pediatrics. 2008 doi: 10.1542/peds.2007-2062. in press. [DOI] [PMC free article] [PubMed] [Google Scholar]
- Stacpoole PW, Henderson GN, Yan Z, Cornett R, James MO. Pharmacokinetics, metabolism and toxicology of dichloroacetate. Drug Metab Rev. 1998;30:499–539. doi: 10.3109/03602539808996323. [DOI] [PubMed] [Google Scholar]
- Stacpoole PW, Kerr DS, Barnes C, Bunch ST, Carney PR, Fennell EM, Felitsyn NM, Gilmore RL, Greer M, Henderson GN, et al. A controlled clinical trial of dichloroacetate for treatment of congenital lactic acidosis in children. Pediatrics. 2006;117:1519–1521. doi: 10.1542/peds.2005-1226. [DOI] [PubMed] [Google Scholar]
- Stickler DE, Valenstein E, Neiberger RE, Perkins LA, Carney PR, Shuster JJ, Theriaque DW, Stacpoole PW. Peripheral neuropathy in genetic mitochondrial diseases. Pediatr Neurol. 2006;34:127–131. doi: 10.1016/j.pediatrneurol.2005.08.006. [DOI] [PubMed] [Google Scholar]
- Tee LBG, Gilmore KS, Meyer DJ, Ketterer B, Vandenburghe Y, Yeoh GCT. Expression of glutathione S-transferase during rat liver development. Biochem J. 1992;282:209–218. doi: 10.1042/bj2820209. [DOI] [PMC free article] [PubMed] [Google Scholar]
- Zolodz MD, Jia M, Liu H, Henderson GN, Stacpoole PW. A GC-MS/MS method for the quantitative analysis of low levels of the tyrosine metabolites maleylacetone, succinylacetone, and the tyrosine metabolism inhibitor dichloroacetate in biological fluids and tissues. J Chromatogr B Analyt Technol Biomed Life Sci. 2006;837:125–132. doi: 10.1016/j.jchromb.2006.04.027. [DOI] [PubMed] [Google Scholar]


