Abstract
Objective
There are marked mitochondrial abnormalities in parkin-knock out drosophila and other model systems. The aim of our study was to determine mitochondrial function and morphology in parkin-mutant patients. We also investigated whether pharmacological rescue of impaired mitochondrial function may be possible in parkin-mutant human tissue.
Methods
We used three sets of techniques, namely biochemical measurements of mitochondrial function, quantitative morphology and live cell imaging of functional connectivity to assess the mitochondrial respiratory chain, the outer shape and connectivity of the mitochondria and their functional inner connectivity in fibroblasts from patients with homozygous or compound heterozygous parkin mutations.
Results
Parkin-mutant cells had lower mitochondrial complex I activity and complex I linked ATP-production which correlated with a higher degree of mitochondrial branching, suggesting that the functional and morphological effects of parkin are related. Knockdown of parkin in control fibroblasts confirmed that parkin deficiency is sufficient to explain these mitochondrial effects. In contrast, 50% knockdown of parkin, mimicking haploinsufficiency in human patient tissue, did not result in impaired mitochondrial function or morphology. Fluorescence recovery after photobleaching (FRAP) assays demonstrated a lower level of functional connectivity of the mitochondrial matrix which further worsened after rotenone exposure. Treatment with experimental neuroprotective compounds resulted in a rescue of the mitochondrial membrane potential.
Interpretation
Our study demonstrates marked abnormalities of mitochondrial function and morphology in parkin-mutant patients and provides proof of principle data for the potential usefulness of this new model system as a tool to screen for disease-modifying compounds in genetically homogenous parkinsonian disorders.
The predominant histopathological feature of Parkinson’s Disease (PD) is loss of dopaminergic neurons in the substantia nigra, but there is growing evidence for widespread biochemical and morphological abnormalities both within and outside the central nervous system in PD patients.1 Both genetic factors and exogenous toxins are involved in the pathogenesis of PD.2 Autosomal recessively inherited, homozygous or compound heterozygous mutations in the PARK2 gene parkin are the most common identifiable genetic cause for early onset parkinsonism.3 There is also an ongoing debate as to whether a single heterozygous parkin mutation may confer increased susceptibility to PD.4-6 Recently, there has been growing evidence for impaired mitochondrial function and morphology in parkin deficiency from different model systems.7
The aim of our study was to characterize mitochondrial respiratory chain function and morphology in human tissue to further investigate whether mitochondrial abnormalities are also present in parkin-mutant patients. We used three sets of techniques, namely biochemical measurements of mitochondrial function, quantitative morphology and live cell imaging of mitochondrial connectivity, to show that parkin mutant patient cells have profound mitochondrial functional deficits and increased susceptibility to the complex I inhibitor rotenone. The combination of quantitative morphology and live cell imaging using the fluorescence recovery after photobleaching (FRAP) assay allowed us to assess both the outer shape of the mitochondria and the degree of functional connectivity of the mitochondrial matrix.
In parallel, we undertook siRNA knockdown studies to confirm that these effects were due to parkin deficiency itself rather than secondary mechanisms. This included partial siRNA knockdown with a reduction of endogenous parkin levels to 50% to obtain a better understanding of the effects of parkin haploinsufficiency in human disease.
We finally undertook rescue experiments with experimental neuroprotective agents to determine whether parkin-mutant fibroblasts may be a useful new tool to screen for disease-modifying compounds in PD.
Methods
Punch skin biopsies were taken from five patients with homozygous or compound heterozygous mutations in the parkin gene following routine clinical procedures. Genotyping was performed using direct DNA sequencing and the MPLA parkin gene dosage kits (P051 and P052B, MRC Holland), covering all exons of the parkin gene as well as other known Mendelian PD genes; the protocol used was per manufacturers’ instructions. Control fibroblasts were obtained from 6 healthy controls (Corriell Cell Repositories). There was no difference in age between the control and patient group (controls 37 +/- 5.2 years, parkin patients 42 +/- 5.8 years, mean +/- standard deviation).
All biochemical measurements using control, parkin mutant and siRNA mediated parkin knockdown fibroblasts were performed on 3 separate samples. Morphological assessments were carried out on 25 cells per cell line per day and then on 3 separate occasions.
Fibroblast cell culture
Primary fibroblast cells were cultured continuously in Minimum Essential Medium with 10% FBS, 100 IU/ml penicillin, 100 μg/ml streptomycin, 1 mM sodium pyruvate, 2 mM L-glutamine, 0.1 mM amino acids, 50 μg/ml uridine and 1 X MEM vitamins. This glucose containing culture medium was used for all measurements (both biochemical and morphological) unless otherwise stated.
Measurement of mitochondrial membrane potential
Fibroblasts were plated at 40% confluency in 96 well plates, 24 hours later cells were changed into galactose culture medium as described before.8 The mitochondrial membrane potential was then measured using the fluorescent dye Tetramethylrhodamine methyl ester (TMRM) after a further 24h as described before.9 In order to remove the plasma membrane contribution to the TMRM fluorescence, each assay was performed in parallel as above plus 10μM carbonyl cyanide 3-chlorophenylhydrazone (CCCP), which collapses the mitochondrial membrane potential. All data is expressed as the total TMRM fluorescence minus the CCCP treated TMRM fluorescence. Cell number was measured using the ethidium homodimer fluorescent dye in a parallel plate after freeze thawing.
Assessment of mitochondrial respiratory chain function
Measurement of complexes I, II, III and IV of the mitochondrial respiratory chain was carried out on mitochondrial enriched fractions of fibroblasts as described previously.10 The specific activity of each complex was normalized to that of citrate synthase.11
ATP production
Cellular ATP levels were measured using the ATPlite kit (Perkin Elmer), according to the manufacturer’s instructions. ATP production assays were performed on digitonin treated fibroblasts as described elsewhere.12 Cellular ATP levels measure total cellular ATP, whereas ATP production assays measure the capacity of the respiratory chain to generate ATP within the mitochondria.
Mitochondrial Morphology Assessment
Fibroblasts were stained with the fluorescent dye rhodamine 123, plated and imaged as previously described.13 Raw images were binarised and mitochondrial morphological characteristics were quantified. These were length or aspect ratio (AR, the ratio between the major and minor axis of the ellipse equivalent to the mitochondrion), degree of branching or form factor (FF, defined as (Pm2)/(4πAm), where Pm is the length of mitochondrial outline and Am is the area of mitochondrion), and number of mitochondria per cell (Nc).
siRNA mediated parkin knockdown
siRNA oligonucleotides were targeted to base pair 1102-1123 of the parkin gene (sequence sense strand 5′-3′ TGTAAAGAAGCGTACCATtt). 10nM siRNAs (parkin targeted or scramble negative or GAPDH positive (Ambion) were transfected into control primary fibroblasts using 0.5mM lipofectamine 2000 according to the manufacturers’ instructions. Transfection efficiency was checked by flow cytometry of the scramble (fluorescently labelled) siRNA transfected cells.
Toxin Exposure
Cells were exposed to 100nM rotenone (Sigma) for 72 hours prior to mitochondrial membrane measurement or mitochondrial morphological analysis.
Fluorescence recovery after photobleaching
Fluorescence recovery after photobleaching (FRAP) was performed as previously described.14 Briefly, cells were transiently transfected with 0.5 μg of mitochondrial matrix-localized YFP. Circular regions of interest (ROI), 2.5 μm in diameter, were imaged before and after photobleach with 4 iterations of 514-nm laser set to 100% power.
Scans were taken in 0.25 second intervals, for a total of 40 images and the fluorescence intensity in imaged ROIs was digitized with LSM 510 software (Zeiss MicroImaging). Each FRAP curve represents the average of ≥30 measurements obtained on 2-3 separate occasions. Mobile Fractions were calculated as follows: Mobile Fraction = [(FRAPt-Background)/FRAPi][(NSPBi-Background)/NSPBt].
Western blots
Cell pellets were lysed and protein amount measured using the Bradford method as described previously.15 Proteins were resolved on a 10% SDS-PAGE gel, using monoclonal mouse anti-parkin primary antibody (Cell Signalling), monoclonal mouse anti-actin primary antibody (Abcam) or monoclonal mouse anti-GAPDH primary antibody (Abcam). Densitometry was carried out using the MultiImage Lite system (Alpha Innotech).
Pharmacological rescue
Rescue experiments were carried out using the glutathione precursor substance oxothiazolidine 4-carboxylate (OTCA) and cell permeable glutathione (glutathione methyl ester, GME). Dose response curves measuring mitochondrial membrane potential were performed as above after 24 hour treatment with OTCA at 0.01, 0.03, 0.1, 0.3, 1, 3, 10 and 30mM. For all subsequent experiments cells were treated with 10μM OTCA or 100μM GME for 24 hours prior to assay of mitochondrial membrane potential or measurement of cellular ATP levels.
Cell growth and viability assays
Cell viability was assessed using the CytoTox-ONE Homogeneous Membrane Integrity Assay kit (Promega) which measures the release of lactate dehydrogenase from cells with a damaged membrane. Cell growth was assessed using the CyQuant NF Cell Proliferation Assay Kit (Invitrogen) which measures cellular DNA content via fluorescence dye binding. Both assays were performed according to the manufacturers instructions.
Statistical Analysis
Values from multiple experiments were expressed as means +/- SE (standard error). Statistical significance (Bonferroni corrected) was assessed using Student’s t-test for data with a normal distribution, a non-parametric t-test was used for data with a skewed distribution. The effect of multiple factors was assessed using a 2-way ANOVA test. R2 was used as a measure of the goodness of the fit during linear regression analysis.
Results
Functional mitochondrial impairments in fibroblasts with parkin mutations
We first investigated the mitochondrial membrane potential in primary fibroblast cultures of 5 patients with homozygous or compound heterozygous parkin mutations (see table 1) and 6 age matched controls to determine the overall oxidative phosphorylation activity of the mitochondrial respiratory chain in parkin mutant patient tissue. Mitochondrial membrane potential was lower in all 5 parkin mutant fibroblast cultures by an average of 30% (Fig. 1A; p < 0.01). However, when the culture medium was changed to include galatcose as an energy source rather than glucose, thereby switching it to a more oxidative state, the mitochondrial membrane potential was then even lower by an average of 70% (Fig 1A; p < 0.0001).
Table 1.
Parkin mutations detected on either allele in the five patients with early onset parkinsonism and homozygous or compound heterozygous parkin mutations. See method section for further details.
| First mutation | Second mutation | |
|---|---|---|
| Patient 1 | 255del_A het ( exon 2) | Deletion exon 5 |
| Patient 2 | 202_203delAG ( exon 2) | 202_203delAG ( exon 2) |
| Patient 3 | 202_203delAGhet (exon 2) | Deletion exon 2 |
| Patient 4 | 202_203delAG (exon 2) | Deletion exon 4 |
| Patient 5 | c.101-102delAG p.Gln34ArgfsX38 |
c.1289G<A p.Gly430Asp |
Figure 1.
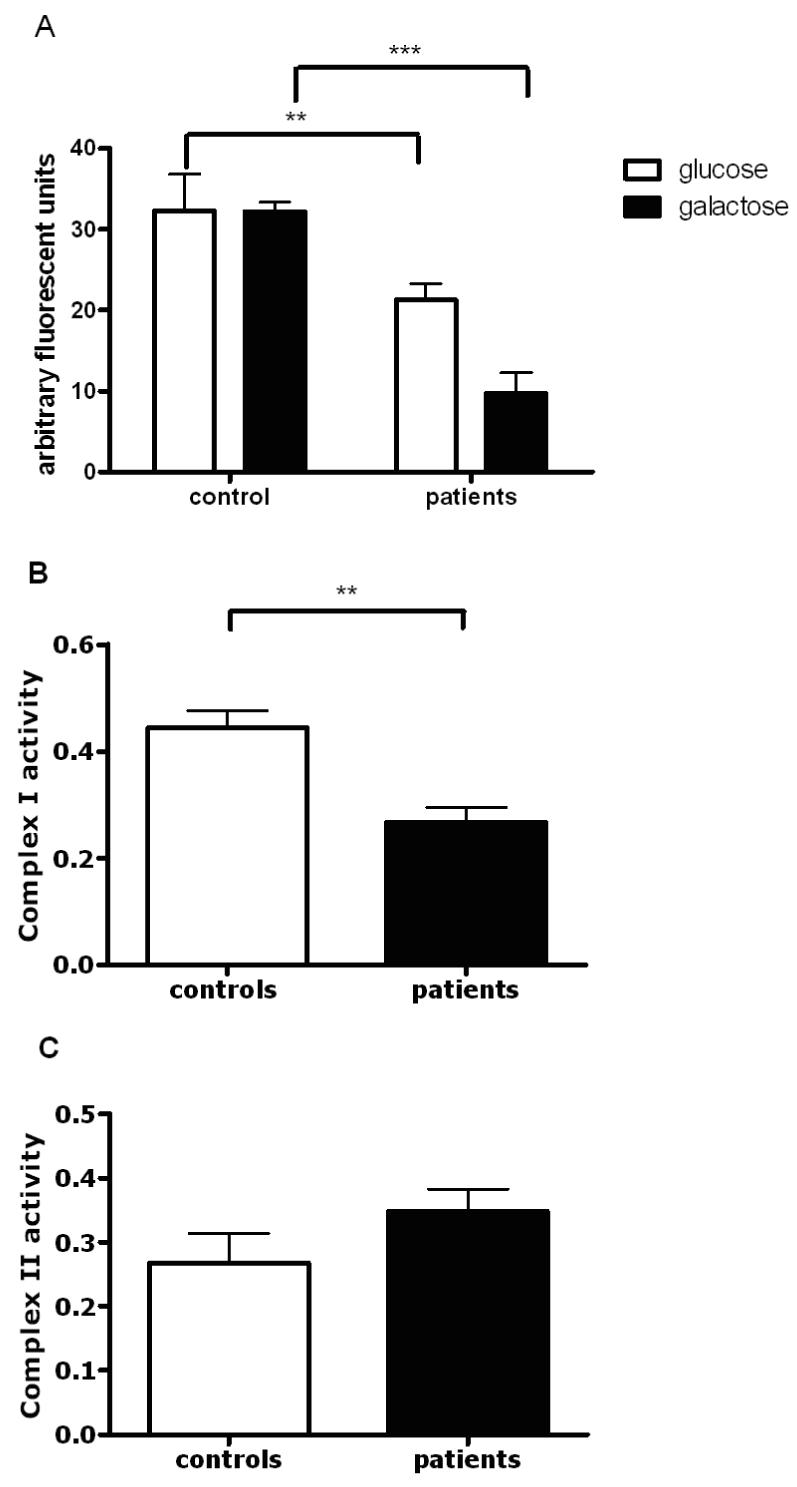
Mitochondrial respiratory chain function in controls and parkin mutant fibroblasts. (A) Overall mitochondrial membrane potential in the patient group is decreased by 30%, ** p < 0.01 when cells are grown in glucose containing culture medium, however this reduction is even more severe (reduction by 70%, *** p < 0.0001) in the patient group when cells are grown in galactose containing medium. Measurement of mitochondrial membrane potential was performed on 3 separate occasions in all samples, data is presented as mean +/- SEM. All subsequent biochemical and morphological analyses were also performed on 3 separate occasions and are presented as mean +/- SEM unless otherwise stated. (B) Subsequent spectrophotometric assessment of individual respiratory chain complexes demonstrated a specific reduction of complex I activity in the patient group by 45%, ** p < 0.01. (C) In contrast, complex II activity was similar in patients and controls, p > 0.05.
We next determined whether the observed decrease in the mitochondrial membrane potential was related to impaired function of a particular complex of the mitochondrial respiratory chain or due to overall impaired function. Spectrophotometric assessment of the activity of each individual complex in mitochondrially enriched fractions demonstrated that complex I activity was lower by an average of 42% in parkin mutant fibroblasts compared to controls (Fig. 1B; p < 0.005). Complex II activity showed a trend towards higher activity, but this was not significant (Fig. 1C; p > 0.05). Complex III and complex IV activity were similar in the parkin mutant patients and controls (data not shown).
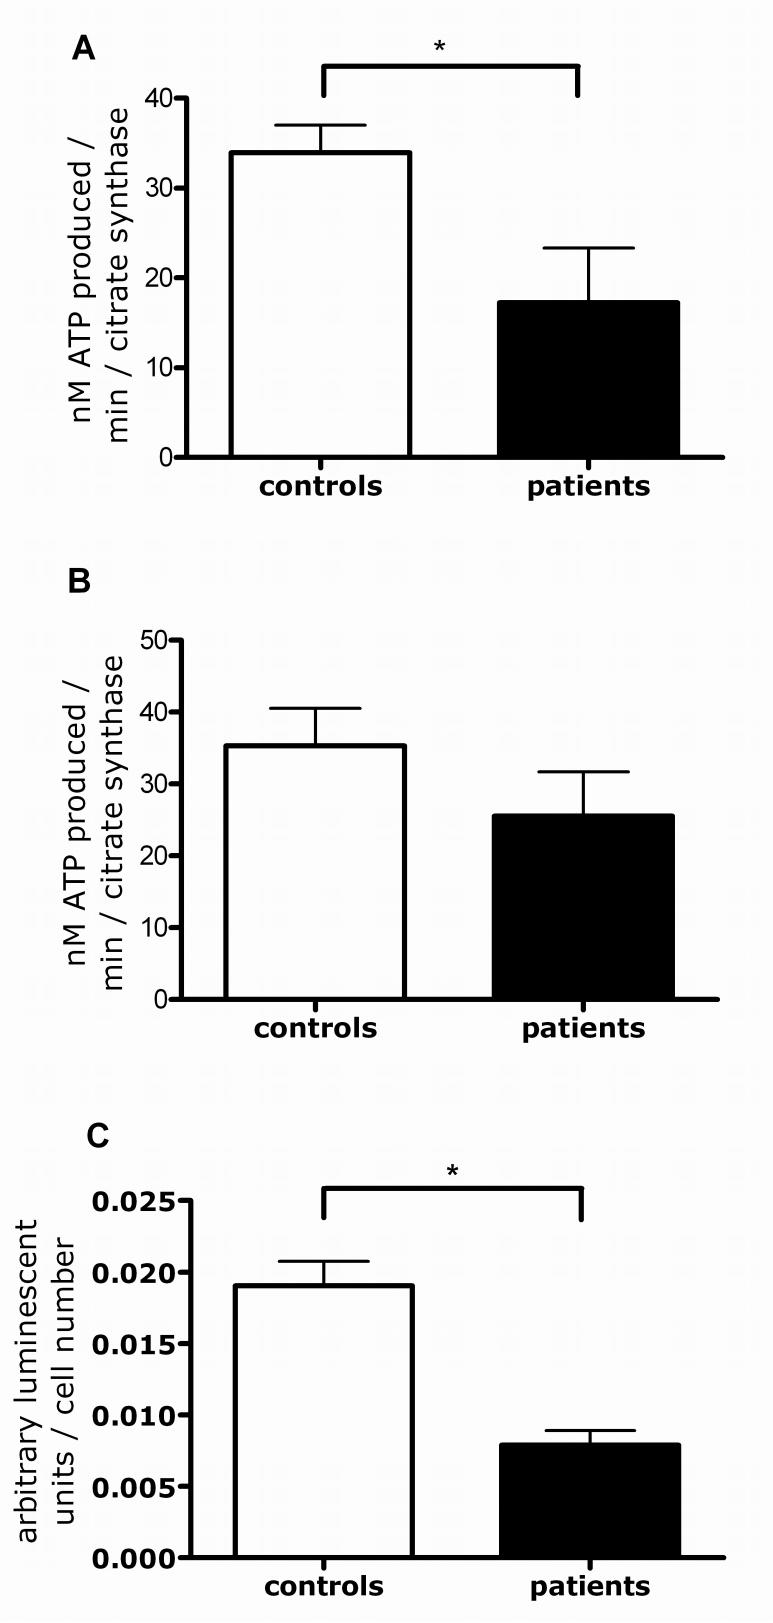
We next determined whether the observed complex I deficiency leads to overall impaired mitochondrial ATP production or to impairment of complex I-linked ATP production only. ATP production was lower after specific substrates (glutamate and malate) for complex I (p < 0.05; Fig. 2A), but not complex II (succinate) were added (Fig. 2B). The lower complex I-linked ATP production also results in an overall decrease of cellular ATP levels by 58% in the parkin mutant fibroblasts (Fig. 2C; p < 0.05).
Figure 2.
ATP production in controls and parkin mutant fibroblasts. (A) Complex I linked ATP production was reduced in the patient group by 48%, * p < 0.05. (B) In contrast, complex II linked ATP production was not significantly altered between the control and patient groups. (C) The reduction in the complex I linked ATP production also led to an overall reduction in cellular ATP levels by 58%, * p < 0.05.
Mitochondrial morphology is significantly altered in parkin mutant fibroblasts
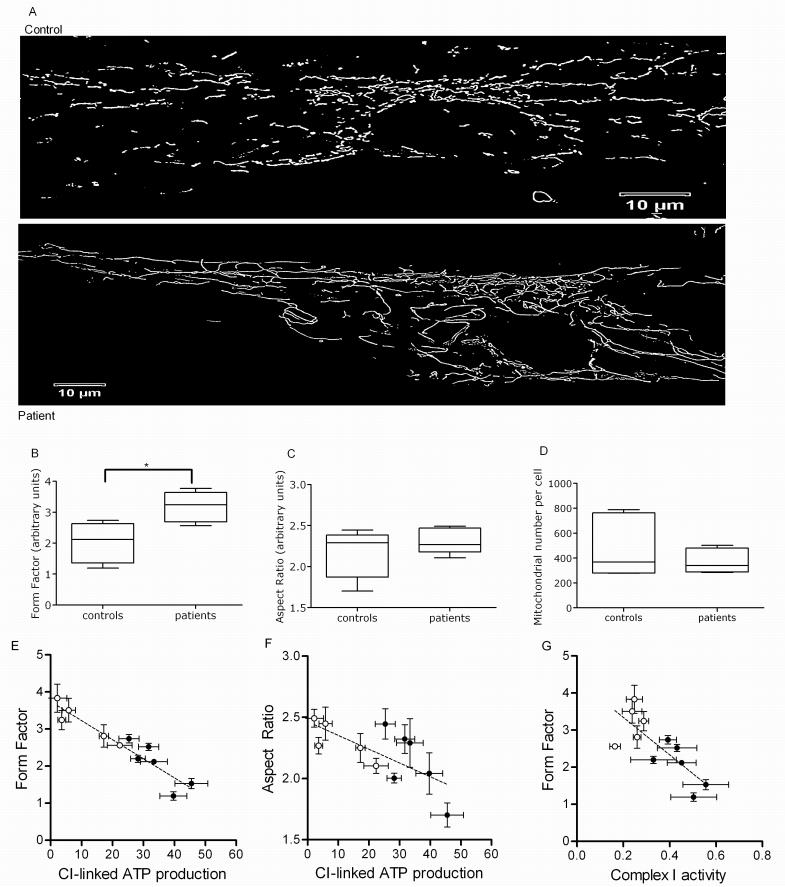
Qualitative assessment in individual parkin mutant patients revealed an at times rather marked increase in mitochondrial branching (Fig. 3A) which was confirmed using quantitative morphological analysis of the parkin mutant patient cohort (form factor, p < 0.05, Fig. 3B), without a significant group change in mitochondrial length (aspect ratio, p > 0.05, Fig. 3C). The overall number of mitochondria showed a trend towards lower numbers in the parkin mutant fibroblasts, but this did not reach statistical significance (p > 0.05, Fig. 3D). The lower complex I linked ATP production correlates with an increase in both the degree of mitochondrial branching (form factor, R2 = 0.903, p < 0.001; Fig 3E) and length (aspect ratio, R2 = 0.58, p < 0.05, Fig. 3F). In addition an increase in the degree of mitochondrial branching (form factor) correlates with lower complex I activity (R2 = 0.632. p < 0.01; Fig 3G). This indicates that the functional and morphological effects of parkin deficiency on mitochondria are related to each other.
Figure 3.
Mitochondrial morphology in control and parkin mutant fibroblasts. (A) Images of mitochondria in control and patient fibroblasts, illustrating the increase in mitochondrial branching in patient cells. (B) Mitochondrial branching (form factor) is significantly increased in the patient group, * p < 0.05. Images of 25 individual cells were assessed per cell line per day and this was repeated on 3 separate occasions. Data is presented in box and whisker plot with SEM and mean. All subsequent morphological analysis was performed and is presented in the same way. (C) In contrast, mitochondrial length (aspect ratio) is similar in the control and patient group. (D) Mitochondrial number per cell is decreased by 20%, but this did not reach statistical significance, p > 0.05. (E+F) In individual patients complex I linked ATP production correlates with both mitochondrial branching (form factor, R2 = 0.903, p < 0.0001) and mitochondrial length (aspect ratio, R2 = 0.58, p < 0.05). (G) Changes in mitochondrial branching (form factor) correlate with complex I activity as well (R2 = 0.632, p < 0.01).
Parkin siRNA knockdown confirms impaired mitochondrial respiratory chain function and morphology in parkin deficiency
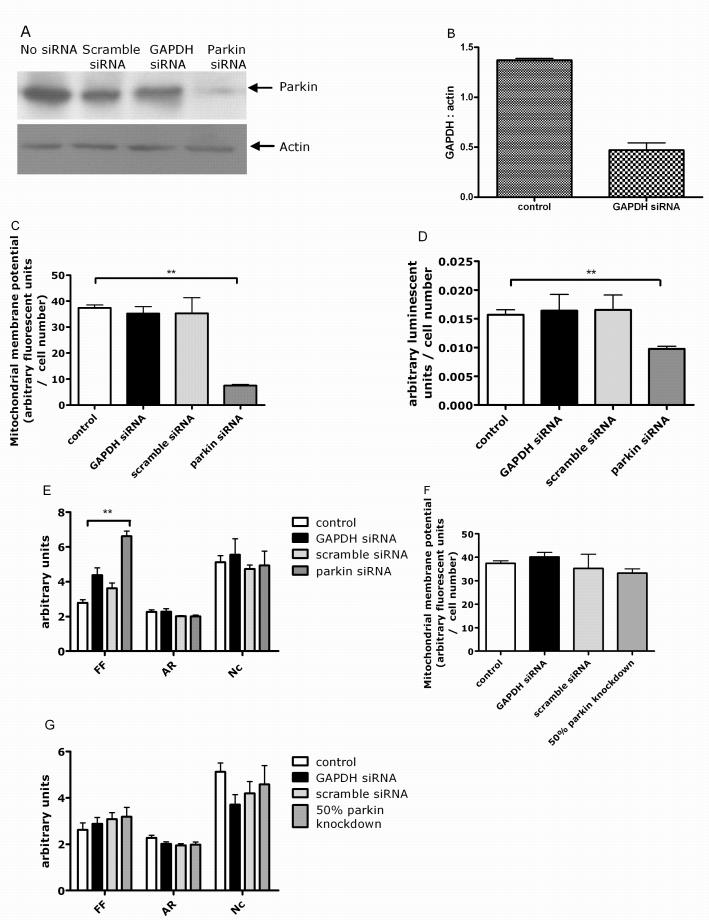
Parkin protein levels were reduced by 80% in siRNA treated control fibroblasts compared to mock transfected controls at 5 days post transfection (Fig. 4A). Mitochondrial membrane potential was significantly lower in siRNA-mediated parkin knockdown cells at 5 days post transfection (Fig. 4B, p < 0.01). Cellular ATP levels were also significantly lower in siRNA-mediated parkin knockdown cells at 5 days post transfection (Fig. 4C, p < 0.01). Parkin protein levels, mitochondrial membrane potential and cellular ATP levels returned back to control levels 9 days post transfection (data not shown).
Figure 4.
siRNA mediated knockdown of parkin in control fibroblasts. (A) Western blot of actin and parkin protein levels. Parkin protein levels are reduced by 80% after siRNA transfection. There was no change in parkin or actin protein levels in either scramble siRNA or GAPDH siRNA transfected cells. (B) siRNA knockdown of GAPDH efficiency assessed by western blotting of GAPDH protein and quantified using densitometry, showed a 70% reduction in GAPDH protein levels. (C) This siRNA mediated knockdown of parkin resulted in a decrease of the mitochondrial membrane potential by 80%, ** p < 0.01, with no effect of either scramble or GAPDH siRNA. (D) Cellular ATP levels are also reduced by 42%, ** p < 0.01, with no effect of either scramble or GAPDH siRNA. (D) Mitochondrial branching (form factor, FF) is significantly increased in siRNA parkin cells ** p < 0.01. In contrast, mitochondrial length (aspect ratio, AR) and mitochondrial number per cell (Nc) are similar in cells transfected with scramble siRNA, GAPDH siRNA or parkin siRNA. (E) 50% knockdown of parkin does not result in a change of mitochondrial membrane potential. (F) There is also no effect of 50% parkin knockdown on length (aspect ratio), branching (form factor) or number of mitochondria per cell.
We next investigated whether the changes in mitochondrial morphology observed in fibroblasts from patients with parkin mutations were also present in parkin knockdown fibroblasts. Mitochondrial branching was significantly increased by 70% (Fig. 4D, p < 0.01) in siRNA mediated parkin knockdown fibroblasts at 5 days. In contrast, there were no significant changes in mitochondrial length and number in the parkin knockdown fibroblasts. There was no effect of either scramble siRNA or GAPDH siRNA on any of the parameters measured. The siRNA mediated parkin knockdown data therefore show that parkin deficiency is sufficient to explain the mitochondrial deficiencies seen in the patient fibroblasts. In contrast, 50% knockdown of parkin, mimicking haploinsufficiency in human patient tissue, did not result in impaired mitochondrial transmembrane potential or alteration of mitochondrial morphology (Fig. 4E+F).
Parkin mutant fibroblasts are more susceptible to exposure to mitochondrial toxins
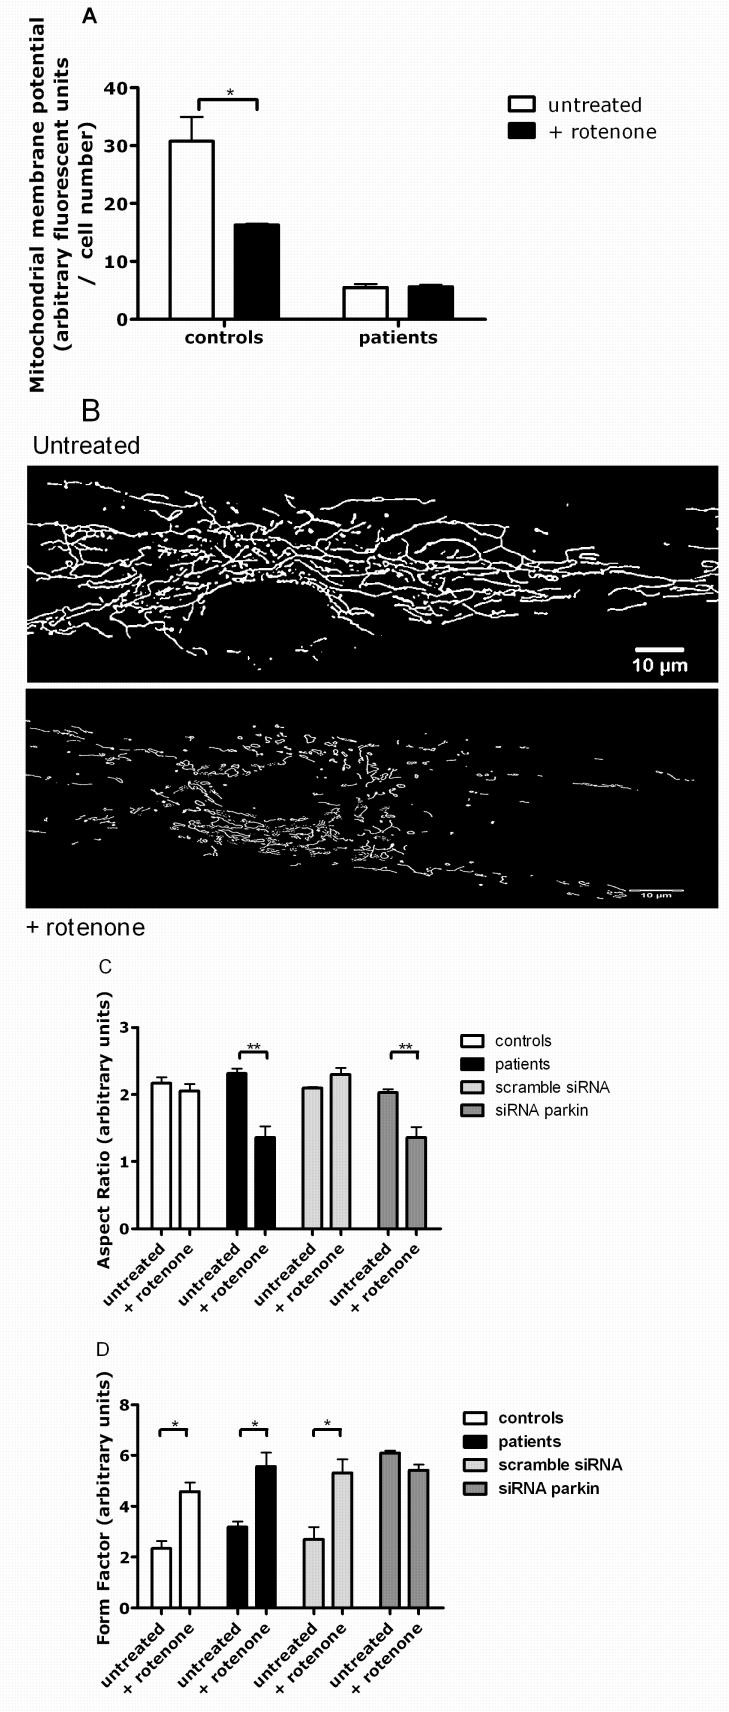
Parkin-mutant fibroblasts and control fibroblasts were then exposed to the mitochondrial complex I inhibitor rotenone to determine whether endogenous parkin has a protective effect against the effect of rotenone on mitochondrial membrane potential and mitochondrial morphology in human tissue.16 Mitochondrial membrane potential was decreased in control fibroblasts exposed to rotenone by 52%, but not in parkin-mutant fibroblasts or cells with siRNA-mediated parkin knockdown (p < 0.05; Fig. 5A). This could indicate a floor effect of our experimental protocol or that the mitochondrial membrane potential is already maximally reduced by the existing complex I defect in the parkin-mutant fibroblasts (see also Fig. 1A).
Figure 5.
The effect of rotenone treatment on control and parkin mutant fibroblasts. (A) Rotenone treatment leads to a reduction of the mitochondrial membrane potential in control cells by 54%, * p < 0.05. There was no further reduction of the already markedly lower mitochondrial membrane potential in parkin mutant cells after rotenone exposure. (B) Images of fibroblasts from parkin mutant patients before and after rotenone treatment, illustrating the reduction of absolute length of the mitochondria after toxin exposure (see also Fig 5B). (C) Mitochondrial length (aspect ratio) is shortened by 42% in parkin mutant cells after rotenone exposure, ** p = 0.01. Similar shortening of the mitochondria is observed in cells with siRNA mediated parkin knockdown after rotenone exposure, ** p = 0.01. In contrast, mitochondrial length in control fibroblasts remains unchanged after rotenone exposure. (D) Mitochondrial branching (form factor) is increased in control and patient cells after rotenone exposure (* p < 0.05) to a similar extent observed in siRNA-mediated parkin knockdown cells, which showed no further increase in branching after rotenone exposure.
Mitochondrial morphology was altered in cells exposed to rotenone, with a tendency to form short, irregularly shaped mitochondria suggesting increased fission, especially in the patient fibroblasts (Fig. 5B). To quantify these effects, we measured branching (form factor) and length (aspect ratio) in patient and control cells under basal and rotenone conditions. Rotenone exposure resulted in significantly decreased mitochondrial length in parkin-mutant fibroblasts, but not in controls (aspect ratio, p < 0.01, Fig. 5C). The reduction in mitochondrial length after rotenone exposure was confirmed in fibroblasts with siRNA mediated knockdown of parkin (p < 0.02, Fig. 5C).
Mitochondrial branching was increased by 50% in control fibroblasts exposed to rotenone (form factor, p < 0.02, Fig. 5D), resembling the extent of branching observed in mutant parkin fibroblasts under normal conditions. Mutant parkin fibroblasts also have significantly increased mitochondrial branching as compared to before rotenone treatment (Fig. 5D, p < 0.02). As described above, there was already markedly increased mitochondrial branching after siRNA-mediated parkin knock down (see Fig. 4D), comparable to the extent of branching observed in parkin mutant cells after rotenone exposure (Fig. 5D). There was no further increase in branching after rotenone exposure in the siRNA-mediated parkin knockdown cells.
Additive effect of parkin mutations and pharmacological complex I inhibition on mitochondrial functional connectivity
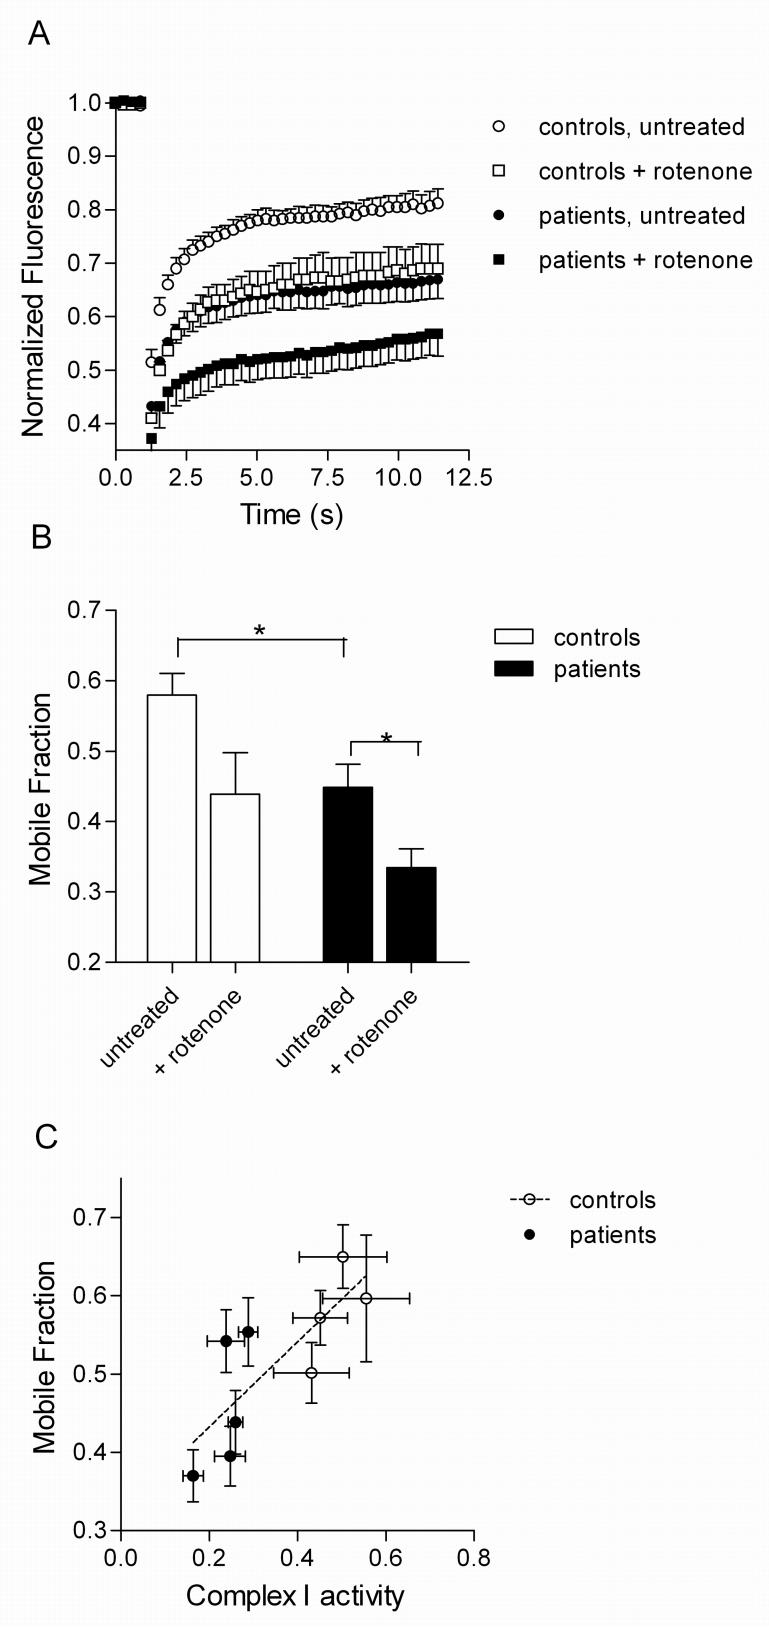
The above results suggest that parkin deficient fibroblasts have morphological alterations that are worsened by exposure to additional stressors such as rotenone. We next used the FRAP assay to further determine whether there is impairment of functional connectivity in the parkin-mutant cells. Quantification of FRAP showed that parkin deficient cells had lower recovery of mito-YFP than controls under basal conditions and even more so after rotenone exposure (Fig. 6A). To provide an overall summary measure of the FRAP results, we calculated the mobile fraction of mito-YFP over time (Fig. 6B). Using this as a metric, the effect of genotype and rotenone were both significant (two way ANOVA, Pgenotype=0.0036, Protenone=0.006). The mobile fraction values correlated with complex I activity in the cells (Fig. 6C; r=0.79, P=0.01). Overall, these results show that parkin deficient fibroblasts have a basal defect in functional connectivity that is enhanced by rotenone.
Figure 6.
Mitochondrial fission induced by rotenone is enhaned by parkin deficiency. (A) Fluoresence recovery after photobleaching (FRAP) curves in controls (n=4; open symbols) and parkin deficient cell lines (n=5 closed symbols) either without treatment (circles) or after exposure to rotenone (squares). Each point is the fluorescence intensity of mito-YFP, normalized to prebleach at the times indicated on the x-axis. (B) The fraction of mito-YFP that is mobile (mobile fraction, y-axis) is lower in parkin deficient lines (filled bars) than in controls (open bars: * p < 0.05); rotenone enhances these effects (* p < 0.05). (C) The basal defect in mobile fraction in the parkin deficient lines (filled symbols) compared to controls (open symbols) correlates with lower complex I activity (r=0.79, P=0.01). where n=3 for complex I activity and n=27-30 for mobile fraction.
Mitochondrial respiratory chain defect can be rescued in the parkin mutant fibroblasts by treatment with glutathione replacement compounds
Control and parkin-mutant fibroblasts were exposed to the glutathione precursor OTCA. A concentration response curve was performed using 24 hour treatment with OTCA (Fig. 7A). Complete recovery of mitochondrial membrane potential in parkin deficient cells was achieved with the highest dose of OTCA used (30μM). The rescue effect was concentration dependent with a calculated EC90 of 10μM which was used in all subsequent experiments.
Figure 7.
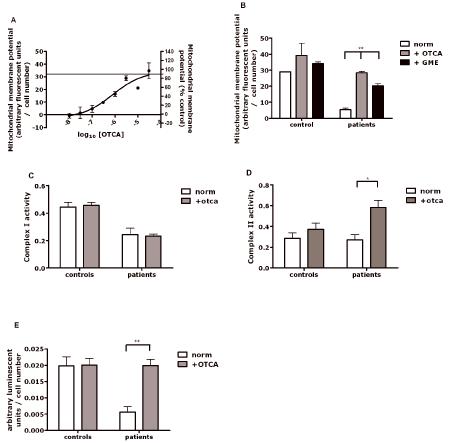
Rescue of the mitochondrial membrane potential by experimental neuroprotective compounds. (A) Concentration response curve measuring mitochondrial membrane potential in 3 different parkin mutant fibroblasts lines treated with 2-oxo-4-thiazolidine carboxylic acid (OTCA). The horizontal line marks the control values for mitochondrial membrane potential. (B) The mitochondrial membrane potential is nearly normalized (95% of controls) with treatment of OTCA. Treatment with glutathione methyl ester (GME) results in less marked (65% of controls), but still significant increase, ** p < 0.01. (C) Complex I activity is not increased after treatment with OTCA. (D) In contrast, complex II activity is increased after treatment with -oxo-4-thiazolidine carboxylic acid (OTCA) in patient cells * p < 0.05. (E) Cellular ATP levels after treatment with OTCA are significantly increased in patient cells ** p < 0.01.
Treatment of all 5 parkin mutant fibroblasts with 10μM OTCA showed improvements of mitochondrial membrane potential in every individual patient, with the average membrane potential being restored to 95% of control levels (Fig. 7B). In contrast, treatment with GME at a dose of 100μM increased the mitochondrial membrane potential to 60% of control values but could not completely replenish mitochondrial membrane potential (Fig. 7B). Similar results were obtained with higher doses of GME (data not shown). These data indicate that the observed near-complete rescue effect with OTCA may only partially be due to its effect on intracellular glutathione levels. In order to investigate the underlying mechanism of this rescue effect on the mitochondrial membrane potential by OTCA further in depth experiments were performed. Incubation of cells with 10μM OTCA did not alter mitochondrial complex I activity (Fig. 7C). In contrast, complex II activity was significantly increased (Fig. 7D). Cellular ATP levels were completely restored in all patients after treatment with 10μM OTCA (Fig. 7E). This suggests that the observed rescue effect of mitochondrial membrane potential is due to a compensatory increase in complex II activity rather than a rescue of the complex I defect.
Cell viability and cell growth are unaffected by parkin mutations
Cell viability and cell growth rates were very similar in fibroblasts from both controls and patients with parkin mutations (Cell viability - controls: 100% +/- 8.3%, mean +/- SD; parkin mutant patients 96% +/- 10.7%; cell growth — controls: 100% +/- 5.6%, parkin mutant patients: 95.4% +/- 14.3%). Furthermore, cell growth was not affected by pre-treatment of either controls or parkin-mutant patients cells with 10μM OTCA (controls: 102.3% +/- 9.6%, parkin mutant patients: 98% +/- 10.8%). Cell viability was increased in both patient and controls cells after pre-treatment with 10μM OTCA by approximately 8% (controls: 106.6% +/- 12.6%, parkin mutant patients: 104.3% +/- 18.8%), however this did not reach statistical significance (p > 0.05).
Discussion
Initial data suggested that impaired function of complex I may be limited to the substantia nigra in sporadic PD, but more recent studies have also revealed isolated complex I deficiency in the frontal cortex of PD patients.17, 18 Some studies have also reported complex I deficiency in non-neuronal tissue such as thrombocytes or muscle although results in nonneuronal tissue have not always been consistent perhaps due methodological differences.17 However, our results imply that in a genetically defined cohort of parkinsonian patients, mitochondrial deficits can be found outside of the brain. The lack of an effect of OTCA treatment on either cell growth or viability suggests that the observed rescue effect of OTCA is specific for mitochondrial function.
Mitochondrial membrane potential in parkin deficient cells was more markedly impaired if the cells were grown in galactose rather than glucose containing medium. Fibroblasts in culture generate most of their ATP via glycolysis not via oxidative phosphorylation.19, 20 By replacing glucose with galactose, however, fibroblasts can be made to rely on oxidative phosphorylation for their energy production.8
Several ubiquitin E3 ligases are known to have roles in the regulation of mitochondrial fusion and fission.14 Our results suggest that parkin also plays a role in mitochondrial dynamics, presumably related to its E3 ligase activity. We have not seen an effect of parkin deficiency on net proteasome function in these cell lines (data not shown). However, the substrate(s) of parkin that mediate mitochondrial dynamics are not known as none of the currently proposed substrates of parkin are mitochondrial. Both mitochondrial fusion and fission defects have been implicated in the pathogenesis of several neurodegenerative disorders.21 Fusion and fission facilitate exchange of lipid membranes and intramitochondrial content which is crucial for maintaining the health of mitochondria. Although our results suggest that parkin deficient cells are more prone to enter fission when stressed, it is currently unclear whether this is secondary to impaired complex I function and ATP production or a precipitating event leading to impaired mitochondrial function.22, 23
We can infer that the observed abnormalities in mitochondrial function and morphology are due to parkin deficiency because they can be replicated by transient siRNA knockdown of parkin in control lines. The lack of an effect of either scramble or GAPDH siRNA knockdown on mitochondrial function and morphology further suggests that the observed effects are specific for parkin deficiency. Of note, partial knockdown of parkin is not sufficient to result in altered mitochondrial membrane potential or morphology. This is consistent with true recessive inheritance and would not support the concept that heterozygosity for parkin is a risk factor for PD. Overall, our results are consistent with those seen in PINK1 deficient cells and suggest that there may be a common pathway mediating recessive parkinsonism in human cells as has been suggested from studies in Drosophila. 22,24-26
The only other study which had previously investigated mitochondrial respiratory chain function in parkin mutant patients described reduced activity of complex I in leukocytes, but no further information was provided on possible functional consequences of the reduced complex I activity such as global or complex I-specific ATP measurements or on mitochondrial morphology.27 Similar studies in fibroblasts from PD patients without identifiable cause have resulted in inconsistent results, which may reflect the aetiological heterogeneity of this disorder.28
All studies investigating possible neuroprotective agents for PD undertaken to date have failed to identify a drug with such an effect in human patients.29 This may at least partially be due to weaknesses of the currently used animal model systems which are frequently used to test promising compounds.30 Future trials in human PD patients investigating putative disease-modifying agents may be more successful if compounds could first be screened for their effect on mechanisms leading to PD in human tissue. Our rescue experiments provide proof of principle that skin fibroblasts from parkin mutant patients may be a suitable system to test new therapeutic approaches, at least those based on rescue of mitochondrial phenotypes, but the effect of any promising compound would obviously need to be confirmed in neuronal tissue in an appropriate animal model. Another caveat is that patients with parkin mutations have a specific, known cause for their parkinsonism, and it is therefore not certain whether the pathogenic process in parkin-mutant patients shares common features with the pathogenic process(es) leading to sporadic PD. However, there is evidence that at least some of the PD genes may be part of the same pathway leading to impaired mitochondrial function.31, 32 There is also a trend towards reduced complex I activity as well as increased production of reactive oxygen species in PINK1 mutant fibroblasts.33 Furthermore, cultivation of fibroblasts from patients with late onset, sporadic PD in the presence of coenzyme Q10 restored deficient complex I activity which was observed in nine out of 18 sporadic PD patients.28
Interestingly, the impaired mitochondrial membrane potential in the parkin-mutant cells was not normalized because of the correction of the underlying functional defect (ie complex I deficiency), but rather appears to have been due to compensatory increase of complex II activity. This suggests that any effective neuroprotective compound might not necessarily have to correct the specific defect leading to the overall disturbed function of the cell or specific cellular organelles such as the mitochondria.
Supplementary Material
Acknowledgements
Financial support from the Parkinson’s Disease Society (UK) and the Sheila McKenzie Fund of the University of Sheffield is gratefully acknowledged (HM, OB). This research was supported in part by the Intramural Research Program of the NIH, National Institute on Aging (KJT, MRC).This work was also supported by an IOP-genomics project entitled: ‘New tools for the identification of nutritional modulators of mitochondrial activity: small molecules that promote health and combat disease’ (#IGE05003, WJHK, PHGMW, JAMS).
References
- 1.Langston JW. The Parkinson’s complex: parkinsonism is just the tip of the iceberg. Ann Neurol. 2006;59:591–596. doi: 10.1002/ana.20834. [DOI] [PubMed] [Google Scholar]
- 2.Thomas B, Beal MF.Parkinson’s disease Hum Mol Genet 200716 Spec No. 2:R183–194. [DOI] [PubMed] [Google Scholar]
- 3.Lucking CB, Durr A, Bonifati V, et al. Association between early-onset Parkinson’s disease and mutations in the parkin gene. N Engl J Med. 2000;342:1560–1567. doi: 10.1056/NEJM200005253422103. [DOI] [PubMed] [Google Scholar]
- 4.Kay DM, Moran D, Moses L, et al. Heterozygous parkin point mutations are as common in control subjects as in Parkinson’s patients. Ann Neurol. 2007;61:47–54. doi: 10.1002/ana.21039. [DOI] [PubMed] [Google Scholar]
- 5.Klein C, Lohmann-Hedrich K, Rogaeva E, et al. Deciphering the role of heterozygous mutations in genes associated with parkinsonism. Lancet Neurol. 2007;6:652–662. doi: 10.1016/S1474-4422(07)70174-6. [DOI] [PubMed] [Google Scholar]
- 6.Langston JW, Tanner CM, Schule B. Parkin gene variations and parkinsonism: association does not imply causation. Ann Neurol. 2007;61:4–6. doi: 10.1002/ana.21069. [DOI] [PubMed] [Google Scholar]
- 7.Abou-Sleiman PM, Muqit MM, Wood NW. Expanding insights of mitochondrial dysfunction in Parkinson’s disease. Nat Rev Neurosci. 2006;7:207–219. doi: 10.1038/nrn1868. [DOI] [PubMed] [Google Scholar]
- 8.Hofhaus G, Johns DR, Hurko O, et al. Respiration and growth defects in transmitochondrial cell lines carrying the 11778 mutation associated with Leber’s hereditary optic neuropathy. J Biol Chem. 1996;271:13155–13161. doi: 10.1074/jbc.271.22.13155. [DOI] [PubMed] [Google Scholar]
- 9.Huang SG. Development of a high throughput screening assay for mitochondrial membrane potential in living cells. J Biomol Screen. 2002;7:383–389. doi: 10.1177/108705710200700411. [DOI] [PubMed] [Google Scholar]
- 10.Birch-Machin MA, Briggs HL, Saborido AA, et al. An evaluation of the measurement of the activities of complexes I-IV in the respiratory chain of human skeletal muscle mitochondria. Biochem Med Metab Biol. 1994;51:35–42. doi: 10.1006/bmmb.1994.1004. [DOI] [PubMed] [Google Scholar]
- 11.Shepherd D, Garland PB. The kinetic properties of citrate synthase from rat liver mitochondria. Biochem J. 1969;114:597–610. doi: 10.1042/bj1140597. [DOI] [PMC free article] [PubMed] [Google Scholar]
- 12.Manfredi G, Yang L, Gajewski CD, Mattiazzi M. Measurements of ATP in mammalian cells. Methods. 2002;26:317–326. doi: 10.1016/S1046-2023(02)00037-3. [DOI] [PubMed] [Google Scholar]
- 13.Koopman WJ, Visch HJ, Smeitink JA, Willems PH. Simultaneous quantitative measurement and automated analysis of mitochondrial morphology, mass, potential, and motility in living human skin fibroblasts. Cytometry A. 2006;69:1–12. doi: 10.1002/cyto.a.20198. [DOI] [PubMed] [Google Scholar]
- 14.Karbowski M, Neutzner A, Youle RJ. The mitochondrial E3 ubiquitin ligase MARCH5 is required for Drp1 dependent mitochondrial division. J Cell Biol. 2007;178:71–84. doi: 10.1083/jcb.200611064. [DOI] [PMC free article] [PubMed] [Google Scholar]
- 15.Bradford MM. A rapid and sensitive method for the quantitation of microgram quantities of protein utilizing the principle of protein-dye binding. Anal Biochem. 1976;72:248–254. doi: 10.1006/abio.1976.9999. [DOI] [PubMed] [Google Scholar]
- 16.Koopman WJ, Visch HJ, Verkaart S, et al. Mitochondrial network complexity and pathological decrease in complex I activity are tightly correlated in isolated human complex I deficiency. Am J Physiol Cell Physiol. 2005;289:C881–890. doi: 10.1152/ajpcell.00104.2005. [DOI] [PubMed] [Google Scholar]
- 17.Parker WD, Jr., Parks JK, Swerdlow RH. Complex I deficiency in Parkinson’s disease frontal cortex. Brain Res. 2008;1189:215–218. doi: 10.1016/j.brainres.2007.10.061. [DOI] [PMC free article] [PubMed] [Google Scholar]
- 18.Schapira AH, Cooper JM, Dexter D, et al. Mitochondrial complex I deficiency in Parkinson’s disease. Lancet. 1989;1:1269. doi: 10.1016/s0140-6736(89)92366-0. [DOI] [PubMed] [Google Scholar]
- 19.Benard G, Bellance N, James D, et al. Mitochondrial bioenergetics and structural network organization. J Cell Sci. 2007;120:838–848. doi: 10.1242/jcs.03381. [DOI] [PubMed] [Google Scholar]
- 20.Rossignol R, Gilkerson R, Aggeler R, et al. Energy substrate modulates mitochondrial structure and oxidative capacity in cancer cells. Cancer Res. 2004;64:985–993. doi: 10.1158/0008-5472.can-03-1101. [DOI] [PubMed] [Google Scholar]
- 21.Detmer SA, Chan DC. Functions and dysfunctions of mitochondrial dynamics. Nat Rev Mol Cell Biol. 2007;8:870–879. doi: 10.1038/nrm2275. [DOI] [PubMed] [Google Scholar]
- 22.Exner N, Treske B, Paquet D, et al. Loss-of-function of human PINK1 results in mitochondrial pathology and can be rescued by parkin. J Neurosci. 2007;27:12413–12418. doi: 10.1523/JNEUROSCI.0719-07.2007. [DOI] [PMC free article] [PubMed] [Google Scholar]
- 23.Greene JC, Whitworth AJ, Kuo I, et al. Mitochondrial pathology and apoptotic muscle degeneration in Drosophila parkin mutants. Proc Natl Acad Sci U S A. 2003;100:4078–4083. doi: 10.1073/pnas.0737556100. [DOI] [PMC free article] [PubMed] [Google Scholar]
- 24.Clark IE, Dodson MW, Jiang C, et al. Drosophila pink1 is required for mitochondrial function and interacts genetically with parkin. Nature. 2006;441:1162–1166. doi: 10.1038/nature04779. [DOI] [PubMed] [Google Scholar]
- 25.Abeliovich A, Beal MF. Parkinsonism genes: culprits and clues. J Neurochem. 2006;99:1062–1072. doi: 10.1111/j.1471-4159.2006.04102.x. [DOI] [PubMed] [Google Scholar]
- 26.Yang Y, Gehrke S, Imai Y, et al. Mitochondrial pathology and muscle and dopaminergic neuron degeneration caused by inactivation of Drosophila Pink1 is rescued by Parkin. Proc Natl Acad Sci U S A. 2006;103:10793–10798. doi: 10.1073/pnas.0602493103. [DOI] [PMC free article] [PubMed] [Google Scholar]
- 27.Muftuoglu M, Elibol B, Dalmizrak O, et al. Mitochondrial complex I and IV activities in leukocytes from patients with parkin mutations. Mov Disord. 2004;19:544–548. doi: 10.1002/mds.10695. [DOI] [PubMed] [Google Scholar]
- 28.Winkler-Stuck K, Wiedemann FR, Wallesch CW, Kunz WS. Effect of coenzyme Q10 on the mitochondrial function of skin fibroblasts from Parkinson patients. J Neurol Sci. 2004;220:41–48. doi: 10.1016/j.jns.2004.02.003. [DOI] [PubMed] [Google Scholar]
- 29.Suchowersky O, Gronseth G, Perlmutter J, et al. Practice Parameter: neuroprotective strategies and alternative therapies for Parkinson disease (an evidence-based review): report of the Quality Standards Subcommittee of the American Academy of Neurology. Neurology. 2006;66:976–982. doi: 10.1212/01.wnl.0000206363.57955.1b. [DOI] [PubMed] [Google Scholar]
- 30.Lang AE. Neuroprotection in Parkinson’s disease: and now for something completely different? Lancet Neurol. 2006;5:990–991. doi: 10.1016/S1474-4422(06)70605-6. [DOI] [PubMed] [Google Scholar]
- 31.Plun-Favreau H, Klupsch K, Moisoi N, et al. The mitochondrial protease HtrA2 is regulated by Parkinson’s disease-associated kinase PINK1. Nature Cell Biol. 2007;9:1243–1252. doi: 10.1038/ncb1644. [DOI] [PubMed] [Google Scholar]
- 32.Ved R, Saha S, Westlund B, et al. Similar patterns of mitochondrial vulnerability and rescue induced by genetic modification of alpha-synuclein, parkin, and DJ-1 in Caenorhabditis elegans. J Biol Chem. 2005;280:42655–42668. doi: 10.1074/jbc.M505910200. [DOI] [PMC free article] [PubMed] [Google Scholar]
- 33.Hoepken HH, Gispert S, Morales B, et al. Mitochondrial dysfunction, peroxidation damage and changes in glutathione metabolism in PARK6. Neurobiol Dis. 2007;25:401–411. doi: 10.1016/j.nbd.2006.10.007. [DOI] [PubMed] [Google Scholar]
Associated Data
This section collects any data citations, data availability statements, or supplementary materials included in this article.


