Summary
Hsp40s play an essential role in protein metabolism by regulating the polypeptide binding and release cycle of Hsp70. The Hsp40 family is large and specialized family members direct Hsp70 to perform highly specific tasks. Type I and Type II Hsp40s, such as yeast Ydj1 and Sis1, are homodimers that dictate functions of cytosolic Hsp70, but how they do so is unclear. Type I Hsp40s contain a conserved centrally located Cysteine-rich domain that is replaced by a Glycine and Methionine rich region in Type II Hsp40s, but the mechanism by which these unique domains influence Hsp40 structure and function is unknown. This is the case because high-resolution structures of full-length forms of these Hsp40s have not been solved. To fill this void we built low-resolution models of the quaternary structure of Ydj1 and Sis1 with information obtained from biophysical measurements of protein shape, small angle X-ray scattering and ab initio protein modeling. Low resolution models were also calculated for the chimeric Hsp40s YSY and SYS, in which the central domains of Ydj1 and Sis1 were exchanged. Similar to their human homologs, Ydj1 and Sis1 each has a unique shape with major structural differences apparently being the orientation of the J-domains relative to the long axis of the dimers. Central domain swapping in YSY and SYS correlates with the switched ability of YSY and SYS to perform unique functions of Sis1 and Ydj1, respectively. Models for the mechanism by which the conserved Cysteine-rich domain and Glycine and Methionine rich region confer structural and functional specificity to Type I and Type II Hsp40s are discussed.
Keywords: Hsp40, molecular chaperone, protein folding, quaternary structure, small angle scattering
Introduction
Proteins belonging to the 40 kDa heat shock (Hsp40) family protect cells from proteotoxic stress by suppressing protein aggregation and repairing stress damaged proteins 1,2. Hsp40s also play an important role in facilitating folding of nascent polypeptides, protein translocation across membrane and protein degradation 2–4. Hsp40s act through stimulating ATP-dependent polypeptide binding by Hsp70 5–8. In addition, Hsp40 proteins act independently as chaperones to bind and deliver specific clients to the Hsp70 polypeptide-binding site 9–11. The Hsp40 family is large and Hsp70 action is specified through the formation of specific pairs with different Hsp40s 3.
All members of the Hsp40 protein family contain an N-terminal J-domain that is responsible for stimulating Hsp70 ATPase activity and stabilizing complexes between Hsp70 and polypeptides 12. The J-domain was first identified in the Escherichia coli DnaJ 13, which also contains a Glycine and Phenylalanine-rich (G/F) region, a Cysteine (Cys)-rich domain and a C-terminal region. However, not all Hsp40s contain a G/F region or a Cys-rich domain and Hsp40s sub-types are sorted by the presence or absence of these motifs 3. Type I Hsp40 proteins (e.g. Escherichia coli DnaJ, Ydj1, human DJA1) contain a J-domain, the G/F region, and several Cys-rich repeats. Yet Type II Hsp40s (e.g. Sis1, human DJB4) contain a J-domain and a G/F-rich region, but a Glycine and Methionine (Gly/Met) rich region has replaced the Cys-rich domains (Fig. 1).
Figure 1. Sis1 and Ydj1 domain disposition.

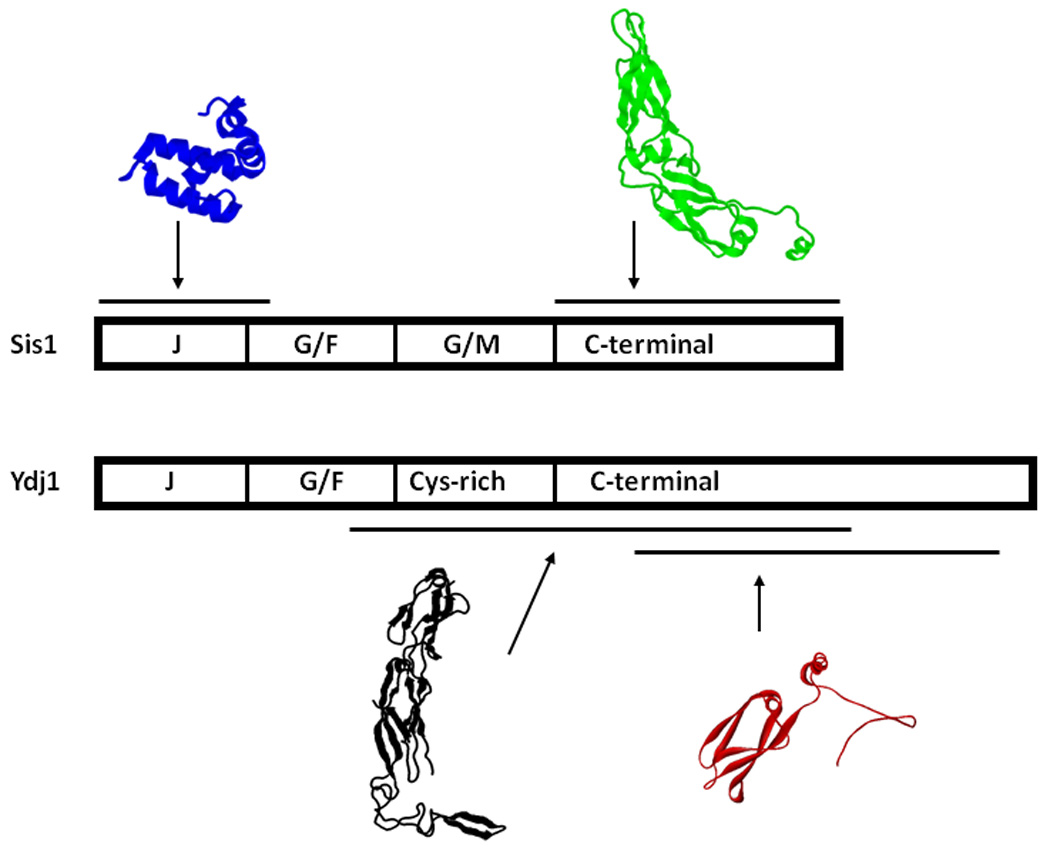
A) Homology comparison of the amino acid sequences of Sis1 and Ydj1. Domains are indicated. The alignment was done with the help of the software LALIGN 57 and information from 23. The chimeric mutants have the following structure: YSY: Ydj1 1–105, Sis1 108–257 and YdJ1 256–409; SYS: Sis1 1–121, Ydj1 101–255 and Sis1 258–352. The highly conserved tripeptide of Histidine, Proline, and Aspartic acid (HPD motif) is shown in red, the 4 repeated Cys-X-X-Cys-X-Gly-X-Gly motifs are shown in green and the Trp residues are shown in blue. B) Schematic representation of Sis1 and Ydj1 domains and known high-resolution structures. PDB accession numbers: 2O37 (blue, residues 1–81), 1C3G (green, residues 180–349 29), 1NLT (black, residues 103–350 37), 1XAO (red, residues 253–381, monomer 28).
Studies on yeast and human Hsp40s demonstrate that Type I and Type II Hsp40s stimulate Hsp70 ATPase activity to the same degree, but interact with Hsp70 to fold proteins with different efficiencies 14–17. The yeast Type I Hsp40 Ydj1 functions independent of Hsp70 to suppress protein aggregation 10, whereas the Type II Hsp40 Sis1 can hold non-native proteins in a folding competent state, but needs to interact with Hsp70 to suppress protein aggregation 16. Differences in the protein folding activity of Type I and Type II Hsp40s appear to influence the ability of Hsp70 in promoting the biogenesis of different cellular substrates.
Ydj1 assists Hsp70 in facilitating the post-translational translocation of proteins from the cytosol into organelles 18. In contrast, Sis1 is found in association with translating ribosomes and is linked to the assembly of translation initiation complexes 19. Moreover, Sis1 is an essential protein and the lethal phenotype of sis1Δ strains cannot be complemented by Ydj1 20. However, high levels of Sis1 can suppress the slow-growth phenotype of ydj1Δ 21.
In addition, Ydj1 and Sis1 are also observed to play different roles in pathways for the assembly of amyloid-like yeast prions. [URE3] is a yeast epigenetic factor that represents the infectious prion form of Ure2p 22. The [URE3] prion phenotype can be cured by the overexpression of Ydj1 23, but not Sis1. Ydj1 acts by directly binding Ure2 to inhibit amyloid fibril formation 24. In contrast, Sis1, but not Ydj1, is essential for propagation of the yeast prion [RNQ+] and Sis1 binds [RNQ+] prions to promote amyloid-like fibril formation 25,26.
To test the hypothesis that Type I and Type II Hsp40 function is specificed by the aforementioned conserved centrally located protein modules, chimeric forms of Ydj1 and Sis1, YSY and SYS, were constructed 27. The central modules of Ydj1 and Sis1 were found to be exchangeable and sufficient to specify the functions of YSY and SYS 27. The swapped central domain of Ydj1 contains a polypeptide binding site that lies adjacent to the Cys-rich domain 28. Likewise, the G/M rich region of Sis1 lies adjacent to the Sis1 polypeptide-binding site 29. Ydj1 and Sis1 exhibit overlapping substrate specificity in that both can bind peptides enriched in aromatic amino acids 27. Yet, Ydj1 and Sis1 select distinct sets of peptides from phage peptide display libraries and the binding selectivity of YSY and SYS is swapped 27. Thus, it appears that differences in substrate specificity influence the functional specificity of Type I and Type II Hsp40s. However, the mechanism for Hsp40 function is complex and factors in addition to substrate binding selectivity influence the functions of different family members 18,26,30.
A recent advance in our understanding of Type I and Type II Hsp40 function comes from low resolution models of the quaternary structure of full length forms of the human Type I Hsp40 DJA1 and the Type II Hsp40 DJB4 31. These models depict Type I and Type II Hsp40s as homodimers that have noticeably different quaternary structures: DJA1 contains two fairly asymmetrical monomers occupying an elongated conformational space. DJB4 was reported as having N-termini with a different arrangement than DJA1 in which the J-domains pointed away from the compact C-termini core responsible for dimerization 31. The structures of the region that bind peptides in Type I and Type II Hsp40s are very similar and do not appear to influence the shape of Hsp40s. Therefore, we reasoned that the Cys-rich region and Gly/Met domain that are adjacent to the polypeptide binding sites of Type I and Type II family members act to control aspects of Hsp40 quaternary structure.
To define the features that control the quaternary structures of Type I and Type II Hsp40s we performed SAXS and analytical ultracentrifugation analysis on Ydj1, Sis1, YSY, and SYS. Our findings demonstrate that the quaternary structures of Type I and Type II Hsp40s are conserved from yeast to humans. In addition, we showed that the YSY and SYS chimeras, which contained swapped central modules and function, also presented exchanged quaternary structure. These results indicate that Type I and Type II Hsp40s have different quaternary structures that are regulated by the Cys-rich region and Gly/Met-rich region unique to each Hsp40 sub-type.
Results
Protein preparation and spectroscopic analysis
Ydj1, Sis1, YSY and SYS were overexpressed in E. coli and purified from the supernatant of cell extracts. Then we carried out a biophysical characterization of the basic properties of these Hsp40s. Circular dichroism (Fig. 2A) and gel filtration chromatography (data not shown) showed that these proteins behaved as a single species and were properly folded (Fig. 2A). Emission fluorescence spectroscopy was used to access the environment of Trp residues and as probe for local folding (Fig. 2B and Table 1). Sis1 has one Trp at position 224 and Ydj1 has one Trp at position 292, and due to the shuffling construction SYS has none and YSY has two Trp residues, both from Sis1 and Ydj1, at positions 223 and 292, respectively (Fig. 1A). The emission fluorescence spectrum of Sis1 had a maximum intensity at 344 nm with center of mass of 353 nm (Fig. 2B and Table 1) indicating that the Trp was mainly exposed to the solvent. The emission fluorescence spectrum of Ydj1 had a maximum intensity at 330 nm with center of mass of 341 nm (Fig. 2B and Table 1) indicating that the Trp was well buried. Curiously, the emission fluorescence spectrum of YSY had a maximum intensity at 338 nm with center of mass of 349 nm (Fig. 2B and Table 1). Since the observed fluorescence spectrum is a sum of each Trp fluorescence spectrum, the emission spectrum of YSY reflects the average evaluation of each Trp environment. We suggest that YSY W223 was the residue exposed to the solvent and YSY W292 was the residue buried, however further experimental evidence is necessary to prove it.
Figure 2.
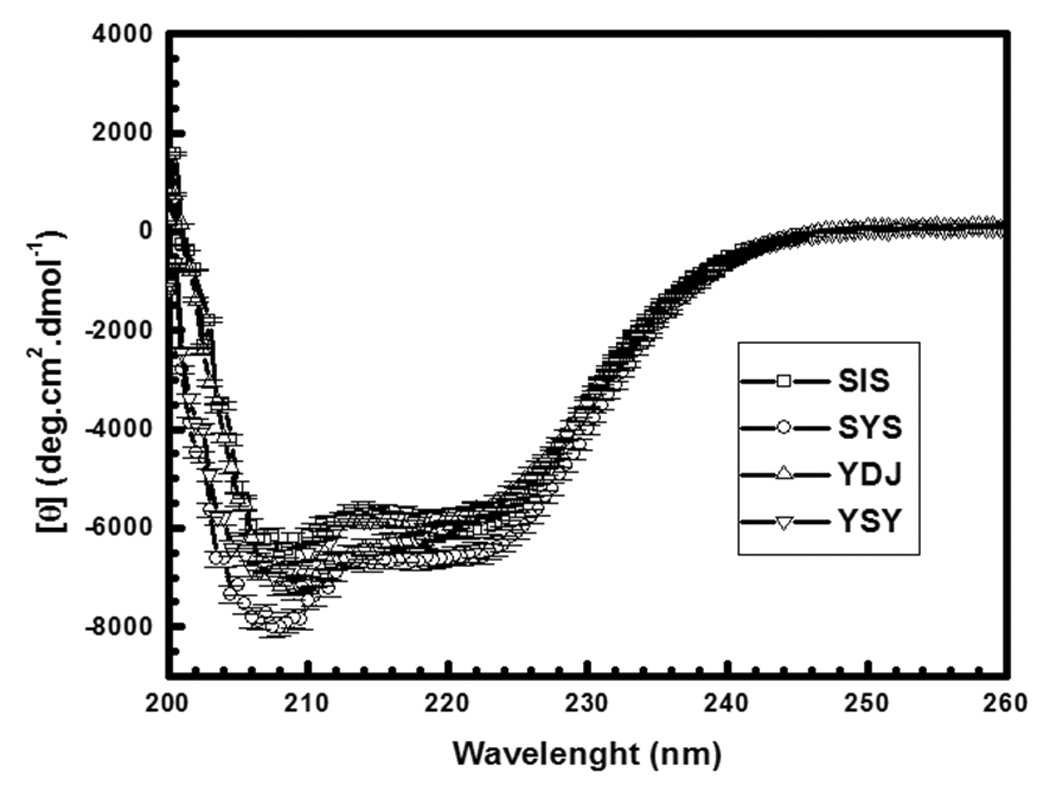
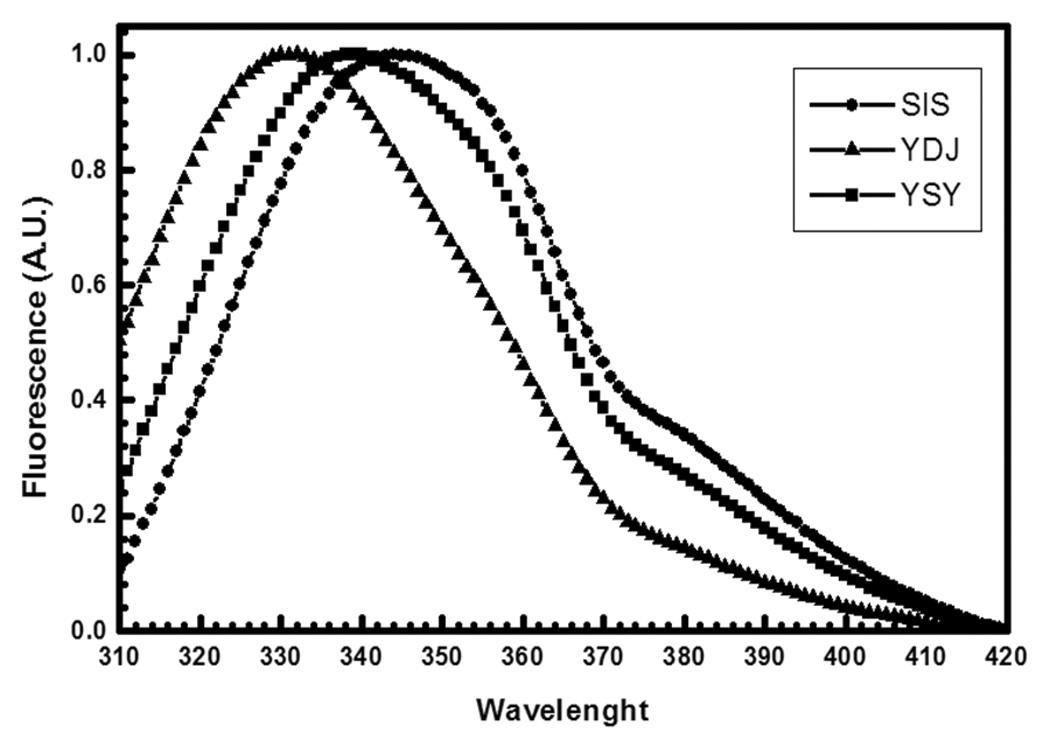
A) Circular dichroism spectroscopy. CD spectra were recorded with a Jasco spectropolarimeter (Model J-810) with temperature controlled by a Peltier Type Control System PFD 425S. The data were collected from 260 nm to 200 nm and accumulated 16–25 times. The resultant spectra corresponded to that of folded proteins. B) Emission fluorescence spectroscopy. Emission fluorescence spectra were measured with an Aminco Bowman® Series 2 (Slm-Aminco) fluorimeter. A.U., arbitrary units. The emission fluorescence spectrum of Sis1 had a maximum intensity at 344 nm with center of mass of 353 nm. The emission fluorescence spectrum of Ydj1 had a maximum intensity at 330 nm with center of mass of 341 nm. The emission fluorescence spectrum of YSY had a maximum intensity at 338 nm with center of mass of 349 nm. Ydj1 is labeled YDJ and Sis1 is labeled as SIS.
Table 1.
Biophysical parameters.
| Sis1 | Ydj1 | YSY | SYS | |
|---|---|---|---|---|
| Emission fluorescence maximum wavelength (nm) |
344+/−1 | 330+/−1 | 338+/−1 | - |
| Emission fluorescence spectral center of mass (nm) |
353+/−1 | 341+/−1 | 349+/−1 | - |
| s020,w (S) AUCa | 3.46+/−0.13 | 4.57+/−0.22 | 3.40+/−0.19 | 4.65+/−0.20 |
| Radius of gyration (Å) SAXSb | 51+/−2 | 60+/−2 | 50+/−2 | 54+/−1 |
| Maximum dimension (Å) SAXSb |
~200 | ~220 | ~190 | ~200 |
| Molecular mass (kDa) SAXSb | ~36 | ~47 | ~50 | ~55 |
| Molecular mass (kDa) predictedc |
37.6 | 44.7 | 43.8 | 40.4 |
AUC, from analytical ultracentrifugation
SAXS, from small angle X-ray scattering
for a dimer from the amino acid content.
Anaylsis of the shape of chimeric Hsp40s by analytical ultracentrifugation
The molecular mass and shape of Ydj1 and Sis1 were compared to that of YSY and SYS in sedimentation velocity experiments 32–34 (and references therein). The standard sedimentation coefficients (s20w) for Hsp40s at different concentrations was used to estimate the s20w at 0 mg/ml protein concentration (s0,20w) by extrapolation (Fig. 3). This procedure minimizes interference caused by temperature, viscosity solution, and molecular crowding. Therefore, the values obtained for s0,20w can be used to compare one yeast Hsp40 protein with the other and with the human Hsp40 proteins 31. The results obtained were: Ydj1 had s0,20w of 4.57+/−0.22 S; Sis1 had s0,20w of 3.46+/−0.13 S; SYS had s0,20w of 4.65+/−0.20 S; and YSY had s0,20w of 3.40+/−0.19 S (Table 2). As expected for proteins with homologous function, the data obtained for the yeast Type I Ydj1 and Type II Sis1, were in good agreement with those previously determined for the human Type I DJA1 ( s0,20w of 4.63 S) and Type II Hsp40 DJB4 (s0,20w of 3.78 S) 31. Importantly, the chimeric mutants SYS and YSY had s0,20w similar to those of Ydj1 and Sis1, respectively (Table 2).
Figure 3. Sedimentation velocity experiments.
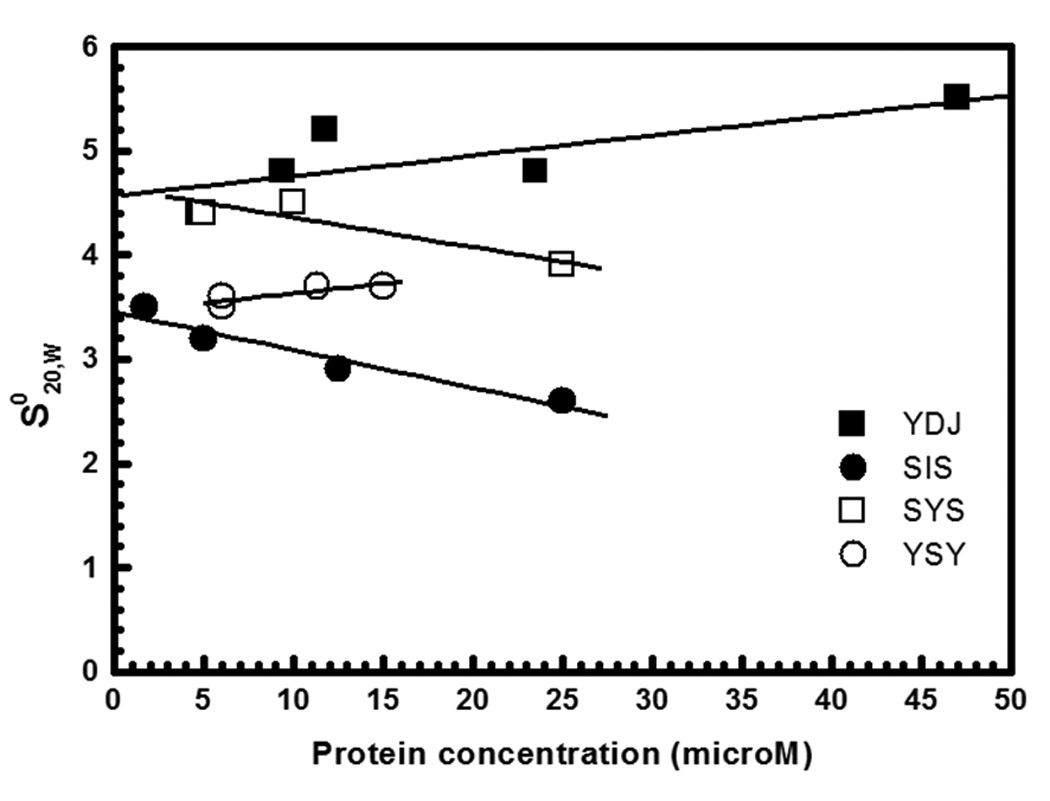
Sedimentation velocity experiments were carried out at 6 °C, 25,000 and 30,000 rpm (AN-60Ti rotor), with the scan data acquisition at 230–280 nm. Proteins were tested in concentrations of 3 to 25 µM in 25 mM Tris-HCl buffer, pH 7.5, containing 500 mM NaCl. The figure shows plots of s20,w versus protein concentrations fitted with a straight line to calculate the s020,w. Ydj1 had s0,20w of 4.57+/−0.22, Sis1 of 3.46+/−0.13, SYS of 4.65+/−0.20, and YSY of 3.40+/−0.19. Ydj1 is labeled YDJ and Sis1 is labeled as SIS.
Analysis of the Type I and Type II Hsp40 quaternary structure by small-angle X-ray scattering (SAXS)
SAXS experiments provide data that allow the calculation of a protein radius of gyration (Rg) and maximum diameter (Dmax) from which its overall shape can be inferred. The molecular mass can also be estimated from the X-ray scattering data. The quality of the parameters provided by this technique is greatly improved by the use of a synchrotron source. The best fit of the experimental data, obtained applying Indirect Fourier Transformation (IFT) methods leads to the calculation of the pair distance distribution function p(r). This real space function, together with the Kratky plot representation of the intensity (I.q2 × q), give further information on the shape and compactness of the proteins under study.
Results from the fitted experimental intensities for the respective Type I and Type II Hsp40s are presented in Fig. 4A. The p(r) functions in Fig. 4B show estimated maximum dimensions of about 200 Å and prove that the proteins share an elongated structure. Kratky plots are presented in Figures 4C and summarized in Table 1. In addition, calculated molecular masses corresponded to dimers. Maximum dimensions of nearly 200 Å can also be estimated from the p (r) functions. Differences in the values of the radius of gyration and in the profile of the p(r) functions indicated distinct conformational shapes.
Figure 4. Small-angle X-ray scattering data and calculations.
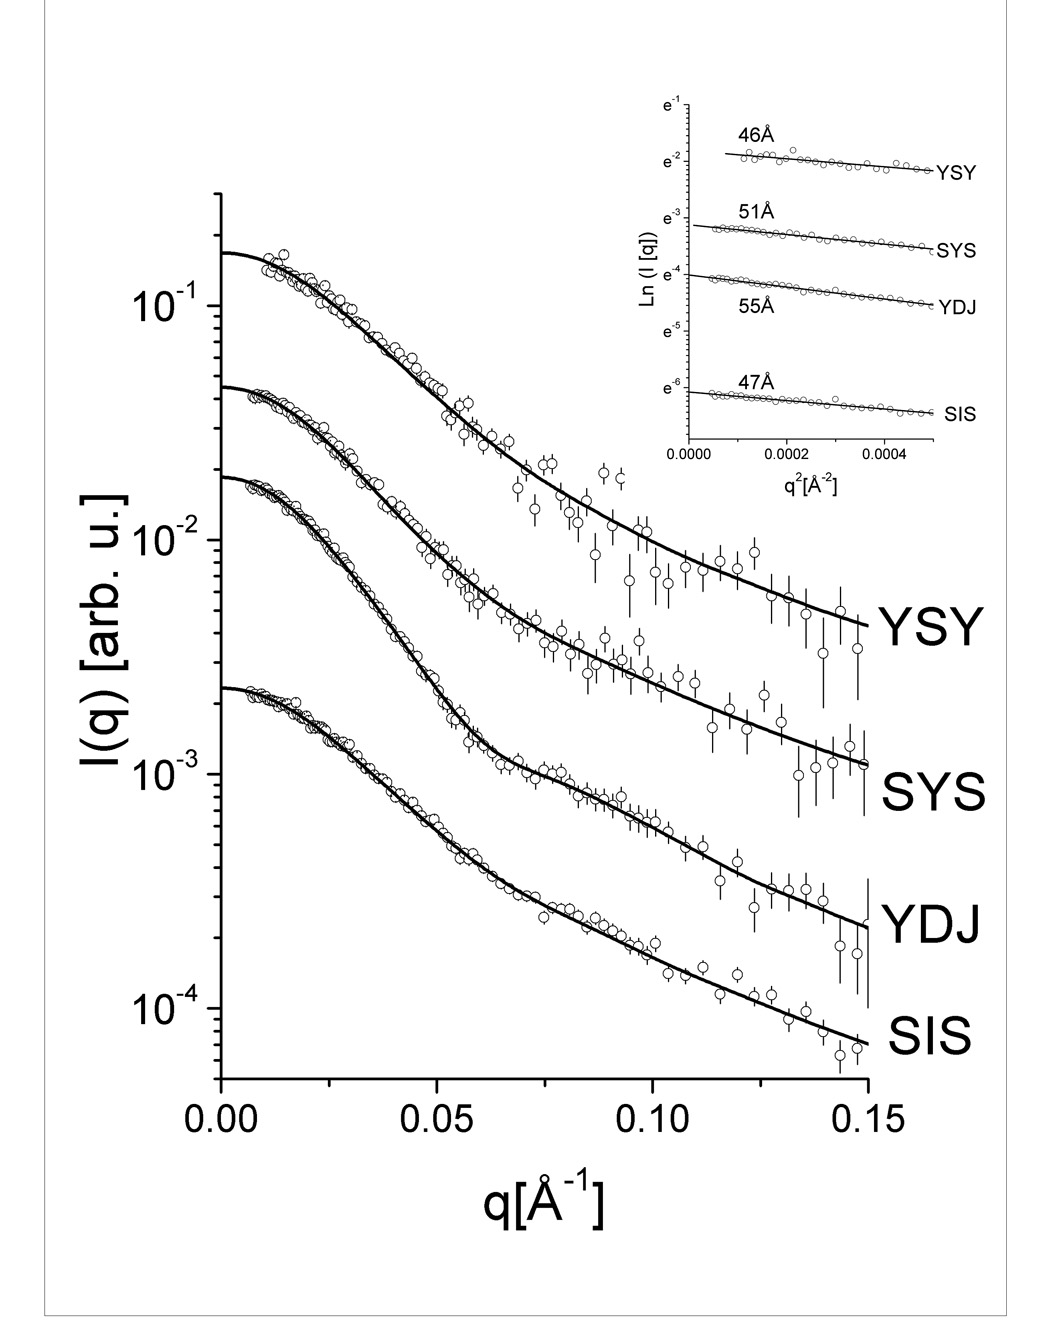

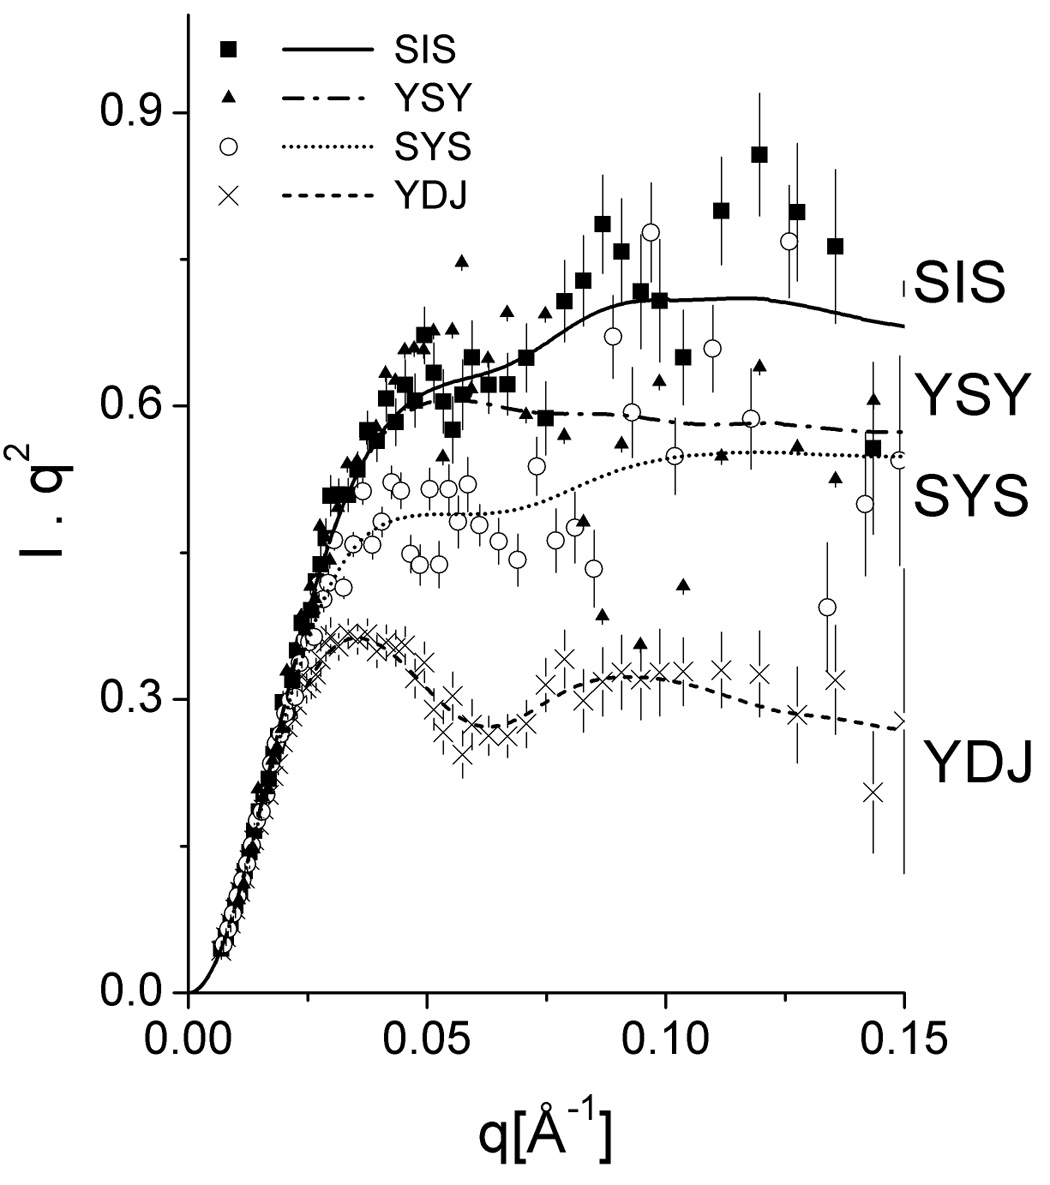
(A) Experimental scattering intensities and curve fitting performed with GNOM software. (B) Pair distance distribution functions p(r) indicating elongated shapes. (C) Kratky plots representation of the intensities. Ydj1 is labeled YDJ and Sis1 is labeled as SIS.
Low resolution three dimensional models based on the experimental data can be obtained using specific software packages containing several types of ab initio routines. Although these methods do not lead to a unique solution, the resulting molecular envelopes give a reasonable indication of the protein shape. Since shape results for the four proteins under study tended to agree with previous structural information on proteins from the Hsp40 family, the dummy atom model approach was used to generate ab-initio 3D models using a C2 symmetry constraint. The models generated by this method are represented by gray mesh in the density maps in Fig. 5 (panels A–D). In each of these panels, the fit of the low resolution models to the experimental curves is shown alongside the molecular envelope.
Figure 5. (panels A–D) Low-resolution models generated from SAXS data and molecular modeling.

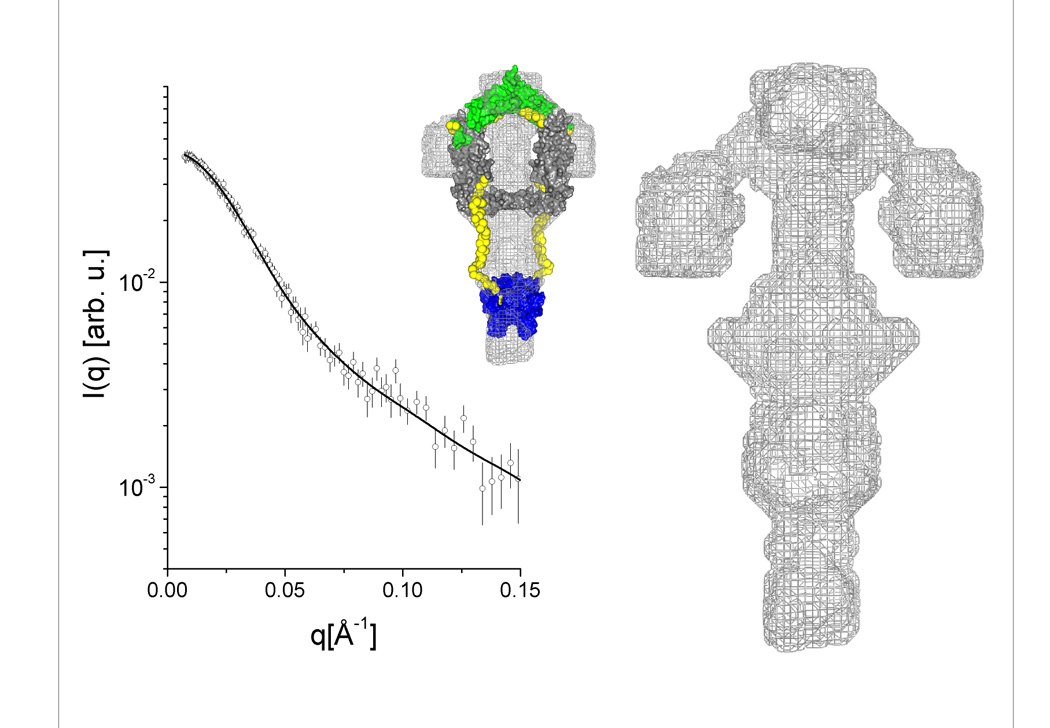
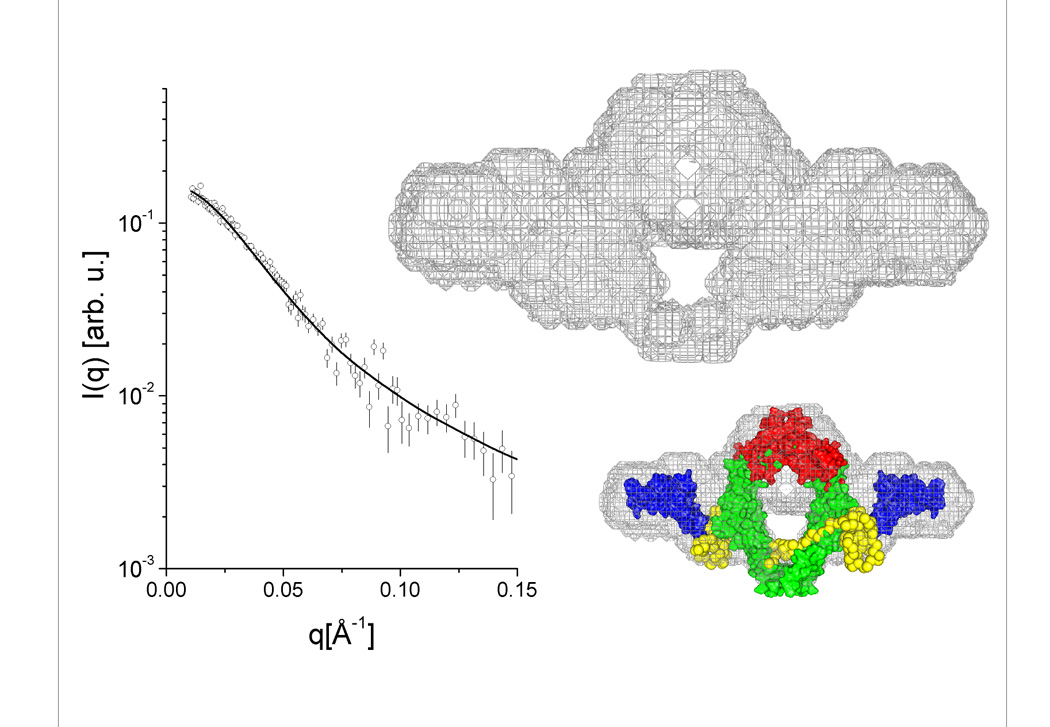
(A) Ydj1, (B) Sis1, (C) SYS, (D) YSY. Each panel shows (i) the low resolution envelope calculated using dummy atom modeling routines represented by a gray surface mesh, (ii) the calculated intensity curve for the model and its fitting to the experimental data, and (iii) the arrangement of domains of known atomic structure superimposed on the low resolution calculated envelope. See Fig. 1B for details and colors of the amino acid sequences of the chimeric mutants. The links generated to fill the gaps between the high resolution fragments are shown in yellow.
When atomic resolution structures of certain protein fragments or domains (obtained by crystallographic or NMR methods) are available, they can be aligned and superimposed on the low resolution map using rigid-body calculations. The degree of agreement between the composed domain arrangement and the molecular envelope depends, to a large extent, on symmetry conditions imposed, position constraints and resolution of the experimental data. To produce the atomic structure models that could be superimposed on the respective envelopes, the position of the high-resolution structure domains of Ydj1 or Sis1 as presented in Fig. 1 were kept fixed and the missing loops were generated. Domains were positioned using the program MASSHA 35; and a C2 axis was assumed in all cases. The missing loops connecting the high-resolution structures were generated using the program BUNCH36. These models are shown in each of the 5(A–D) panels, complementing the structural information obtained for each of the proteins studied. Although the resulting 3D models should be considered as a rough approximation of the molecular arrangement of the domains for the quaternary structure, interesting details can be inferred.
The Type I Hsp40 Ydj1 has a fairly compact structure in which two asymmetric monomers are closely assembled (as shown in panel 5A). On the other hand, Type II Hsp40 Sis1 has N-termini with a completely different arrangement in which they point away from the compact C-termini core responsible for dimerization (panel 5B). The models generated for the chimeric proteins showed that SYS had a quaternary structure similar to that of Ydj1 while YSY had a quaternary structure similar to that of Sis1 (panels 5C and 5D). These results demonstrate that the conserved central modules, which are unique to Type I and Type II Hsp40s, have a major influence on determination of Hsp40 quaternary structure. SYS contains residues 101–255 of Ydj1 flanked by residues 1–121 and 258–352 of Sis1 and has quaternary structure similar to that of Ydj1. Therefore, structural elements formed by residues 101–255 in Ydj1 have a key role in the assembly of the Ydj1 monomers and control orientation of the J domains (panel 5C). YSY contains residues 108–257 of Sis1 flanked by residues 1–105 and 256–409 of Ydj1 and has quaternary structure similar to that of Sis1. Thus, residues 108–257 of Sis1 play an important function in maintaining the quaternary structure in a format where the J domains point away from the compact C-terminal core (panel 5D). The orientation of the J-domains in both Type I and Type II Hsp40s appears dynamic.
SAXS is one of the few structural methods applicable to the study of macromolecules with various degrees of flexibility, because the total intensity results from the autocorrelation function of the particle and in this way flexible domains also contribute to the final measured X-ray scattering. So, even with the loss of information related to the orientation of the J-domain, an ensemble averaging of the particles in solution gives information about these domains that has not been accessible in previous crystallographic studies.
Discussion
The low-resolution models presented for the quaternary structures of Ydj1, Sis1, YSY and SYS demonstrate that the shape of Type I and Type II Hsp40s are very different. The chimeric Hsp40s YSY and SYS have a quaternary structure that resembles that of Sis1 and Ydj1, respectively. Since the functional specificity of YSY and SYS mimics that of Sis1 and Yd1, respectively, the domains that control the quaternary structure of Type I and Type II Hsp40 play a role in the specification of Hsp40 function.
The low-resolution models for Type I and Type II Hsp40s obtained via SAXS analysis are important because there is currently no high-resolution information on full-length forms of these proteins. The generation of these models was aided by high-resolution information on fragments of both YdJ1 and Sis1 28,29,37 (Fig 1). Since Sis1 and Ydj1 have similar structure at the C-termini and are highly identical at the J domain (Fig. 1A), the difference in quaternary structure is likely to be coded by conserved regions of lower similarity in the central modules. This hypothesis is reinforced by the results shown here, namely that switching either residues 101–255 of Ydj1 or residues 108–257 of Sis1 is enough to change the quaternary structure. The Cys-rich region in YdJ1 and the Gly/Met region in Sis1 are potential candidates to encode the information which results in different quaternary structure and hence in a difference in the relative position of the J domains.
The Cys-rich on adjacent monomers of Ydj1 may make contact with each other and thereby increase the distance between the CTDI, which contains hydrophobic depressions that are implicated in substrate binding and interaction with Hsp70 37,38. The Cys-rich region is not present in the central domain of Sis1, and its absence is likely to account for the decrease in space between CTDI on Sis1 monomers. Differences in the distance between CTDI and the J domain of Hsp40 monomers may account for some of the observed differences in chaperone function exhibited by Type I and Type II Hsp40s.
A surprising feature of the Hsp40 models generated relates to the differences in the orientation of the J-domain of Ydj1 and Sis1 relative to the long axis of the C-terminal regions in the Hsp40 dimers. The J-domain of Ydj1 is proposed to lie along the molecular long-axis, whereas the Sis1 J-domain is oriented in a crosswise direction. The ability of the J-domain to interact with Hsp70 is regulated through interaction with regulatory factors and through dimerization with pseudo-J proteins 39–42. The Ydj1 model suggests that its J-domains may form homodimers, whereas the Sis1 J-domains appear to be monomeric. Type I Hsp40s are several fold more active than Type II Hsp40s at assisting Hsp70 in refolding model proteins 43. It is therefore possible that differences in the ability of the J-domains of Ydj1 and Sis1 to interact with Hsp70 in the context of protein folding contributes to the observed differences in co-chaperone activity of Type I and Type II Hsp40s.
It is also interesting to note that fragments of E. coli DnaJ that contain the Cys-rich region are capable of directly interacting with at least some nonnative proteins 44 and the V-shaped groove present in this region seems to be involved in protein-protein interactions 45. Thus, it is possible that the Cys-rich region and the hydrophobic depressions in CTDI form a surface that contributes to the polypeptide binding activity of Type I Hsp40. The absence of such a surface in Type II Hsp40s would also help explain differences in the polypeptide binding activity of Ydj1 and Sis1. However, regulation of Hsp70 action is a complicated process and so it is likely that the shape of Type I and Type II are not the only factors that dictate Hsp40 action. It may well be that the combined action of the central modules, the J-domain and regions in the C-terminus act to specify the Hsp40 chaperone function.
Materials and Methods
Protein preparation
Cloning and purification of yeast Ydj1 and Sis1, YSY and SYS were as previously described 27. The proteins were further purified by loading them into a HiLoad Superdex 200pg 26/60 molecular exclusion column (GE Healthcare) followed by inspection by SDS-PAGE. All buffers used were of chemical grade and were filtered before use to avoid scattering from small particles. Protein concentration measurements were done by the Edelhoch procedure 46, a method that relies on the absorbance of Trp and Tyr residues of proteins unfolded by high amount of denaturant 47.
Fluorescence and circular dichroism spectroscopy
Fluorescence experiments were performed with an Aminco Bowman® Series 2 (Slm-Aminco) fluorimeter using quartz cells of 1 cm optical path length with excitation at 295 nm and bandpass of 2 nm and with emission from 310–420 nm and bandpass of 8 nm. Concentrations were 20 to 80 µM in buffer 25 mM Tris-HCl, pH 7.5, containing 500 mM NaCl. The intrinsic emission fluorescence data were analyzed either by their emission maxima wavelength or by their spectral center of mass (<λ>) as described by the equation below:
| (Equation 1) |
where λi is each wavelength and Fi is the fluorescence intensity at λI 48. All data were analyzed with the Origin software (Microcal).
CD spectra were recorded with a Jasco spectropolarimeter (Model J-810) with temperature controlled by a Peltier Type Control System PFD 425S. All spectra were taken using quartz cells of 1mm optical path length. Concentrations were 6 to 12 µM for spectra measurements and 12 to 30µM for stability measurements using buffer 25 mM Tris-HCl, pH 7.5, containing 500 mM NaCl. The data were collected from 260 nm to 200 nm and accumulated 16–25 times. Thermal-induced unfolding was performed at a scan rate of 1°C/min in buffer 25 mM Tris-HCl, pH 7.5, containin g 500 mM NaCl.
Analytical ultracentrifugation
Sedimentation velocity experiments were performed using a Beckman Optima XL-A analytical ultracentrifuge and analyzed as previously described 31,49. Briefly, sedimentation velocity experiments were performed at 6°C, at 25,0 00 and 30,000 rpm (AN-60Ti rotor), and with the scan data acquisition at 230–280 nm. Proteins were tested in concentrations of 3.0 to 25.0 µM in 25 mM Tris- HCl buffer, pH 7.5, containing 500 mM NaCl. Sedimentation velocity experiments were done to measure hydrodynamic parameters of the proteins. This analysis gives the sedimentation velocity coefficient s which is informative of the molecular mass and shape of a macromolecule. The definition of the coefficient s and molecular parameters are given by the Svedberg equation:
| (Equation 2) |
The software SedFit (Version 9.3) was used to fit the absorbance versus cell radius data. This software solves the Lamm equation in order to discriminate the spreading of the sedimentation boundary from diffusion 32,33. The software Sednterp (www.jphilo.mailway.com/download.htm) was used to estimate the protein partial specific volume at 6°C (Sis1 Vbar = 0.7284 mL/g; SYS Vbar = 0.7317 mL/g; Ydj1 Vbar = 0.7349 mL/g; YSY Vbar = 0.7309 mL/g), buffer density (ρ= 1.02118 g/mL), and buffer viscosity (η= 1.567 ×10⁻² poise). The standard sedimentation coefficient (s20w) for each protein concentration was then estimated using the following equation:
| (Equation 3) |
where T and B are experimental temperature and buffer conditions, respectively. A plot of s20w versus protein concentration is used to estimate the s20w at 0 mg/mL protein concentration (s0,20w) by extrapolation. This procedure minimizes interferences caused by temperature, viscosity solution, and molecular crowding 34.
Small angle X-ray scattering
Experiments were performed at the SAXS beamline in the Laboratório Nacional de Luz Síncrotron (LNLS), Campinas, Brazil using wavelength λ = 1.488 Å. The experimental setup included a temperature-controlled, 1 mm thick sample cell with mica windows and a linear position-sensitive detector. The samples were kept at 6°C during the exposures and data acquisition was performed by taking several 600 s frames for each sample, allowing control of possible radiation damage. The scattering intensity curves, I(q), were recorded using a linear position sensitive X-ray detector. The measured q range (q = (4π/λ)sin(θ), λ = wavelength and 2θ = scattering angle) was 0.02 Å−1 < q < 0.20 Å−1. Protein concentrations varied from 0.8 to 7.0 mg/mL. However, since highly concentrated samples showed a tendency to aggregate, only the data from more diluted samples (<3mg/ml) were used in the calculations. For these samples a series of concentrations showed that there was no aggregation or particle interaction effects on the SAXS data. Guinier plots corresponding to the intensity data used for further calculations are included as an inset in Fig. 4A. Scattering intensities were treated with the software package TRAT1D 50 including usual corrections for detector homogeneity, incident beam intensity, sample absorption, blank subtraction, and intensities average. The output of this software provided the corrected experimental intensities and error values.
Curve-fitting and desmearing of experimental effects for the data was done using the Indirect Fourier Transformation Method (IFT) included in the GNOM software package 51. This program performs the theoretical fit of the scattering intensity and also calculates the pair distance distribution function − p(r) curve. From this function we obtained the radius of gyration Rg of the scattering particle and also its particle maximum dimension Dmax. The Kratky plot (Iq 2 × q), which gives information about compactness 52 and conformational shape of a protein and domains 53, was also calculated.
Model calculations were performed to retrieve details about the protein shape and conformation by using ab initio dummy atom modeling 54 from which an approximation for the general shape of the proteins in solution was obtained. The program routine uses a spherical arrangement of close packed spherical beads and a simulated annealing optimization algorithm to search the subset of beads that provides the best fit to the experimental data.
Because ab initio SAXS modeling does not give one unique solution, we also tried to retrieve the most probable configuration of the protein structure from an average of the resulting ab initio models using the program DAMAVER 55. In this procedure the models were compared to each other by the alignment program SUBCOMP 56 and those that had high similarity were averaged. The most probable configuration was space-filled with a close packing of spheres.
The crystallographic structures of the domains (Fig.1) were positioned on the ab initio density map in a fixed location and a dimer was obtained applying a C2 symmetry. The arrangement of the regions from which high resolution structural information is missing was generated using the dummy chain model approach 36. Although intrinsically limited the structural models of these regions gave insights about the final shape of the quaternary structure.
Acknowledgements
We thank both LEC and SAS staff at LNLS for technical assistance and J. Borges for helpful discussion. Research in the laboratory of CHIR is supported by grants from Fundação de Amparo a Pesquisa do Estado de São Paulo (FAPESP), Ministério da Ciência e Tecnologia/Conselho Nacional de Pesquisa e Desenvolvimento (MCT/CNPq), and NIH-R03TW007437 funded by the Fogarty International Center. DMC is supported by the NIH.
Abbreviations used
- Hsp
heat shock protein
- SAXS
small angle X-ray scattering
- AUC
analytical ultracentrifugation
- CD
circular dichroism
- SDS-PAGE
sodium dodecil sulphate polyacrylamide gel electrophoresis
Footnotes
Publisher's Disclaimer: This is a PDF file of an unedited manuscript that has been accepted for publication. As a service to our customers we are providing this early version of the manuscript. The manuscript will undergo copyediting, typesetting, and review of the resulting proof before it is published in its final citable form. Please note that during the production process errors may be discovered which could affect the content, and all legal disclaimers that apply to the journal pertain.
REFERENCES
- 1.Cyr DM, Langer T, Douglas MG. DnaJ-like proteins: molecular chaperones and specific regulators of Hsp70. Trends Biochem. Sci. 1994;19:176–181. doi: 10.1016/0968-0004(94)90281-x. [DOI] [PubMed] [Google Scholar]
- 2.Hartl FU, Hayer-Hartl M. Molecular chaperones in the cytosol, from nascent chain to folded protein. Science. 2002;295:1852–1858. doi: 10.1126/science.1068408. [DOI] [PubMed] [Google Scholar]
- 3.Walsh P, D Bursac D, Law YC, Cyr D, Lithgow T. The J-protein family: modulating protein assembly, disassembly and translocation. EMBO Rep. 2004;5:567–571. doi: 10.1038/sj.embor.7400172. [DOI] [PMC free article] [PubMed] [Google Scholar]
- 4.Borges JC, Ramos CHI. Protein folding assisted by chaperones. Protein Pept. Lett. 2005;12:256–261. doi: 10.2174/0929866053587165. [DOI] [PubMed] [Google Scholar]
- 5.Liberek K, Marszalek J, Ang D, Georgopoulos C, Zylicz M. Escherichia coli DnaJ and GrpE heat shock proteins jointly stimulate ATPase activity of DnaK. Proc Natl Acad Sci. 1991;88:2874–2878. doi: 10.1073/pnas.88.7.2874. [DOI] [PMC free article] [PubMed] [Google Scholar]
- 6.Cyr DM, Lu X, Douglas MG. Regulation of Hsp70 function by a eukaryotic DnaJ homolog. J Biol Chem. 1992;267:20927–20931. [PubMed] [Google Scholar]
- 7.Palleros DR, Reid KL, Shi L, Welch WJ, Fink AL. ATP-induced protein-Hsp70 complex dissociation requires K+ but not ATP hydrolysis. Nature. 1993;365:664–666. doi: 10.1038/365664a0. [DOI] [PubMed] [Google Scholar]
- 8.Szabo A, Langer T, Schroder H, Flanagan J, Flanagan J, Bukau B, Hartl F-U. The ATP hydrolysis-dependent reaction cycle of the Escherichia coli Hsp70 system—DnaK, DnaJ and GrpE. Proc. Natl. Acad. Sci. 1994;91:10345–10349. doi: 10.1073/pnas.91.22.10345. [DOI] [PMC free article] [PubMed] [Google Scholar]
- 9.Langer T, Lu C, Echols H, Flanagan J, Hayer MK, Hartl FU. Successive action of DnaK, DnaJ and GroEL along the pathway of chaperone-mediated protein folding. Nature. 1992;356:683–689. doi: 10.1038/356683a0. [DOI] [PubMed] [Google Scholar]
- 10.Cyr DM. Cooperation of the molecular chaperone Ydj1 with specific Hsp70 homologs to suppress protein aggregation. FEBS Lett. 1995;359:129–132. doi: 10.1016/0014-5793(95)00024-4. [DOI] [PubMed] [Google Scholar]
- 11.Cheetham ME, Caplan AJ. Structure, function and evolutionof DnaJ: Conservation and adaption of chaperone function. Cell Stress Chap. 1998;3:28–36. doi: 10.1379/1466-1268(1998)003<0028:sfaeod>2.3.co;2. [DOI] [PMC free article] [PubMed] [Google Scholar]
- 12.Caplan AJ, Cyr DM, Douglas MG. Eukaryotic homologues of Escherichia coli dnaJ: a diverse protein family that functions with hsp70 stress proteins. Mol Biol Cell. 1993;4:555–563. doi: 10.1091/mbc.4.6.555. [DOI] [PMC free article] [PubMed] [Google Scholar]
- 13.Yochem J, Uchida H, Sunshine M, Saito H, Georgopoulos CP, Feiss M. Genetic analysis of two genes dnaJ and dnaK necessary for Escherichia coli and bacteriophage lambda DNA replication. Mol Gen Genet. 1978;164:9–14. doi: 10.1007/BF00267593. [DOI] [PubMed] [Google Scholar]
- 14.Minami Y, Höhfeld J, Ohtsuka K, Hartl FU. Regulation of the heat-shock protein 70 reaction cycle by the mammalian DnaJ homolog, Hsp40. J Biol Chem. 1996;271:19617–19624. doi: 10.1074/jbc.271.32.19617. [DOI] [PubMed] [Google Scholar]
- 15.Terada K, Kanazawa M, Bukau B, Mori M. The human DnaJ homologue dj2 facilitates mitochondrial protein import and luciferase refolding. J Cell Biol. 1997;139:1089–1095. doi: 10.1083/jcb.139.5.1089. [DOI] [PMC free article] [PubMed] [Google Scholar]
- 16.Lu Z, Cyr DM. Protein folding activity of Hsp70 is modified differentially by the hsp40 co-chaperones Sis1 and Ydj1. J Biol Chem. 1998;273:27824–27830. doi: 10.1074/jbc.273.43.27824. [DOI] [PubMed] [Google Scholar]
- 17.Meacham GC, Lu Z, King S, Sorsche rE, Tousson A, Cyr DM. The Hdj-2/Hsc70 chaperone pair facilitates early steps in CFTR biogenesis. EMBO J. 1999;18:1492–1505. doi: 10.1093/emboj/18.6.1492. [DOI] [PMC free article] [PubMed] [Google Scholar]
- 18.Caplan AJ, Tsai J, Casey PJ, Douglas MG. Farnesylation ofYDJ1p is required for function at elevated growth temperatures in Saccharomyces cerevisiae. J Biol Chem. 1992;267:18890–18895. [PubMed] [Google Scholar]
- 19.Zhong T, Arndt KT. The yeast SIS1 protein a DnaJ homolog is required for the initiation of translation. Cell. 1993;73:1175–1186. doi: 10.1016/0092-8674(93)90646-8. [DOI] [PubMed] [Google Scholar]
- 20.Luke MM, Sutton A, Arndt KT. Characterization of SIS1 a Saccharomyces cerevisiae homologue of bacterial dnaJ proteins. J Cell Biol. 1991;114:623–638. doi: 10.1083/jcb.114.4.623. [DOI] [PMC free article] [PubMed] [Google Scholar]
- 21.Caplan AJ, Douglas MG. Characterization of YDJ1: a yeas thomologue of the bacterial dnaJ protein. J Cell Biol. 1991;114:609–621. doi: 10.1083/jcb.114.4.609. [DOI] [PMC free article] [PubMed] [Google Scholar]
- 22.Wickner RB. [URE3] as an altered URE2 protein: evidence for a prion analog in Saccharomyces cerevisiae. Science. 1994;264:566–569. doi: 10.1126/science.7909170. [DOI] [PubMed] [Google Scholar]
- 23.Moriyama H, Herman K Edskes, Wickner RB. [URE3] prion propagation in Saccharomyces cerevisiae: requirement for chaperone Hsp104 and curing by overexpressed chaperone Ydj1p. Mol Cell Biol. 2000;20:8916–8922. doi: 10.1128/mcb.20.23.8916-8922.2000. [DOI] [PMC free article] [PubMed] [Google Scholar]
- 24.Lian HY, Zhang H, Zhang ZR, Loovers HM, Jones GW, Rowling PJ, Itzhaki LS, Zhou JM, Perrett S. Hsp40 interacts directly with the native state of the yeast prion protein Ure2 and inhibits formation of amyloid-like fibrils. J Biol Chem. 2007;282:11931–11940. doi: 10.1074/jbc.M606856200. [DOI] [PubMed] [Google Scholar]
- 25.Sondheimer N, Lindquist S. "Rnq1: an epigenetic modifier of protein function in yeast.". Mol Cell. 2000;5:163–172. doi: 10.1016/s1097-2765(00)80412-8. [DOI] [PubMed] [Google Scholar]
- 26.Lopez N, Aron R, Craig EA. Specificity of class II Hsp40 Sis1in maintenance of yeast prion [RNQ(1)] Mol Biol Cell. 2003;14:1172–1181. doi: 10.1091/mbc.E02-09-0593. [DOI] [PMC free article] [PubMed] [Google Scholar]
- 27.Fan CY, Lee S, Ren HY, Cyr DM. Exchangeable chaperone modules contribute to specification of type I and type II Hsp40 cellular function. Mol Biol Cell. 2004;15:761–773. doi: 10.1091/mbc.E03-03-0146. [DOI] [PMC free article] [PubMed] [Google Scholar]
- 28.Wu Y, Li J, Jin Z, Fu Z, Sha B. The crystal structure of the C-terminal fragment of yeast Hsp40 Ydj1 reveals novel dimerization motif for Hsp40. J. Mol. Biol. 2005;346:1005–1011. doi: 10.1016/j.jmb.2004.12.040. [DOI] [PubMed] [Google Scholar]
- 29.Sha B, Lee S, Cyr DM. The crystal structure of the peptide-binding fragment from the yeast Hsp40 protein Sis1. Structure. 2000;8:799–807. doi: 10.1016/s0969-2126(00)00170-2. [DOI] [PubMed] [Google Scholar]
- 30.Aron R, Lopez N, Walter W, Craig EA, Johnson J. In vivo bipartite interaction between the Hsp40 Sis1 and Hsp70 in Saccharomyces cerevisiae. Genetics. 2005;169:1873–1882. doi: 10.1534/genetics.104.037242. [DOI] [PMC free article] [PubMed] [Google Scholar]
- 31.Borges JC, Hannes F, Craievich AF, Ramos CHI. Low-resolution structural study of two human Hsp40 chaperones in solution. HJA1 from subfamily A and HJB4 from subfamily B, have different quaternary structures. J. Biol. Chem. 2005;280:13671–13681. doi: 10.1074/jbc.M408349200. [DOI] [PubMed] [Google Scholar]
- 32.Schuck P. Size-distribution analysis of macromolecules by sedimentation velocity ultracentrifugation and lamm equation modeling. Biophys. J. 2000;78:1606–1619. doi: 10.1016/S0006-3495(00)76713-0. [DOI] [PMC free article] [PubMed] [Google Scholar]
- 33.Schuck P, Perugini MA, Gonzales NR, Howlett GJ, Schubert D. Size-distribution analysis of proteins by analytical ultracentrifugation: strategies and application to model systems. Biophys. J. 2002;82:1096–1111. doi: 10.1016/S0006-3495(02)75469-6. [DOI] [PMC free article] [PubMed] [Google Scholar]
- 34.Laue TM. Biophysical studies by ultracentrifugation. Curr. Opin. Struct. Biol. 2001;11:579–583. doi: 10.1016/s0959-440x(00)00250-5. [DOI] [PubMed] [Google Scholar]
- 35.Konarev PV, Petoukhov MV, Svergun DI. MASSHA-a graphics system for rigid-body modeling of macromolecular complexes against small-angle scattering data. J. Appl. Cryst. 2001;34:527–532. [Google Scholar]
- 36.Petoukhov MV, Svergun DI. Global rigid body modeling of macromolecular complexes against small-angle scattering data. Biophys J. 2005;89:1237–1250. doi: 10.1529/biophysj.105.064154. [DOI] [PMC free article] [PubMed] [Google Scholar]
- 37.Li J, Qian X, Sha B. The crystal structure of the yeast Hsp40 Ydj1 complexed with its peptide substrate. Structure. 2003;11:1475–1483. doi: 10.1016/j.str.2003.10.012. [DOI] [PubMed] [Google Scholar]
- 38.Qian X, Hou W, Zhengang L, Sha B. Direct interactions between molecular chaperones heat-shock protein (Hsp) 70 and Hsp40: yeast Hsp70 Ssa1 binds the extreme C-terminal region of yeast Hsp40 Sis1. Biochem J. 2002;361:27–34. doi: 10.1042/0264-6021:3610027. [DOI] [PMC free article] [PubMed] [Google Scholar]
- 39.D'Silva PR, Schilke B, Walter W, Craig EA. Role of Pam16's degenerate J domain in protein import across the mitochondrial inner membrane. Proc Natl Acad Sci U S A. 2005;102:12419–12424. doi: 10.1073/pnas.0505969102. [DOI] [PMC free article] [PubMed] [Google Scholar]
- 40.Chenoweth MR, Trun N, Wickner S. In vivo modulation of a DnaJ homolog, CbpA, by CbpM. J Bacteriol. 2007;189:3635–3638. doi: 10.1128/JB.01757-06. [DOI] [PMC free article] [PubMed] [Google Scholar]
- 41.Neupert W, Herrmann JM. Translocation of proteins into mitochondria. Annu Rev Biochem. 2007;76:723–749. doi: 10.1146/annurev.biochem.76.052705.163409. [DOI] [PubMed] [Google Scholar]
- 42.Vergés E, Colomina N, Garí E, Gallego C, Aldea M. Cyclin Cln3 is retained at the ER and released by the J chaperone Ydj1 in late G1 to trigger cell cycle entry. Mol Cell. 2007;26:649–662. doi: 10.1016/j.molcel.2007.04.023. [DOI] [PubMed] [Google Scholar]
- 43.Fan C-Y, Lee S, Cyr DM. Mechanism for regulation of Hsp70 function by Hsp40. Cell Stress Chap. 2003;8:309–316. doi: 10.1379/1466-1268(2003)008<0309:mfrohf>2.0.co;2. [DOI] [PMC free article] [PubMed] [Google Scholar]
- 44.Szabo A, Korszun R, Hartl FU, Flanagan J. A zinc finger-like domain of the molecular chaperone DnaJ is involved in binding to denatured protein substrates. EMBO J. 1996;15:408–417. [PMC free article] [PubMed] [Google Scholar]
- 45.Martinez-Yamout M, Legge GB, Zhang O, Wright PE, Dyson HJ. Solution structure of the cysteine-rich domain of the Escherichia coli chaperone protein DnaJ. J Mol Biol. 2000;300:805–818. doi: 10.1006/jmbi.2000.3923. [DOI] [PubMed] [Google Scholar]
- 46.Edelhock H. Spectroscopic determination of tryptophan and tyrosine in protein. Biochemistry. 1967;6:1948–1954. doi: 10.1021/bi00859a010. [DOI] [PubMed] [Google Scholar]
- 47.Ramos CHI. A Spectroscopic-based Laboratory Course for Protein Conformational Studies. Biochem. Mol. Biol. Edu. 2004;32:31–34. doi: 10.1002/bmb.2004.494032010309. [DOI] [PubMed] [Google Scholar]
- 48.Silva JL, Miles EW, Weber G. Pressure dissociation and conformational drift of the b-dimer of tryptophan synthase. Biochemistry. 1986;25:5780–5786. doi: 10.1021/bi00367a065. [DOI] [PubMed] [Google Scholar]
- 49.Oliveira C, Borges JC, Torriani I, Ramos CHI. Low resolution structure and stability studies of human GrpE#2, a mitochondrial nucleotide exchange factor. Arch. Biochem. Biophys. 2006;449:77–86. doi: 10.1016/j.abb.2006.02.015. [DOI] [PubMed] [Google Scholar]
- 50.Oliveira CLP. “TRAT1D – Computer Program for SAXS Data Treatment”. LNLS technical Manual MT 01/2003. 2003
- 51.Svergun DI. Determination of the regularization parameter in indirect-transform methods using perceptual criteria. J. Appl. Cryst. 1992;25:495–503. [Google Scholar]
- 52.Glatter O, Kratky O, editors. Small Angle X-ray Scattering. London, UK: Academic Press; 1982. [Google Scholar]
- 53.Doniach S, Bascle J, Garel T, Orland H. Partially folded states of proteins: characterization by X-ray scattering. J. Mol. Biol. 1995;254:960–967. doi: 10.1006/jmbi.1995.0668. [DOI] [PubMed] [Google Scholar]
- 54.Svergun DI. Restoring Low Resolution Structure of Biological Macromolecules from Solution Scattering Using Simulated Annealing. Biophys. J. 1999;76:2879–2886. doi: 10.1016/S0006-3495(99)77443-6. [DOI] [PMC free article] [PubMed] [Google Scholar]
- 55.Volkov VV, Svergun DI. Uniqueness of ab initio shape determination in small-angle scattering. J. Appl. Cryst. 2003;36:860–864. doi: 10.1107/S0021889809000338. [DOI] [PMC free article] [PubMed] [Google Scholar]
- 56.Kozin MB, Svergun DI. Automated matching of high- and low-resolution structural models. J. Appl. Crystallog. 2001;34:33–41. [Google Scholar]
- 57.Huang X, Miller W. A time-efficient, linear-space local similarity algorithm. Adv. Appl. Math. 1991;12:337–357. [Google Scholar]


