Abstract
Time-resolved MRA sequences are typically characterized by the display frame rate. However, true temporal resolution should be defined in a manner analogous to spatial resolution; it is not the ability of a sequence to update rapidly but rather the ability to discern changes that occur within a small time that should characterize temporal resolution. For view-shared methods like Keyhole and TRICKS, regions of k-space from multiple time frames are combined to form a single reconstructed time frame. This often causes the time needed to acquire all k-space data points to be significantly longer than the displayed frame time, resulting in poor frequency response. Simulated here are the temporal impulse response and temporal frequency response curves of three time-resolved MRA methods including the recently introduced HYPR LR method. It is found that the HYPR LR reconstruction method exhibits a better temporal frequency response for a larger spectrum of temporal and spatial frequencies than the Keyhole and TRICKS methods.
Keywords: Keyhole, TRICKS, HYPR LR, impulse response, frequency response
Introduction
With an estimated 62 million Americans suffering from some form of cardiovascular disease, the need for safe, efficient, and accurate vascular imaging and diagnostic methods is clear. Magnetic resonance angiography (MRA) shows great promise as a non-invasive procedure for vascular imaging. However, many conventional MRA methods suffer from poor temporal resolution due to long times needed to acquire sufficient data. Several techniques have been implemented that decrease scan time by reducing the amount of k-space data acquired from each frame and by sharing data between time frames. This paper investigates the temporal resolution of three time-resolved MRA methods: Keyhole (1), Time-Resolved Imaging of Contrast Kinetics (TRICKS) (2) and Highly-Constrained Back Projection Local Reconstruction (HYPR LR) (3,4). Temporal resolution in this case is characterized by a method's capability to distinguish changes that occur within a very small period of time.
The Keyhole method takes advantage of the characteristics of regions within k-space and their different contributions to the contrast and edge sharpness of an image. Low frequency data found in the center of k-space contributes to the image contrast, while the high frequency data near the edges of k-space contribute mainly to image sharpness. Acquiring phase encode lines that contain the low frequency k-space data and zero filling the missing phase encode lines that would contain higher frequency k-space data results in a decreased acquisition time. However, the image is blurred and spatial resolution is reduced in the phase encoding direction due to a lack of phase encoded information. Keyhole attempts to remedy this by replacing the missing high frequency k-space data with data from a reference frame that collected all k-space data points. Although this can produce acceptable images, the degree of acceptability depends on the information in the reference frame. If the reference frame contains high frequency phase encodes that do not closely match the data contained in the other frames, the Keyhole method will incorrectly spread the data to all other frames, resulting in reduced temporal and spatial resolution.
TRICKS improves upon the Keyhole method while maintaining a view share technique. Rather than using k-space data from a single reference frame, TRICKS systematically acquires high frequency data throughout the acquisition albeit at a slower rate than that at which low spatial frequencies are sampled. The advantage of such an approach is that time frames can be reconstructed by linear interpolation of k-space data points from their corresponding neighboring frames. Then, each time frame has a unique high and low frequency data set.
Unlike Keyhole and TRICKS, which are both used with Cartesian acquisitions that rely on 2D inverse Fourier transforms, HYPR LR processing can be used on any time-resolved series of images. However, for this investigation, we consider an application of HYPR LR to a set of undersampled, interleaved radial acquisitions. For the HYPR LR reconstruction, all or part of the acquired data may be combined to reconstruct a composite image via filtered backprojection or regridding and an inverse Fourier transform. The composite image has high SNR and contains little, if any, streak artifacts. A series of weighting images are formed using data from each time frame; the final HYPR LR image is a multiplication of the weighting image by the composite image. HYPR LR was selected for this application over the classic HYPR algorithm because of the waveform fidelity of the former, regardless of the length of the composite image. In order for HYPR to robustly reconstruct an impulse such as the one in this investigation, the length of the composite image must be short, which would diminish the image quality and SNR afforded by a longer composite image. In contrast, waveform fidelity in HYPR LR has little dependence on the length of the composite image. This allows a longer length composite image to be used, resulting in higher SNR in the composite image, which is ultimately transferred to the final HYPR LR image.
Theory
The temporal impulse response function (IRF) shows how a system responds to an impulse signal present for only a short time constrained to a small area of impulse (AOI). The temporal Fourier transform of the IRF is called the temporal frequency response (TFR) and describes the system's response to the impulse signal in the temporal frequency domain. In this investigation, the TFR of each method was normalized to one at zero frequency.
To simulate the temporal frequency response of Keyhole, we test the case when the high spatial frequency k-space data of the reference frame contains the impulse signal. This simulates how high frequency data from the reference frame can be incorrectly spread to earlier frames. For example, this could occur in a situation with premature enhancement of veins before the arrival of contrast agent. We expect the impulse response curve to look like
| [1] |
where CH is the constant term added to every frame whose value originates from the high spatial frequency contribution of the reference frame CL results from the contributions of low spatial frequency component of the signal impulse that occurs only at time t=0, and δt,0 is the Kronecker delta. The value of the two constants CH and CL depend on the spatial frequency content of the object being imaged; smaller objects have larger CH, whereas larger objects have larger CL. It can already be seen that Keyhole responds better to objects whose CH value is small. Once normalized to one at zero frequency, the temporal frequency response function is given by
| [2] |
where N is the number of frames acquired.
For a TRICKS method with three k-space regions, three unique simulations are possible, depending on whether the signal impulse occurred during a frame that acquires the low, medium, or high spatial frequency data. To begin, the case when the impulse occurs during low frequency data sampling is considered. In this investigation, a stationary image series is used as a background for the input data; therefore except for the impulse frame, all other frames contain identical frequency information. Since the low spatial frequency data is sampled every two frames, linear interpolation approximates the frames immediately before and after the impulse as containing the original low frequency k-space data plus one half of the contribution from the impulse. The medium and high frequencies are sampled in the absence of the impulse; after interpolation, all frames in the series have the same stationary medium and high frequency content of the original time series. The values in the IRF for the frames immediately before and after the impulse are therefore equal to the IRF value for frames not containing the impulse, zero, plus one half of the intensity of a blurred impulse. The blurring is a result of the fact that only low frequency information of the impulse was sampled. For the cases in which the impulse occurs while sampling the medium and high spatial frequency content, the corresponding region is not sampled again for four time frames. Similar reasoning shows that the intensity of the reconstructed impulse in the neighboring frames decreases linearly in both directions as ¾, ½, ¼, and 0 of the reconstructed impulse. The impulse response function (IRF) is a discrete representation of
| [3] |
where ‘tri’ is a triangle function of width 2rs and rs is the sampling rate for the region being sampled when the impulse occurred; rs=2 for the low frequency region and 4 for medium or high frequency regions. The proportionality constant depends on the region being sampled during the impulse as well as the spatial frequency of the image being sampled. For example, if the impulse occurred during low frequency sampling, the proportionality constant is larger for objects with large low spatial frequency components, and small for objects with little low spatial frequency components. Conversely, if the impulse occurred during high frequency sampling, the proportionality constant is larger for objects with large high spatial frequency components and small for those with little high spatial frequency content. If the impulse response function is a triangle function, the temporal frequency response function is the discrete representation of
| [4] |
As is customary with a sinc or sinc2 function, we define the limiting temporal frequency to be 1/rs. It is now clear that the best case scenario is when the impulse occurs while sampling the low spatial frequency data, since rs is the smallest. For that reason, the TRICKS response curves in this paper were all made when the impulse was inserted during a frame that sampled the low spatial frequencies.
To estimate the impulse and frequency response functions for HYPR LR, a more comprehensive understanding of the method is required. While the original HYPR algorithm performs very well when the series of images is sparse or has high spatio-temporal correlation, corruption of local information by distant signals can occur if these conditions are not sufficiently met. HYPR LR constrains the backprojected information to local regions only, which decreases the possibility of cross talk between signals. By first reconstructing the time frame and composite images through conventional methods, such as filtered backprojection or gridding and inverse Fourier transform, projections can be made more local by reprojecting part of the data confined to local regions. Backprojecting these localized projections without filtration along lines within the local region then results in more accurate weighting images. The local projections are not limited to the same angles as the originally acquired lines of k-space. As the number of projections increases and the size of the local region decreases, the sum of the local projections is equivalent to the value obtained by convolving the image with a local uniform filter. In this limit, the HYPR algorithm approximately becomes:
| [5] |
such that IC and IW represent the composite image and the weighting image respectively, F is a convolution kernel, or low pass filter and It represents a single time frame. The size of the convolution filter is chosen to minimize artifacts due to undersampling.
Now, let us consider an idealization where the only contributing signal in all time frames is that of an impulse signal within an AOI in a single frame. The weighting functions for frames that do not contain the impulse are then zero everywhere. The impulse response function is then
| [6] |
where the only nonzero contribution is from the frame that samples the impulse signal, denoted by the Kronecker delta. The constant h<1 is a reminder that HYPR LR does not always reconstruct the impulse signal intensity fully. The temporal frequency response function is then
| [7] |
a constant value normalized to 1. The value of h is determined by many factors including, but not limited to: impulse size, impulse intensity, duration of impulse, undersampling factor and post processing. As locations outside the AOI become nonzero, we expect the impulse response function to change only minimally as long as the convolution kernel used in the weighting functions does not overlap other signal producing regions. When this occurs, signal from outside the AOI is spread into the AOI, reducing waveform fidelity. Even when this overlapping does not occur, signal outside the AOI can still influence the impulse response function by producing streak artifacts within the AOI. Thus, for frames that contain other signal producing regions, a small amount of extraneous signal may be present within the AOI due to both the filtering process and undersampling artifacts. We can then estimate the impulse response function to be
| [8] |
where the constants sn<h such that i is the number of frames, represent small contributions from streak artifacts arising from signal outside the AOI. Since these contributions are typically small, we expect the temporal frequency response function to remain approximately constant. Should a neighboring vessel be close enough to the AOI so that the convolution kernel can overlap them both at the same time, unwanted signal will be spread into the AOI, increasing the values of the constants sn. The ideal kernel will be large enough to remove all streak artifacts thereby minimizing the constant sn. However, a compromise in filter size must be made to prevent overlap between the AOI and other signal producing regions during the convolution process. Unlike TRICKS and Keyhole, our estimates for HYPR LR have no explicit spatial frequency dependencies. Instead, the dependency is hidden within the variable h, which is expected to increase when images consist mainly of low spatial frequencies.
Methods
The impulse response of each method was simulated using a set of identical 512 × 512 pixel DSA images of the brain, the current gold standard of angiography. The DSA frame provides a relatively artifact free image and serves to illustrate signal position for a contrast enhanced magnetic resonance angiography study of the head. A small 4 × 4 square area of impulse (AOI) was selected in a region so that it was surrounded by vessels on all four sides (Figure 1). This represents a difficult case for all three methods. For the two Cartesian based methods, blurring in the phase encode direction can incorrectly deposit signal within the AOI. Overlap between the surrounding signal and the AOI during HYPR LR filtering can also incorrectly deposit signal. The value within the AOI was set to about 1.4 times the maximum signal intensity in one frame for just enough time to collect 41 lines of k-space, which for a six slice study with TR = 4ms, corresponds to display frame rates of 1 second for HYPR LR acquisition, 4.2 seconds for TRICKS and 1.9 seconds for Keyhole. For all other times during the simulation, the intensity within the AOI was zero. The impulse serves as the change within a small period of time that will test a method's temporal resolution. These frames then served to simulate the input for each reconstruction method. The waveform of the average value within the AOI of the reconstructed images illustrates the impulse response function. Since the temporal frequency response for the methods depend on spatial frequency, various size AOIs were examined.
Figure 1.
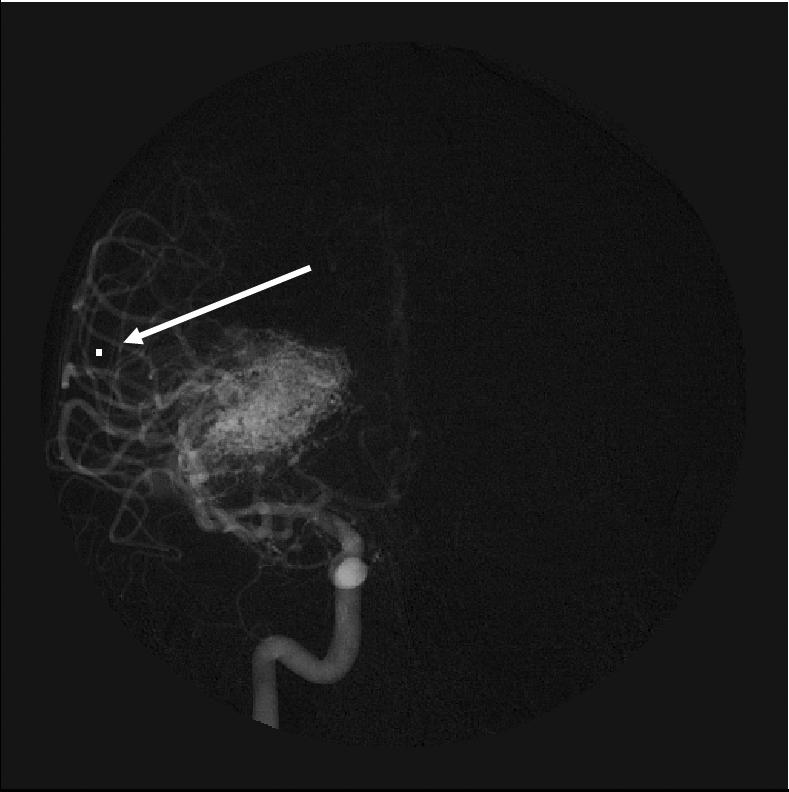
A 512 × 512 pixel DSA image of the head used as input for the simulation. This frame also shows the impulse; the area of impulse (AOI) can be seen on the left side within the vasculature.
For Keyhole simulations, only the inner 15% of k-space in the phase encoding direction in each frame was sampled, resulting in an acceleration factor of about 6.6 relative to a full Cartesian acquisition. For TRICKS, k-space was divided into three equal regions, with the low frequency component sampled twice as often as the medium and high frequency components. This results in an acceleration factor of 3 relative to a full Cartesian acquisition. HYPR LR sampled 41 angles per time frame, for an angular undersampling factor of 20 relative to the Nyquist criteria, which is an acceleration factor of almost 13 compared to a full Cartesian acquisition. HYPR LR was used with a full composite image consisting of k-space data from all time frames.
Since the impulse response function has units of [time frames] on the abscissa, a scaling factor of (seconds / time frame) is needed to convert to the customary unit of seconds. In Fourier space, the scaling for the temporal frequency response function is then the reciprocal of the scaling parameter used for the impulse response function. In this investigation, Keyhole, TRICKS and HYPR LR have update rates of 76, 170 and 41 TRs. Therefore, to account for the different sampling rates used to gather the IRF, the frequency response functions of Keyhole and TRICKS were compressed by a factor of 1.85 and 4.14 relative to that of HYPR LR.
Results
Figure 2 shows the impulse response and frequency response curves for Keyhole when a 4×4 pixel impulse signal is inserted into the AOI for one second only. Since all the k-space data was collected and used as the reference frame for high frequency k-space data during the impulse, Keyhole correctly reconstructs the impulse in that frame. However, it incorrectly inserts the high-frequency content of the impulse signal into all other frames and results in a poor frequency response curve.
Figure 2.
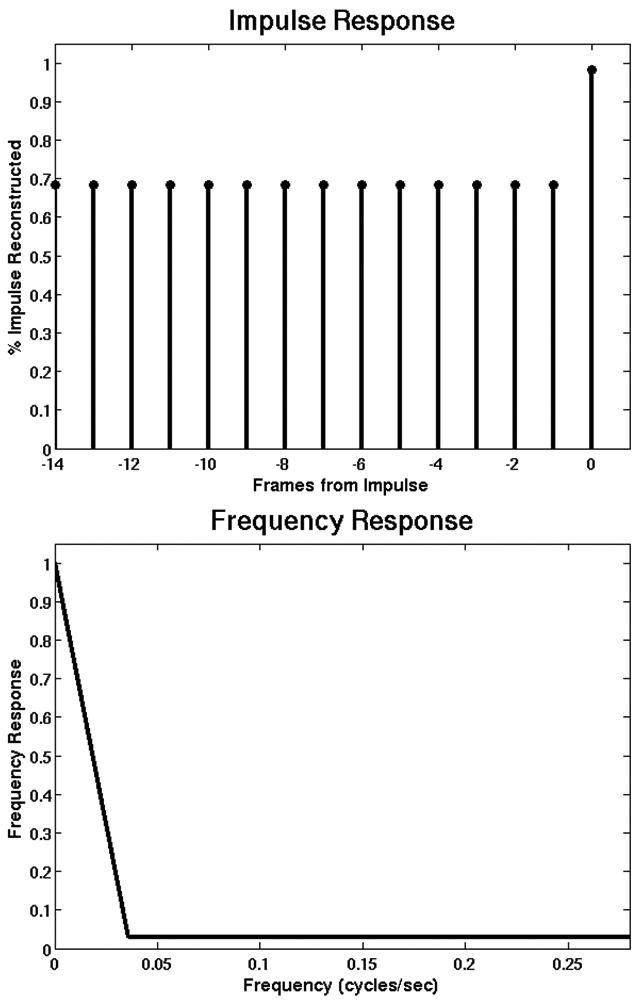
Keyhole reconstruction erroneously reconstructs approximately 70% of the impulse intensity in all frames. This leads to a frequency response that drops to near zero well before the Nyquist frequency.
Figure 3 illustrates how TRICKS responds to a 4×4 signal impulse with a duration of one second. Since that time frame only collects the low spatial frequency components of the impulse, TRICKS reconstructs the impulse to about 55% of its original intensity. Since low spatial frequency data is sampled every other frame, TRICKS interpolates between samples to fill in the missing data. As a result, the neighboring two frames both show the impulse with 27% of its original intensity. This spreading of the temporal impulse response results in the temporal frequency response curve displayed. Here the frequency response drops to zero slightly before the Nyquist frequency.
Figure 3.
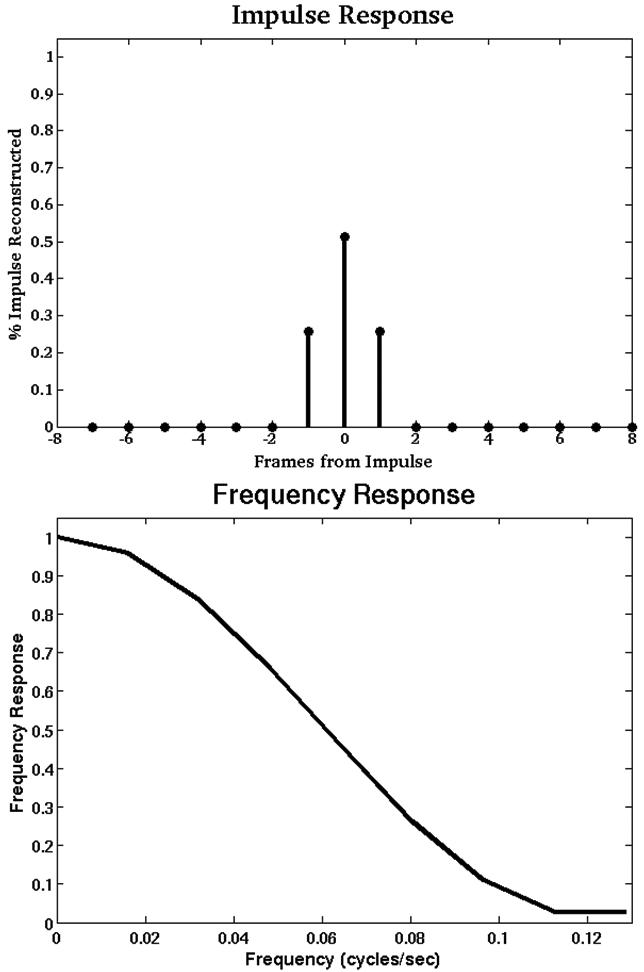
TRICKS spreads more than 25% of the signal incorrectly in only two extra time frames resulting in a sinc^2 like frequency response curve that drops to zero slightly before the Nyquist frequency.
Figure 4 shows the impulse response and frequency response curves for a 4×4 impulse signal for HYPR LR. In this simulation, all filtering was done in k-space by a radial symmetric Gaussian filter with cutoff to reduce the resolution by a factor of 5. A composite image consisting of all the k-space information was used. HYPR LR reconstructs 70% of the impulse and the remaining frames contained comparatively little signal within the AOI. Since little signal was spread to neighboring frames, the frequency response curve only drops to about 65% of the original value at the Nyquist frequency.
Figure 4.
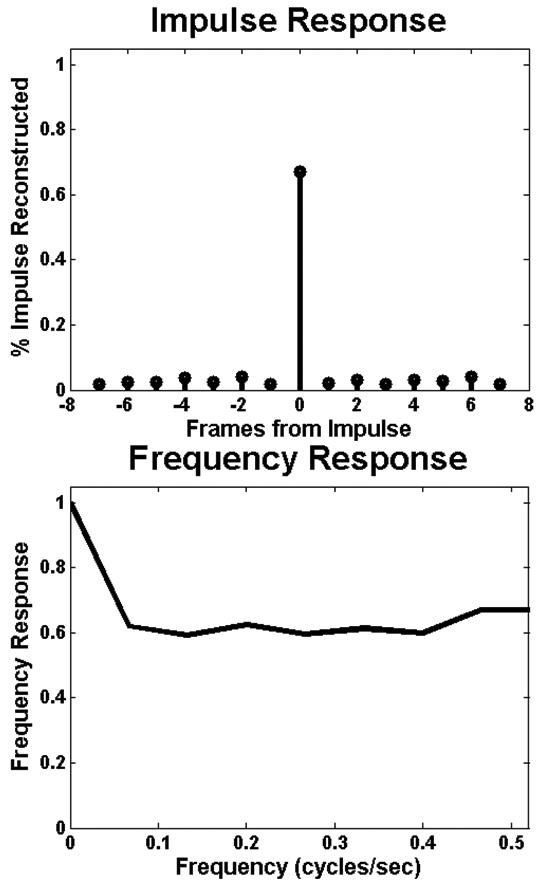
HYPR LR spreads a negligible amount of signal to neighboring time frames. The frequency response decreases only to 65% at the Nyquist frequency.
Figure 5 displays the reconstructed impulse signals, as well as the same inset for the frames prior to the impulse. Keyhole, which acquired the entire data of the impulse, reconstructs the impulse perfectly. However, the signal is spread to all other frames. Not only did Keyhole spread the signal in time, the signal was also spread spatially in the phase encoding direction, resulting in an artifact which could corrupt local vasculature. This spatial spreading also occurred in the TRICKS reconstructions, which shows a smeared impulse in both the correct frame as well as one frame before and after. The AOI reconstructed by HYPR LR is clearly visible in the correct impulse frame. Moreover, HYPR LR produced minimal spreading of the signal in both space and time as it is not visible in the neighboring frame.
Figure 5.
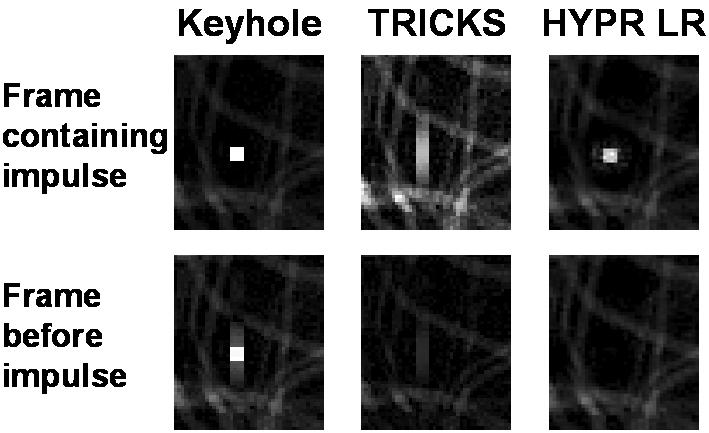
An inset of each of the reconstructed images containing the AOI is shown from one frame prior to the impulse frame as well as the frame containing the impulse. The results show the temporal spreading of signal that is characteristic of the Keyhole and TRICKS methods as well as any spatial spreading of the AOI. The HYPR LR method does not reconstruct any erroneous signal in the neighboring time frame.
An investigation of the dependency upon AOI size was also conducted. Figure 6 shows the results in a 3D plot of the frequency response for each method using AOIs of various areas. The findings for Keyhole support the theory that the method responds better to objects that have larger components of low spatial frequency. As previously stated, the TRICKS frequency response will have a sinc2-like shape. The HYPR LR plot shows a consistent frequency response for most AOI sizes. The response begins to diminish as the impulse AOI approached the size of the filtering kernel in image space and continues to fall thereafter, plummeting at a 2 × 2 AOI size.
Figure 6.
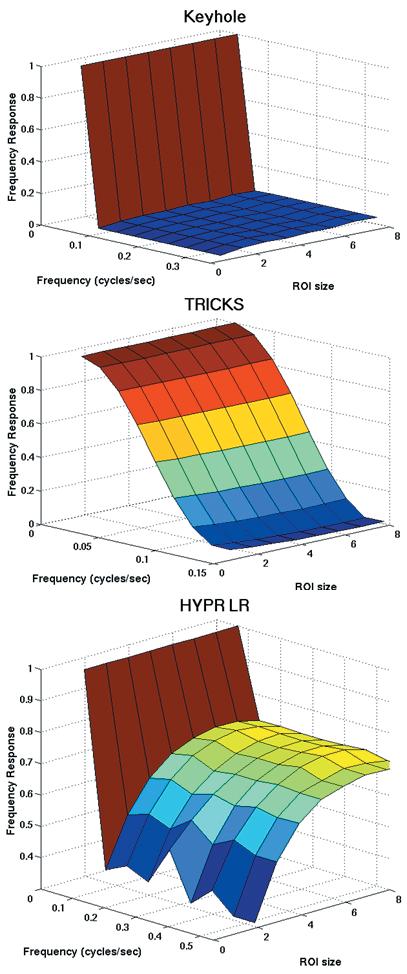
3D-plots of the frequency responses of Keyhole, TRICKS and HYPR LR when square AOIs of various side lengths are used as input.
Discussion
Although one particular MRA method may have excellent temporal resolution, it may suffer from poor spatial resolution, and vice versa. Often times, an increase of resolution in one domain results in a decrease in the other. Therefore, when comparing different methods, both the spatial and the temporal resolution must be considered.
Keyhole, which captured the high frequency content of the impulse, offered high spatial resolution for the reference frame, but suffered from poor temporal response due to the incorrect spreading of the impulse signal to all other frames. Although Keyhole reconstructed the impulse perfectly in one frame, in all other frames spatial resolution in the phase encoding direction was lost due to high frequency content that did not correspond to the low frequency content. This can reduce the ability distinguish fine arterial features when high frequency content from nearby veins is spread in the phase encoding direction. Using the display frame rate to characterize the temporal resolution for regions with large amounts of high spatial frequency content is misleading, especially for early frames where late filling vessels should not be present. The temporal resolution, as characterized by the IRF and FRF is actually worse than the display frame rate. However, in the limit of large objects, for which the high spatial frequency component is minimal, the display frame rate more closely approximates the temporal resolution. This is shown in Figure 6.
TRICKS produced moderate results for spatial and temporal resolution. In this method, the temporal spreading was limited to only the neighboring frames of the impulse. However, the intensity of the spreading was severe, reconstructing 27% of the signal intensity in the neighboring frames. Therefore, the temporal resolution is approximately three times worse than the display frame rate suggests. Similar to the above analysis for Keyhole, the temporal resolution approaches the display frame rate as the size of the signal producing objects increases. As before, spatial resolution in the phase encoding direction is lost in the absence of matching high frequency data.
HYPR LR offers both excellent temporal and spatial resolution. Although the composite image used to create the HYPR LR image contained signal that was temporally mismatched to a given time frame, HYPR LR was able to weight out the incorrect signal to values comparable to the background signal. HYPR LR's temporal resolution is limited by the number of projections needed to construct a single time frame It in Equation [5] and thus, can be characterized by the display frame rate. Furthermore, HYPR LR exhibits little spreading of the signal to neighboring pixels, maintaining nearly the full temporal resolution that the original images were acquired at
It requires mention that this simulation serves only to demonstrate the effect of an impulse signal on the different MRA techniques and to characterize the extent to which they are in fact time-resolved. In a standard clinical situation involving a MRA examination using the Keyhole method, the reference frame would be taken at the very end of the scan when only residual amounts of a contrast agent is contained within the vessels. The likelihood of capturing a large impulse signal of diagnostic value is small. Therefore, the results of this paper provide evidence that Keyhole does not perform well as a time-resolved acquisition method under all circumstances; though, the circumstances under which Keyhole degrades to the extent shown in this paper are extreme.
Although the three methods discussed above implemented in 2D for this simulation, each method can be extended to three dimensional imaging. Keyhole extends naturally to 3D, where now the inner cubical region of k-space serves as the dynamic low frequency content captured every frame. A 3D TRICKS is realized by extending the phase encodes to the extra dimension, again creating three regions characterized by low, medium, and high frequency components in the y and z directions, while reading out in the x direction. HYPR LR has two 3D possibilities currently being investigated. The first is a stack of stars (SOS) method; a series of radial acquisitions are captured in the xy plane and conventional phase encoding is performed in the z direction. The other is a true 3D radial acquisition, such as Vastly Undersampled Isotropic Projection Reconstruction (VIPR) (5).
Based on the 2D simulations, we know that the temporal frequency response of HYPR LR can be characterized as the display frame rate. Therefore, the extension from 2D to 3D is extremely advantageous since angular undersampling is more favorable in 3D than in 2D. This is because the streak artifacts fall off as 1/r2 in 3D, rather than 1/r in a 2D radial acquisition. Additionally, since three dimensional filtering can be used for processing the weighting images, streak artifacts are more effectively removed for a fixed filter size, allowing for the possibility of even larger undersampling factors. HYPR LR permits acceleration factors of 50-100 in 3D. On the other hand, the Cartesian based methods of Keyhole and TRICKS do not permit undersampling without the loss of spatial resolution. As previously discussed, in all but the extreme cases, the temporal resolution for Keyhole and TRICKS is worse than that described by the display frame rate. Since Keyhole and TRICKS both permit acceleration factors on the range of two to five in 2D, we except acceleration factors of 4 to 25 in 3D.
Conclusion
View shared methods like Keyhole and TRICKS that combine different, separately acquired regions of k-space to form an image are dependent upon the condition that the information within the different regions matches reasonably well. If this condition is not fulfilled, poor impulse and frequency responses result. HYPR LR is not a view shared method and therefore is not dependent on this condition. For this reason, the impulse response and frequency response functions of the HYPR LR method are superior to those of the other techniques tested.
Acknowledgements
We gratefully acknowledge GE Healthcare for their assistance, as well as NIH for their funding of our research. (Grant # 1R01HL72260-01)
References
- 1.van Vaals J, Brummer ME, Dixon WT, Tuithof HH, Engels H, Nelson RC, Gerety BM, Chezmar JL, den Boer JA. Keyhole Method for Accelerating Imaging of Contrast Agent Uptake. J. Magn. Reson. Imaging. 1993;3:671–675. doi: 10.1002/jmri.1880030419. [DOI] [PubMed] [Google Scholar]
- 2.Korosec F, Frayne R, Grist TM, Mistretta CA. Time-Resolved Contrast-Enhanced 3D MR Angiography. Magn. Reson. Med. 1996;36:345–351. doi: 10.1002/mrm.1910360304. [DOI] [PubMed] [Google Scholar]
- 3.Mistretta CA, Wieben O, Velikina J, Block W, Perry J, Wu Y, Johnson K, Wu Y. Highly Constrained Backprojection for Time-Resolved MRI. Magn. Reson. Med. 2006;55:30–40. doi: 10.1002/mrm.20772. [DOI] [PMC free article] [PubMed] [Google Scholar]
- 4.Wu Y, Kim N, Turski P, Mistretta CA. AV Ratio and SNR Tradeoffs for Composite Image Selection in Application of HYPR PR-TRICKS on Contrast Enhanced Cerebrovascular MRA; Proceedings of the 15th Annual Meeting of ISMRM; Berlin, Germany. 2007. Abstract 833. [Google Scholar]
- 5.Gu T, Korosec F, Block W, Fain S, Turk Q, Lum D, Zhou Y, Grist T, Haughton V, Mistretta C. PC VIPR: a high-speed 3D phase-contrast method for flow quantification and high-resolution angiography. Am J Neuroradiol. 2005;4:743–9. [PMC free article] [PubMed] [Google Scholar]


