

Abstract
Background
We introduce locally-smoothed (LS) median absolute difference (MAD) curves for the evaluation of hospital point-of-care (POC) glucose testing accuracy.
Methods
Arterial blood samples (613) were obtained from a university hospital blood gas laboratory. Four hospital glucose meter systems (GMS) were tested against the YSI 2300 glucose analyzer for paired reference observations. We made statistical comparisons using conventional methods (e.g., linear regression, mean absolute differences).
Results
Difference plots with superimposed ISO 15197 tolerance bands showed bias, scatter, heteroscedasticity, and erroneous results well. LS MAD curves readily revealed GMS accuracy patterns. Performance in hypoglycemic and hyperglycemic ranges erratically exceeded the recommended LS MAD error tolerance limit (5 mg/dl). Some systems showed acceptable (within LS MAD tolerance) or nearly acceptable performance in and around a tight glycemic control (TGC) interval of 80-110 mg/dl. Performance patterns varied in this interval, creating potential for discrepant therapeutic decisions.
Conclusions
Erroneous results demonstrated by ISO 15197-difference plots must be carefully considered. LS MAD curves draw on the unique human ability to recognize patterns quickly and discriminate accuracy visually. Performance standards should incorporate LS MAD curves and the recommended error tolerance limit of 5 mg/dl for hospital bedside glucose testing. Each GMS must be considered individually when assessing overall performance for therapeutic decision making in TGC.
Keywords: Bland-Altman, bandwidth, bracket predictive value, error tolerance, ISO 15197, tight glucose control (TGC)
Introduction
Our goals are: a) to introduce locally-smoothed (LS) median absolute difference (MAD) curves, a new pattern recognition technique for the evaluation of point-of-care (POC) glucose testing performance; b) to harmonize this visual approach with tight glucose control (TGC) concepts for improved bedside decision making in critical and hospital care; and c) to compare other methods [1] of performance evaluation in the context of arterial observations obtained with four hospital glucose meter systems.
LS MAD curves employ a straightforward non-parametric statistical algorithm. The algorithm provides objective and non-forgiving assessment—all errors count and none offset each other because of algebraic summation of positive and negative values. The continuity of LS MAD curves enhances simultaneous assessment of accuracy in the hypo-, normo-, and hyperglycemic ranges using one convenient visual record that lends itself to human pattern recognition.
Materials and Methods
Glucose Meter Systems (GMS)
We used 4 systems: (GMS1) ACCU-CHEK® Inform meter/Comfort Curve test strip, 2 each (GMS1A & 1B) (Roche Diagnostics, Indianapolis, IN); (GMS2) One Touch® SureStep®/test strip, 2 each (GMS2A & 2B) (LifeScan, Milpitas, CA); (GMS3) HemoCue® Glucose 201/microcuvette (HemoCue AB, Angelholm, Sweden); and (GMS4) Precision PCx™/Plus test strip (Abbott Laboratories, Abbott Park, IL).
Reference Instrument
The YSI 2300 (Yellow Springs Instruments, OH) reference glucose analyzer was set to auto-calibrate every 5 min at 180 mg/dl during each experiment day. Two aqueous glucose calibration solutions, 180 and 450 mg/dl, from the manufacturer were used. The total range of measurement for the YSI analyzer is from 0 to 900 mg/dl. We ran quality control at the beginning and end of each testing day. A total of 57 sets of quality control (QC) runs were done (beginning of day + end of day = 114). Each set of NERL 1343-Standard Glucose Solutions (New England Reagent Laboratory, East Providence, RI) consisted of 4 levels of National Institute of Science and Technology grade quality control solutions (50, 100, 200 and 400 mg/dl), assayed as 49.7, 99.2, 198.2, and 397.7 mg/dl, respectively. The YSI 2300 has 2 electrodes that measure glucose simultaneously in each sample. We compared the results from each of the 2 YSI electrodes, and used the average of the 2 measurements as the reference glucose value for data analysis.
Clinical Study
The Human Subjects Committee at the University of California Davis Medical Center (UCDMC) approved this study. Arterial whole-blood samples from critical care patients (613) were obtained from the blood gas laboratory. Samples were tested once on each meter system in random order to decrease systematic bias. Aliquots were centrifuged to separate plasma, which was tested in duplicate on the YSI 2300 reference analyzer, then averaged for the reference value. Meter and reference total analysis time was about 6 min.
To achieve adequate populations of glucose levels <50 and >400 mg/dl, some patient samples were glycolyzed in a warm water bath (∼37°C) or spiked with a 10% or 15% dextrose solution, respectively. GMS1A & 1B, GMS2B, GMS3, and GMS4 used one strip lot each. Two strip lots were used with GMS2A. Quality control was performed on GMSs and the YSI reference analyzer before and after each measurement series each day.
For bench experiments, 28 venous samples (14 ml) were donated by healthy adult volunteers (≥18 y) who consented to participate. Fifteen samples were used to investigate hematocrit effects on glucose measurements, and 13 samples, PO2 effects. One strip lot was used with each meter.
Experimental Model: Hematocrit Study
After centrifugation a micropipette was used to proportion plasma and erythrocytes and generate hematocrits of approximately 20, 40, and 55%. Then, samples were glycolyzed or spiked to achieve desired glucose levels of approximately 60, 100, or 250 mg/dl on the YSI 2300. This process generated 45 samples, 5 for each combination of hematocrit and glucose. Each sample was tested on each GMS, immediately centrifuged, and plasma glucose determined in duplicate on the YSI 2300, then averaged for the reference value.
Experimental Model: PO2 study
The initial PO2 in 3 mL aliquots was determined using an i-STAT®/G3+ cartridge (Abbott Laboratories, Abbott Park, IL). Samples were glycolyzed or spiked to achieve glucose levels of approximately 60, 100, or 250 mg/dl, then transferred to tonometers (Instrumentation Laboratory 237, Lexington, MA) connected to gas tanks containing 5.62, 22.48 and 56.05% oxygen with 5.62% CO2 and N2 for balance. Gases were humidified. To achieve the target PO2 levels, aliquots were tonometered for 10 minutes. PO2 was measured again.
When at the target PO2 level, a syringe equilibrated with humidified tonometer air was used to draw up blood and rapidly dose each GMS. Blood in a micro-centrifuge tube was centrifuged and plasma glucose determined in duplicate on the YSI 2300, then averaged for the reference value. We generated 39 samples, 13 each at PO2 level of 40, 100, and 400 torr, with 5, 3, and 5 at each glucose level of approximately 60, 100, and 250 mg/dl.
Locally-Smoothed (LS) Median Absolute Difference (MAD) Curves
Local smoothing transforms discrete points in the x-y plane into a curve that helps reveal underlying patterns. The locally-smoothed curve contains points (x, y) where y is the median of the values, y*, for all original points (x*,y*) in the range [x − h] ≤ x*≤ [x + h]. The bandwidth, h, controls the degree of smoothing.
A LS MAD curve provides a continuous representation of meter performance throughout the glucose range. It is calculated for integer values only. Its value at a point x is the median of the absolute differences of all paired meter and reference measurements where the reference result is within the specified distance, the bandwidth, of x. These discrete median points then are connected to generate a single curve. The absolute difference is the absolute value of the paired difference: [GMS glucose - YSI reference].
Thus, locally-smoothed median absolute difference curves are continuous from start to end. Curves started at 35 mg/dl and ended at 220 mg/dl to ensure that an adequate number of points were included in the first (20-50 mg/dl) and last (205-235 mg/dl) computational bands. We set the bandwidth, h, to 15 mg/dl, and therefore, 2h, or a span of 30 mg/dl, corresponded to a TGC interval of 80-110 mg/dl (see Discussion).
We also calculated mean absolute differences and relative absolute differences (RAD) from the raw data for reference glucose intervals of <70, 70-110, 111-150, 151-180, and >180 mg/dl. RAD is the absolute value of the percentage difference: [(GMS glucose - YSI reference)/(YSI reference)].
Clarke Error Grid
The Clarke error grid [2] assumes glucose levels <70 mg/dl should be raised, levels of 70-180 mg/dl maintained, and levels >180 mg/dl lowered. Paired values fall in 5 zones: A) GMS and reference agree within 20% or both are <70 mg/dl; B) GMS and reference differ by >20% prompting benign action or no action; C) over correction (i.e., an unnecessary action) likely to affect clinical outcome; D) failure to correct—significant medical risk; and E) correction in the wrong direction—dangerous consequences. GMS performance is typically considered acceptable if >95% of points fall within zones A and B, and no or negligible points fall in zones D and E.
Modified Bland-Altman Plots
Bland-Altman plots [3] base interpretation of performance on differences in paired GMS and reference values (y axis) versus means of pairs (x axis). We used modified Bland-Altman plots [1] where the x variable represents the YSI reference. Horizontal lines show zero bias and the mean difference. Visual inspection reveals overall unacceptable bias or ranges where bias appears unexpectedly large (e.g., concentration-dependent inaccuracies). We combined these plots with the ISO 15197 guideline to reflect both clinical and laboratory viewpoints.
ISO 15197 Guideline and Erroneous Results
The ISO 15197 guideline [4,5] states that meter measurements should be within 15 mg/dl (0.83 mmol/l) of reference for glucose <75 mg/dl (4.2 mmol/l) and within 20% for glucose ≥75 mg/dl (4.2 mmol/l). A meter system is considered within the guideline if 95% of pairs satisfy these criteria, separately for each range. In this paper, we define erroneous results as all points falling outside the ISO 15197 tolerance bands. The ISO 15197 guideline does not represent a standard, but currently is under consideration for such by the Food and Drug Administration (FDA) [6].
Bracket Predictive Value (BPV)
Positive BPV [7] is defined as [TP/(TP+FP)] where TP (true positive) represents the number of GMS-reference pairs within the TGC bracket (80-110 mg/dl), and FP (false positive) represents the number of pairs where the GMS result is inside the bracket and the reference result is outside it. Negative BPV is [TN/(TN+FN)], that is, the number of GMS-reference pairs outside the bracket divided by the number of GMS results outside the bracket (TN, true negative; FN, false negative).
Discrepant Values
Class I and II discrepancies represent GMS measurement errors that could significantly impact the effectiveness of TGC protocols. Class I discrepancies are pairs with reference <80 mg/dl and GMS >110 mg/dl. Class II discrepancies are pairs with reference >110 mg/dl and GMS <80 mg/dl. Class I discrepancies can lead to dangerous clinical decisions worsening hypoglycemia, while Class II discrepancies, to aggravation of hyperglycemia.
Statistics and Units
We used SPSS 14.0 (SPSS Inc, Chicago, IL) for descriptive statistics and least squares linear regression. Non-parametric symmetric confidence intervals were calculated for the medians of the absolute differences. For units conversion, glucose, mg/dl × 0.05555 = glucose, mmol/l and torr = 0.1333 kPa.
Results
Performance Pattern Recognition
Figure 1 presents modified Bland-Altman plots with superimposed ISO 15197 tolerance bands (dashed lines). Table 1 details bias, ISO 15197 percentages, and linear regression results. No GMS met ISO 15197 guidelines for both ranges, although GMS1A & 1B and GMS2A & 2B met or closely approached the 95% criterion for glucose ≥75 mg/dl. Paired differences for GMS 1A versus 1B and for GMS 2A versus 2B were not statistically significant (Student's t-test), while Pearson correlations were 0.985 and 0.976, respectively. Table 1 also presents absolute differences by glucose bins in order to illustrate the challenges of interpreting results for several discrete glucose intervals.
Figure 1.
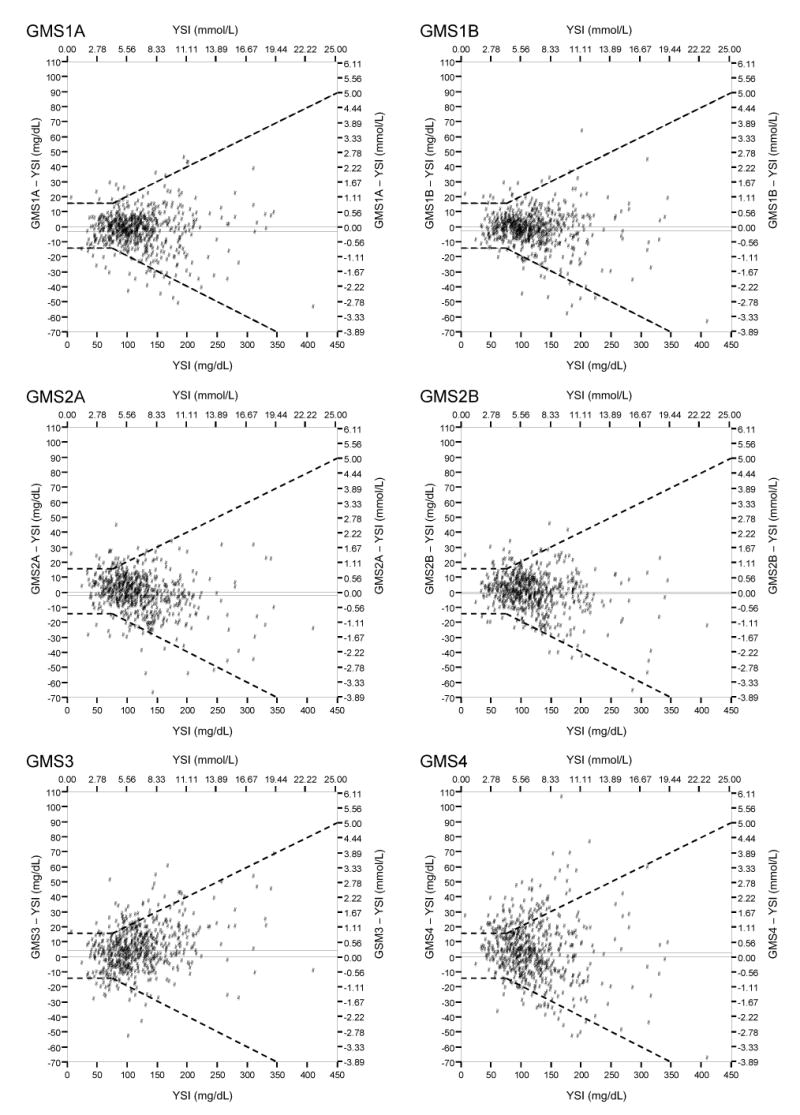
Modified Bland-Altman Plots with Superimposed ISO 15197 Tolerance Bands
Table 1.
Performance Evaluation Metrics
| GMS1A | GMS1B | GMS2A | GMS2B | GMS3 | GMS4 | |
|---|---|---|---|---|---|---|
| n | 613 | 613 | 613 | 613 | 613 | 613 |
| Clarke Error Grid, % | ||||||
| Zone A | 94.9 | 95.3 | 93.6 | 94.8 | 91.5 | 80.3 |
| Zone B | 4.7 | 4.6 | 5.5 | 4.6 | 8.0 | 17.3 |
| Zone D | 0.3 | 0.2 | 0.8 | 0.7 | 0.5 | 2.4 |
| Modified Bland-Altman Analysis | ||||||
| Bias, mg/dl, mean ± SD | -3.38 ± 12.49 | -2.74 ± 12.12 | -1.97 ± 13.21 | -1.29 ± 12.73 | 4.40 ± 14.70 | 2.66 ± 19.41 |
| 95% CI | (-4.37,-2.39) | (-3.70,-1.78) | (-3.02,-0.92) | (-2.30,-0.28) | (3.24,5.57) | (1.12,4.20) |
| ISO 15197 Guideline, % | ||||||
| <75 mg/dl | 87.5 | 90.6 | 86.5 | 86.5 | 80.2 | 62.5 |
| ≥75 mg/dl | 94.8 | 95.0 | 94.6 | 95.7 | 91.9 | 82.4 |
| Linear Regression | ||||||
| r2 | 0.95 | 0.95 | 0.94 | 0.94 | 0.94 | 0.87 |
| y-intercept (95% CI) | -1.87 (-4.37-0.63) | 0.76 (-1.65-3.17) | 6.20 (3.65-8.74) | 6.24 (3.78-8.70) | -6.02 (-8.82-(-3.21)) | 8.92 (5.08-12.77) |
| Slope (95%CI) | 0.99 (0.97-1.01) | 0.97 (0.95-0.99) | 0.93 (0.91-0.95) | 0.94 (0.92-0.96) | 1.09 (1.06-1.11) | 0.95 (0.92-0.98) |
| Absolute Difference (AD), mg/dl, mean ± SD | ||||||
| All Measurements | 9.1 ± 9.2 | 8.5 ± 9.1 | 9.8 ± 9.1 | 9.3 ± 8.7 | 11.5 ± 10.2 | 14.6 ± 13.0 |
| <70 mg/dl | 7.9 ± 6.6 | 6.8 ± 5.3 | 7.4 ± 6.3 | 6.4 ± 6.3 | 9.3 ± 7.0 | 10.6 ± 8.6 |
| 70 – 110 mg/dl | 6.7 ± 6.4 | 6.1 ± 6.4 | 8.1 ± 6.9 | 7.8 ± 6.2 | 9.9 ± 8.4 | 11.8 ± 9.1 |
| 111 - 150 mg/dl | 8.5 ± 8.0 | 8.4 ± 7.5 | 10.5 ± 9.6 | 9.7 ± 8.1 | 11.2 ± 9.8 | 14.3 ± 11.7 |
| 151 - 180 mg/dl | 14.3 ± 12.0 | 9.5 ± 10.4 | 10.6 ± 8.9 | 12.3 ± 11.0 | 13.0 ± 11.9 | 21.7 ± 20.0 |
| >180 mg/dl | 15.1 ± 13.6 | 16.1 ± 14.9 | 14.5 ± 12.9 | 13.5 ± 13.4 | 17.6 ± 14.1 | 22.1 ± 17.6 |
| Relative Absolute Difference (RAD), %, mean ± SD | ||||||
| All Measurements | 8.4 ± 11.6 | 7.7 ± 11.7 | 9.2 ± 13.8 | 8.6 ± 12.9 | 10.5 ± 11.4 | 13.3 ± 16.0 |
| <70 mg/dl | 18.1 ± 27.3 | 16.0 ± 28.6 | 17.9 ± 34.5 | 15.4 ± 33.1 | 19.4 ± 23.2 | 23.4 ± 37.5 |
| 70 – 110 mg/dl | 7.3 ± 7.2 | 6.6 ± 6.8 | 9.0 ± 8.2 | 8.7 ± 7.1 | 10.9 ± 9.5 | 13.1 ± 10.2 |
| 111 - 150 mg/dl | 6.5 ± 6.0 | 6.5 ± 5.5 | 8.0 ± 7.1 | 7.4 ± 5.8 | 8.7 ± 7.4 | 11.0 ± 9.0 |
| 151 - 180 mg/dl | 8.7 ± 7.2 | 5.7 ± 6.0 | 6.5 ± 5.5 | 7.4 ± 6.6 | 8.0 ± 7.2 | 13.2 ± 12.0 |
| >180 mg/dl | 7.0 ± 6.3 | 7.3 ± 6.8 | 6.3 ± 5.4 | 5.9 ± 5.5 | 7.7 ± 5.8 | 10.0 ± 8.0 |
| Bracket Predictive Value (80 – 110 mg/dl), % | ||||||
| Positive BPV | 83.5 | 80.5 | 78.5 | 77.7 | 82.6 | 67.0 |
| Negative BPV | 93.5 | 95.2 | 91.2 | 90.0 | 88.6 | 86.5 |
Note: Glucose, mg/dl × 0.0555 = glucose, mmol/L.
Figures 2-4 present locally-smoothed (LS) median absolute difference (MAD) curves created using a bandwidth of 15 mg/dl and x range from 35 to 220 mg/dl. In the interval 80-110 mg/dl, we observed nearly flat (GMS1A, Fig. 2), gently rising (GMS2A, Fig. 2), rising (GMS1B, GMS2B; Fig. 3), offset (GMS3, Fig. 4), and highly offset-bumpy (GMS4, Fig. 4) patterns. Table 1 gives the bracket predictive values (BPV) for the 80-110 mg/dl interval. Better performing systems scored close to 80% positive BPV. Outside the 80-110 mg/dl interval, LS MAD curve patterns were inconsistent, with substantial upward shifts in the hypoglycemic and hyperglycemic ranges for most of the systems. Thus, errors were substantial in those ranges. Table 2 presents Class I and II discrepancies.
Figure 2.
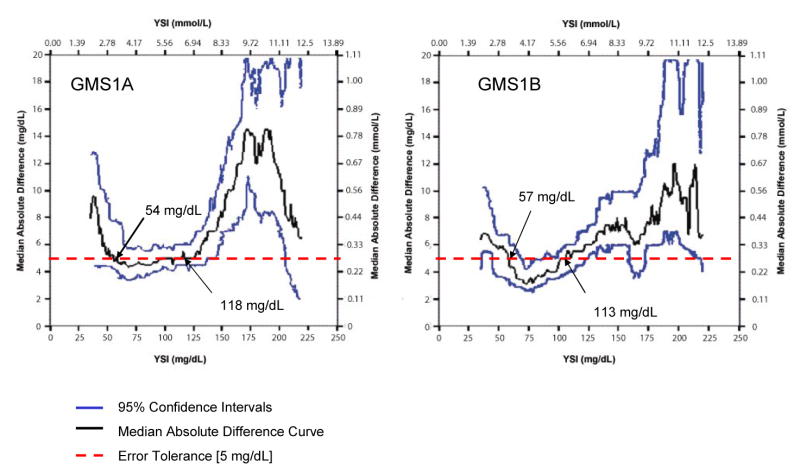
Locally-Smoothed Median Absolute Difference Curve: GMS 1. The graphs show LS MAD curves for GMS 1A and 1B. The 95% confidence intervals appear above and below the curve. The dashed horizontal line at 5 mg/dl represents the recommended error tolerance. Values of reference glucose where the LS MAD curve crosses the error tolerance, so-called “breakout points,” are identified by the black arrows.
Figure 4.
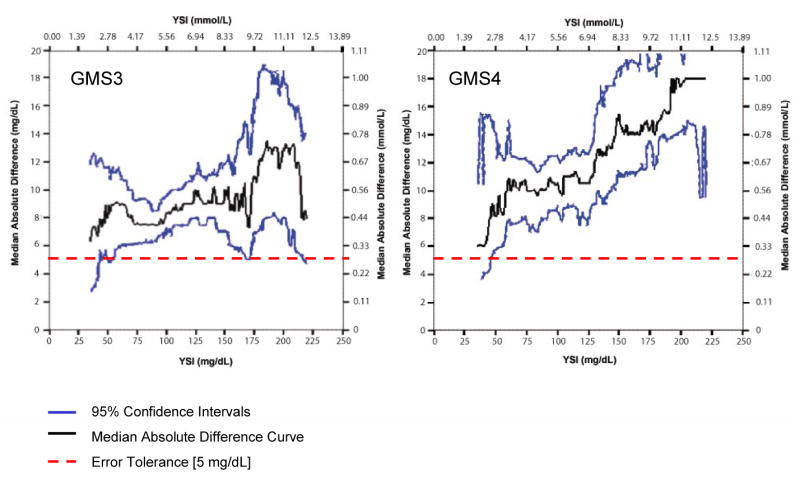
Locally-Smoothed Median Absolute Difference Curves: GMS 3 and 4. LS MAD curves for GMS 3 and 4. The LS MAD curves float above the error tolerance throughout the glucose range from 35 to 220 mg/dl, which reflects paired observations with reference glucose values from 20 to 235 mg/dl. Each system produced one dangerous Class I discrepant value (see Table 2) in the TGC range from 80 to 110 mg/dl.
Figure 3.
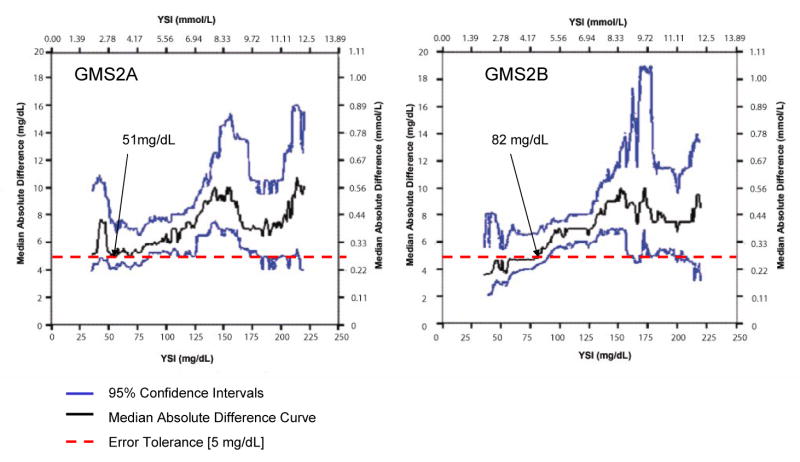
Locally-Smoothed Median Absolute Difference Curves: GMS 2. LS MAD curves for GMS 2A and 2B. Same format as Figure 2.
Table 2.
Discrepant Values
| Reference | Meter | Bias | ||||
|---|---|---|---|---|---|---|
| Class I Discrepancy | mg/dl | mmol/L | mg/dl | mmol/L | mg/dl | mmol/L |
| GMS3 | 72.95 | 4.05 | 123 | 6.83 | 50.05 | 2.78 |
| GMS4 | 74.95 | 4.16 | 113 | 6.28 | 38.05 | 2.11 |
| Class II Discrepancy | ||||||
| GMS1A | 115 | 6.39 | 79 | 4.39 | -36 | -2.00 |
| GMS2A | 132.5 | 7.36 | 77 | 4.28 | -55.5 | -3.08 |
| 145 | 8.05 | 77 | 4.28 | -68 | -3.78 | |
Hematocrit and PO2 Effects
Bias typically changed from positive to negative and then decreased as hematocrit increased (Table 3). Mean absolute differences increased for GMS4, and were lowest at 40% hematocrit for GMS1A & 1B, GMS2A, and GMS3. Unlike hematocrit, as PO2 increased no consistent trends appeared, except for GMS4, where absolute differences increased with higher PO2 levels (see Table 3).
Table 3.
Hematocrit and PO2 Effects on Glucose Measurements
| GMS1A | GMS1B | GMS2A | GMS2B | GMS3 | GMS4 | |
|---|---|---|---|---|---|---|
| A. Hematocrit (n=45) | ||||||
| Difference, mg/dl, mean ± SD | ||||||
| All Measurements | -4.9 ± 15.8 | -3.9 ± 16.4 | -2.9 ± 16.2 | 6.6 ± 16.5 | 4.2 ± 14.1 | -8.5 ± 22.4 |
| Hematocrit 20% (n=15) | 5.2 ± 11.4 | 5.9 ± 13.0 | 12.7 ± 9.5 | 23.4 ± 9.5 | 14.8 ± 10.8 | 9.5 ± 12.9 |
| Hematocrit 40% (n=15) | -2.7 ± 8.1 | -3.1 ± 8.2 | -4.4 ± 8.8 | 4.6 ± 9.4 | 1.8 ± 10.4 | -11.5 ± 13.2 |
| Hematocrit 55% (n=15) | -17.1 ± 17.8 | -14.5 ± 19.7 | -17.0 ± 13.5 | -8.4 ± 11.5 | -4.2 ± 13.9 | -23.6 ± 25.2 |
| Absolute Difference, mg/dl, mean ± SD | ||||||
| All Measurements | 11.1 ± 12.2 | 10.1 ± 13.5 | 12.3 ± 10.9 | 13.9 ± 11.0 | 11.8 ± 8.5 | 16.5 ± 17.3 |
| Hematocrit 20% (n=15) | 9.0 ± 8.4 | 9.0 ± 11.0 | 12.7 ± 9.5 | 23.4 ± 9.5 | 14.8 ± 10.8 | 12.2 ± 10.2 |
| Hematocrit 40% (n=15) | 7.1 ± 4.4 | 6.3 ± 5.9 | 7.1 ± 6.7 | 9.1 ± 4.7 | 8.2 ± 6.4 | 13.7 ± 10.8 |
| Hematocrit 55% (n=15) | 17.2 ± 17.8 | 15.0 ± 19.3 | 17.0 ± 13.5 | 9.2 ± 10.9 | 12.5 ± 6.6 | 23.6 ± 25.2 |
| B. PO2 (n=39) | ||||||
| Difference, mg/dl, mean ± SD | ||||||
| All Measurements | 2.8 ± 19.9 | -0.2 ± 19.4 | 1.8 ± 22.2 | -7.6 ± 12.6 | -7.8 ± 10.8 | -31.1 ± 36.5 |
| PO2 40 torr (5.3 kPa) (n=13) | 1.4 ± 20.0 | 0.1 ± 17.4 | 0.3 ± 23.9 | -6.4 ± 7.6 | -7.3 ± 14.2 | -12.4 ± 35.4 |
| PO2 100 torr (13.3 kPa) (n=13) | 8.3 ± 19.6 | 5.9 ± 19.0 | 1.8 ± 28.7 | -5.8 ± 18.8 | -7.9 ± 10.6 | -35.2 ± 32.8 |
| PO2 400 torr (53.3 kPa) (n=13) | -1.2 ± 20.6 | -6.6 ± 21.1 | 3.2 ± 12.7 | -10.7 ± 8.8 | -8.2 ± 7.4 | -45.6 ± 35.6 |
| Absolute Difference, mg/dl, mean ± SD | ||||||
| All Measurements | 11.5 ± 16.4 | 12.6 ± 14.6 | 12.6 ± 18.3 | 10.6 ± 10.2 | 10.5 ± 8.1 | 33.7 ± 34.0 |
| PO2 40 torr (5.3 kPa) (n=13) | 11.7 ± 15.9 | 12.0 ± 12.1 | 13.9 ± 19.0 | 7.9 ± 6.0 | 12.0 ± 10.1 | 20.1 ± 31.4 |
| PO2 100 torr (13.3 kPa) (n=13) | 11.6 ± 17.7 | 10.6 ± 16.6 | 15.4 ± 23.9 | 13.2 ± 14.2 | 9.9 ± 8.6 | 35.5 ± 32.5 |
| PO2 400 torr (53.3 kPa) (n=13) | 11.2 ± 17.0 | 15.3 ± 15.5 | 8.5 ± 9.7 | 10.8 ± 8.7 | 9.6 ± 5.3 | 45.6 ± 35.6 |
Note: Glucose, mg/dl × 0.05555 = glucose, mmol/L; torr = 0.1333 kPa.
Reference Instrument Quality Control
Glucose duplicate measurements obtained with each YSI 2300 electrode were not significantly different (P > 0.05) for both beginning and end of day quality control runs when analyzed using Student's t-test for paired differences. The YSI reference analyzer operated within control during the entire study. The beginning of day coefficient of variation (CV, %) for the 50, 100, 200 and 400mg/dl levels were 1.9, 1.7, 1.4, and 1.1%, while the end of day CVs were 1.6, 1.3, 1.2 and 1.1%, respectively. Means (SDs) were, respectively, 49.9[1.0]/ 49.9[1.0], 100.2[1.8]/ 100.1[1.8], 199.2[2.7]/ 199.3[2.8], and 395.6[4.2]/ 397.0[4.5] mg/dl for the 2 electrodes beginning of day (N = 57) and 50.0[0.8]/ 50.2[0.9], 100.3[1.3]/ 100.3[1.3], 200.1[2.3]/ 200.2[2.3], 397.4[4.5]/ 398.7[4.5] mg/dl end of day (N = 57). In summary, YSI imprecision was minimal, and relative to the NIST traceable standards, bias was insignificant.
Discussion
Locally-smoothed (LS) median absolute difference (MAD) curves reveal accuracy continuously and quantitatively over the clinically relevant rang. Bandwidth can be matched to a specific TGC interval [8-18] (Fig. 5), here 80-110 mg/dl [16-18]. This interval has a span of 30 mg/dl, twice the bandwidth (h) of 15 mg/dl. We selected this bandwidth to produce LS MAD curves that were neither overly smoothed nor too “noisy,” yet displayed performance adequately. For example, whole-blood glucose meters perform poorly in low (hypoglycemic) and high (hyperglycemic) zones [19], as illustrated vividly here in the erratic tails and substantial offsets in several of the LS MAD patterns in Figures 2 through 4.
Figure 5.
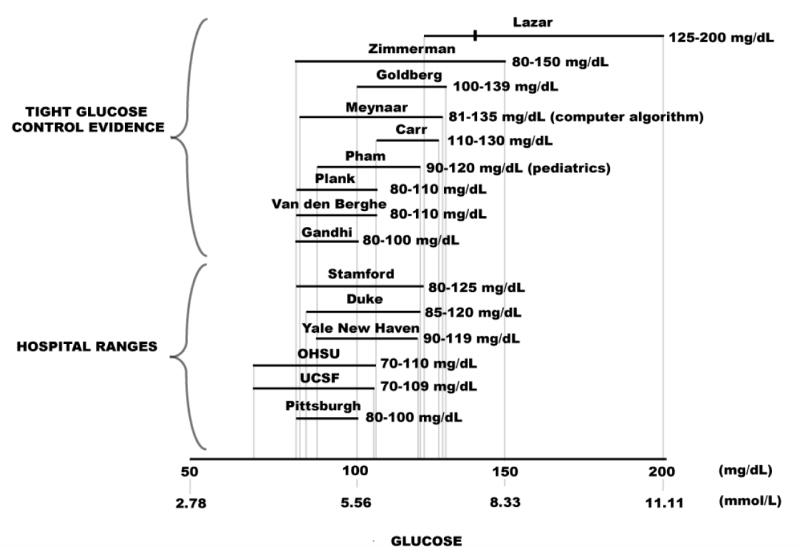
Tight Glucose Control (TGC) Intervals—Evidence-Based Clinical Investigations. To maintain TGC, nurses adjust therapy quickly after obtaining bedside glucose results each hour or more frequently. This short therapeutic turnaround time generally requires bedside testing. Hence, POC results must be accurate, because the clinical team uses them for immediate decision making. The TGC ranges at the top were obtained from published papers (8-18). The mark in the top interval represents mean glucose (138 mg/dl) in the study by Lazar et al. [8]. Hospital TGC ranges shown below were obtained by calling.
The LS MAD algorithm is unforgiving but fair—positive and negative errors do not offset, but become readily apparent when reflected in the connected medians of the absolute differences. LS MAD curves are highly visual and easily interpreted. They lend themselves to rapid human pattern recognition of both good and bad performance. The LS MAD curve profile for a glucose meter should be “flat” with minimal offset in the central vicinity of the TGC bracket. These features represent acceptable, but not perfect performance in that range. The 95% confidence intervals (see Figures 2-4) reveal uncertainty inherent in the LS MAD curve. We found no similar work published elsewhere, and the description in the methods section is adequate to implement analysis. We suggest that the LS MAD curves be used to evaluate other POC analytes and bedside devices.
We recommend for hospital glucose meters that the LS MAD curve not exceed an error tolerance limit of 5 mg/dl. Ideally, LS MAD curves (Figures 2-4) should be as close as possible to the x axis throughout (minimal offset), indicating congruence with the reference from the hypo- to hyperglycemic ranges. The bandwidth also portrayed performance well near the specific decision thresholds of 80 and 110 mg/dl, below and above which, respectively, the critical care team will adjust insulin therapy to maintain the patient within the TGC interval. When used to monitor the patient hourly in critical care settings a glucose meter system needs to be optimized for the TGC decision thresholds.
Potential confounding variables [19-22] and other unknown analytical or specimen matrix factors increase median absolute differences in the extremes of glucose values, as seen in the interval-specific analyses in Table 1. The modified Bland-Altman plots with superimposed ISO 15197 tolerance bands (Fig. 1) illustrate bias and positive and negative deviations from the paired reference glucose result in the form of scatter about the bias line. They show that error variance for glucose meters increases substantially at high glucose levels (heteroscedasticity) and thus, jointly reveal problems over the analytical measurement range.
We recommend that ISO 15197-integrated modified Bland-Altman plots be used to identify erroneous results, which are easily apparent on this type of plot and one of its main advantages. In contrast, bracket predictive value [7] reflects whether meter results inside or outside the TGC interval reliably reflect paired reference results. Table 2 shows that meter systems could lead to adverse decision making for TGC if they produce Class I and II discrepancies. Class I discrepancies could led to serious hypoglycemic episodes. Critical care teams must set suitable BPV acceptance thresholds for specific clinical applications.
The Clarke error grid assumes that acceptability of meter performance will be based on its ability to discriminate among glucose values <70, 70 to 180, and >180 mg/dl, ranges now too broad to be used for clinical management protocols that incorporate narrow TGC ranges and intensive insulin therapy. Despite these disadvantages, we included Clarke error grid performance in Table 1. Though the original hope was that the error grid zones would be refined, with the exception of the Parkes Consensus error grids for type 1 and 2 diabetes [23], the original error grid has remained frozen in time and now has no relevance to current TGC concepts and hospital-based glucose testing. Additionally, the Food and Drug Administration (FDA) does not require Clarke error grid analysis for licensing [6]. Instead, the FDA has solicited comments on its proposal to use primarily the ISO 15197 guideline.
Other graphical approaches (e.g., mountain plots [24]), statistical analyses (e.g., repeated measures ANOVA), and combined methods (e.g., ordinary least squares linear regression and its parametric summary) extract statistically useful information from the dataset. They do so at an abstract level, however, which is not clinically intuitive nor directly related to TGC concepts, intervals, or decision making. The main disadvantage of these global approaches is that they sum up performance across glucose subranges and represent it parametrically. Thus, poor performance in subranges critical for bedside decision making can be masked or missed, since poor performance or unacceptable bias in one subrange can be offset by unacceptable bias in another subrange. Nonetheless, the FDA requests parametric description of comparison data, such as linear regression, prior to licensing devices for clinical use.
In the newborn nursery, the accuracy of POC glucose testing in the low range is paramount, while in the emergency room, both low and high ranges are of concern. Among intensive care unit patients, where physiological extremes are the norm, accuracy must be maintained under widely varying conditions, including during fluctuations in hematocrit, PO2, PCO2, and pH, as well as in the presence of drug interferences [20-22]. ISO 15197-integrated Bland-Altman and LS MAD curves draw on human pattern recognition. As experience accumulates, LS MAD curves may help identify trends [25,26] associated with the effects of these confounding variables in specific patient populations.
Conclusions
Glucose meter systems demonstrate characteristic accuracy patterns that may generate erroneous results and discrepant values, including dangerous ones falling in Class I. Substantial and unpredictable differences in performance can affect patient care significantly. LS MAD curves draw on the unique human ability to recognize patterns quickly, compare them effectively, and discriminate accuracy visually. Performance standards should incorporate LS MAD curves in conjunction with the recommended error tolerance limit of 5 mg/dl for bedside glucose testing in critical care settings. Critical care physicians and nurses in collaboration with POC coordinators and clinical chemists should evaluate performance specifically as it relates to glucose intervals for tight glucose control protocols used in their own institutions. POC staff should scrutinize performance for specific TGC intervals used in therapeutic decision making and consider erroneous results demonstrated by ISO 15197-integrated modified Bland-Altman plots. We recommend use of these plots in conjunction with LS MAD curves when assessing accuracy. Future guidelines and standards should include this continuous pattern recognition approach for the assessment of the accuracy. Locally-smoothed median absolute difference curves with assigned error tolerance limits can be applied to other POCT analytes to facilitate informed bedside decision making.
Acknowledgments
We thank the physicians, nurses, and staff of UCDMC for their assistance. This study was supported in part by The Epsilon Group Virginia, LLC; by the Point-of-Care Testing Center for Teaching and Research, POCT•CTRSM, School of Medicine, University of California, Davis; and by NIH NIBIB Point-of-Care Technologies Cent4er grant U54 E. Figures 2 through 5 were provided courtesy and permission of Knowledge Optimization®, Davis, CA.
Footnotes
Publisher's Disclaimer: This is a PDF file of an unedited manuscript that has been accepted for publication. As a service to our customers we are providing this early version of the manuscript. The manuscript will undergo copyediting, typesetting, and review of the resulting proof before it is published in its final citable form. Please note that during the production process errors may be discovered which could affect the content, and all legal disclaimers that apply to the journal pertain.
References
- 1.Tran NK, Promptmas C, Kost GJ. Biosensors, miniaturization, and noninvasive techniques. In: Ward Cook KM, Lehman CA, Schoeff LE, et al., editors. Clinical Diagnostic Technology: The Total Testing Process Volume 3: The Postanalytical Phase. Chapter 7. Washington D.C.: American Association for Clinical Chemistry Press; 2006. pp. 145–184. [Google Scholar]
- 2.Clarke WL, Cox D, Gonder-Frederick LA, et al. Evaluating clinical accuracy of systems for self monitoring of blood glucose. Diabetes Care. 1987;10:622–628. doi: 10.2337/diacare.10.5.622. [DOI] [PubMed] [Google Scholar]
- 3.Bland JM, Altman DG. Statistical methods for assessing agreement between two methods of clinical measurement. Lancet. 1986;1:307–310. [PubMed] [Google Scholar]
- 4.International Organization for Standardization. In Vitro Diagnostic Test Systems— Requirements for Blood-Glucose Monitoring Systems for Self-Testing in Managing Diabetes Mellitus International Standard Report Number ISO 15197:2003(E) Geneva: International Organization for Standardization; 2003. [Google Scholar]
- 5.Kost GJ, Louie R, Veerasamy N, et al. Meeting the challenge of the International Standard ISO 15197 for capillary glucose accuracy. Clin Chem. 2005;51:A255. abstract. [Google Scholar]
- 6.Draft guidance for industry and FDA staff—total product life cycle for portable invasive blood glucose monitoring systems. [July 30, 2007]; FDA website: http://www.fda.gov/cdrh/oivd/guidance/1603.html.
- 7.Kost GJ, Vu HT, Lee JH, et al. Multicenter study of oxygen-insensitive handheld glucose point-of-care testing in critical care/hospital/ambulatory patients in the United States and Canada. Crit Care Med. 1998;26:581–590. doi: 10.1097/00003246-199803000-00036. [DOI] [PubMed] [Google Scholar]
- 8.Lazar HL, Chipkin SR, Fitzgerald CA, et al. Tight glycemic control in diabetic coronary artery bypass graft improves perioperative outcomes and decreases recurrent ischemic events. Circulation. 2004;109:1497–1502. doi: 10.1161/01.CIR.0000121747.71054.79. [DOI] [PubMed] [Google Scholar]
- 9.Zimmerman CR, Mlynarek ME, Jordan JA, et al. An insulin infusion protocol in critically ill cardiothoracic surgery patients. Ann Pharmacother. 2004;38:1123–1129. doi: 10.1345/aph.1E018. [DOI] [PubMed] [Google Scholar]
- 10.Krinsley JS. Association between hyperglycemia and increased hospital mortality in a heterogeneous population of critically ill patients. Mayo Clin Proc. 2003;78:1471–1478. doi: 10.4065/78.12.1471. [DOI] [PubMed] [Google Scholar]
- 11.Goldberg PA, Siegel MD, Sherwin RS, et al. Implementation of a safe and effective insulin infusion protocol in a medical intensive care unit. Diabetes Care. 2004;27:461–467. doi: 10.2337/diacare.27.2.461. [DOI] [PubMed] [Google Scholar]
- 12.Meynaar IA, Dawson L, Tangkau PL, et al. Introduction and evaluation of a computerized insulin protocol. Intensive Care Med. 2007;33:591–596. doi: 10.1007/s00134-006-0484-z. [DOI] [PubMed] [Google Scholar]
- 13.Carr JM, Sellke FW, Fey M, et al. Implementing tight glucose control after coronary artery bypass surgery. Ann Thorac Surg. 2005;80:902–909. doi: 10.1016/j.athoracsur.2005.03.105. [DOI] [PubMed] [Google Scholar]
- 14.Pham TN, Warren AJ, Phan HH, et al. Impact of tight glycemic control in severely burned children. J Trauma. 2005;59:1148–1154. doi: 10.1097/01.ta.0000188933.16637.68. [DOI] [PubMed] [Google Scholar]
- 15.Plank J, Blaha J, Cordingley J, et al. Multicentric, randomized, controlled trial to evaluate blood glucose control by the model predictive control algorithm versus routine glucose management protocols in intensive care unit patients. Diabetes Care. 2006;29:271–276. doi: 10.2337/diacare.29.02.06.dc05-1689. [DOI] [PubMed] [Google Scholar]
- 16.Van den Berghe G, Wouters P, Weekers F, et al. Intensive insulin therapy in critically ill patients. N Eng J Med. 2001;345:1359–1367. doi: 10.1056/NEJMoa011300. [DOI] [PubMed] [Google Scholar]
- 17.Van den Berghe G, Wouters PJ, Bouillon R, et al. Outcome benefit of intensive insulin therapy in the critically ill: insulin dose versus glycemic control. Crit Care Med. 2003;31:359–366. doi: 10.1097/01.CCM.0000045568.12881.10. [DOI] [PubMed] [Google Scholar]
- 18.Van den Berghe G, Woulters PJ, Kesteloot K, et al. Analysis of healthcare resource utilization with intensive insulin therapy in critically ill patients. Crit Care Med. 2006;34:612–616. doi: 10.1097/01.ccm.0000201408.15502.24. [DOI] [PubMed] [Google Scholar]
- 19.Khan AI, Vasquez Y, Gray J, et al. The variability of results between point-of-care testing glucose meters and the central laboratory analyzer. Arch Pathol Lab Med. 2006;130:1527–1532. doi: 10.5858/2006-130-1527-TVORBP. [DOI] [PubMed] [Google Scholar]
- 20.Louie RF, Tang Z, Sutton DV, et al. Point-of-care glucose testing: effects of critical care variables, influence of reference instruments, and a modular glucose meter design. Arch Pathol Lab Med. 2000;124:257–266. doi: 10.5858/2000-124-0257-POCGT. [DOI] [PubMed] [Google Scholar]
- 21.Tang Z, Lee JH, Louie RF, et al. Effects of different hematocrit levels on glucose measurements with handheld meters for point-of-care testing. Arch Pathol Lab Med. 2000;124:1135–1140. doi: 10.5858/2000-124-1135-EODHLO. [DOI] [PubMed] [Google Scholar]
- 22.Tang Z, Louie RF, Lee JH, et al. Oxygen effects on glucose meter measurements with glucose dehydrogenase- and oxidase-based test strips for point-of-care testing. Crit Care Med. 2001;29:1062–1070. doi: 10.1097/00003246-200105000-00038. [DOI] [PubMed] [Google Scholar]
- 23.Parkes JL, Slatin SL, Pardo S, et al. A new consensus error grid to evaluate the clinical significance of inaccuracies in the measurement of blood glucose. Diabetes Care. 2000;23:1143–1148. doi: 10.2337/diacare.23.8.1143. [DOI] [PubMed] [Google Scholar]
- 24.Krouwer JS, Monti KL. A simple, graphical method to evaluate laboratory assays. Eur J Clin Chem Clin Biochem. 1995;33:525–527. [PubMed] [Google Scholar]
- 25.Kost GJ. Understanding and preventing medical errors in point-of-care testing (and the use of FAST-QC) In: Nichols JH, editor. Point-of-Care Testing: Performance Improvement and Evidence-Based Outcomes. Chapter 4. New York: Marcel Dekker; 2003. pp. 101–120. [Google Scholar]
- 26.Kost GJ. The hybrid laboratory, therapeutic turnaround time, critical limits, performance maps, and Knowledge Optimization®. In: Kost GJ, editor. Principles and Practice of Point-of-Care Testing. Chapter 2. Philadelphia: Lippincott Williams and Wilkins; 2002. pp. 13–25. [Google Scholar]