Abstract
Objective
To determine whether abnormalities of calcium cycling explain ventricular action potential (AP) oscillations and cause ECG T-wave Alternans (TWA).
Background
Mechanisms explaining why heart failure patients are at risk for malignant ventricular arrhythmias (VT/VF) are unclear. We studied whether oscillations in human ventricular AP explain TWA and predict VT/VF, and used computer modeling to suggest potential cellular mechanisms.
Methods
We studied 53 patients with LV ejection fraction 28±8% and 18 control subjects. Monophasic AP were recorded in the right (RV, n=62) and/or left (LV, n=9) ventricle at 109 beats/min.
Results
Alternans of AP amplitude, computed spectrally, had higher magnitude in study patients than controls (p=0.03), particularly in AP phase II (p=0.02) rather than phase III (p=0.10). APD and activation restitution (n=11 patients) were flat at 109 beats/min and did not explain TWA. In computer simulations, only reduced sarcoplasmic reticulum calcium uptake explained our results, causing causing calcium oscillations, AP amplitude alternans and TWA that were all abolished by calcium clamping. On prospective follow-up for 949±553 days, 17 patients suffered VT/VF. AP amplitude alternans predicted VT/VF (p=0.04), and was 78% concordant with simultaneous TWA (p=0.003).
Conclusions
Patients with systolic dysfunction show ventricular AP amplitude alternans that prospectively predicted VT/VF. Alternans in AP amplitude, but not variations in APD or conduction, explained TWA at ≤109 beats/min. In computer models, these findings were best explained by reduced sarcoplasmic reticulum calcium uptake. In heart failure patients, in vivo AP alternans may reflect cellular calcium abnormalities and provide a mechanistic link with VT/VF.
Keywords: Calcium Cycling, Electrical Restitution, Ventricular Action Potentials, Computer modeling, Conduction Velocity, T-wave Alternans, Sudden Cardiac Arrest
Introduction
Sudden cardiac arrest (SCA) from ventricular arrhythmias (VT/VF) claims over 300,000 lives per year in the United States (1). Although patients with systolic dysfunction are at high risk for SCA (1), few cellular or tissue-level mechanisms have been identified in humans to explain this arrhythmic propensity.
T-wave alternans (TWA) from the ECG identifies patients with systolic dysfunction at risk for VT/VF (2). However, its mechanistic basis is unclear. Until recently it was felt that TWA is caused by a steep slope (>1) of the action potential duration (APD) rate-response curve (restitution) that, at very rapid rates (3), may lead to APD alternans (4). In the presence of conduction slowing or premature beats, APD alternans may develop opposite phase in adjacent myocardium (discordant alternans) leading imminently to VT/VF (4). However, these fast-rate mechanisms do not explain clinical TWA, that predicts outcome only if present at slow rates (≤109 beats/min) and is most predictive at ≤ 90 beats/min (2,5). Moreover, spontaneous clinical VT often initiates in the setting of non-elevated heart rates (6). Clinical (7) and theoretical (8) data show that human APD does not fluctuate at such rates.
Animal studies show that fluctuations in cytosolic calcium may also cause APD alternans and arrhythmias (4,9–11). Although such alternans occurs at fast rates, most reports have not studied failing hearts with calcium overload (12), in which calcium oscillations may hypothetically occur at slower rates. Theoretically, TWA may also result from oscillations in myocyte activation time (i.e. conduction) (4,13) or sodium channel inactivation (14,15).
We hypothesized that, in patients with systolic heart failure, abnormal calcium handling causes oscillations of cytosolic calcium at modest heart rate elevation, leading to fluctuations in action potential amplitude that link TWA with VT/VF. We tested this hypothesis using ventricular monophasic APs in patients with systolic dysfunction, together with computational modeling to study if AP amplitude alternans is best explained by abnormalities in cellular calcium, sodium or conduction, and prospective follow-up to determine if AP amplitude alternans predicts spontaneous VT/VF.
Methods
Patient Recruitment
This study was approved by the joint Institutional Review Board of the Veterans Affairs and University of California Medical Centers, San Diego, and patients provided written informed consent. We recruited 53 study patients with LV ejection fraction (LVEF) ≤ 40% undergoing programmed ventricular stimulation, and 18 control patients (LVEF > 40%) undergoing ablation of paroxysmal supraventricular tachycardias. We excluded patients with sustained VT/VF or aborted SCA, within 30 days of an acute coronary syndrome or 6 weeks of coronary revascularization, or those with permanent pacemakers.
Pacing at Electrophysiologic Study
Patients were studied in the post-absorptive state. A 7F MAP catheter (EP Technologies, Sunnyvale, CA) was advanced transvenously to the apex of the right ventricle (RV, n=62), or retrogradely across the aortic valve to the left ventricle (LV; n=6 study and n=3 control). MAPs were recorded simultaneously at 2 sites in n=11 of these patients. After digitization at 1 kHz from our recorder (Bard, Billerica, MA), electrograms were analyzed at 0.05–500Hz (MAPs), 30–500 Hz (most intracardiacs) and 0.05 – 100 Hz (ECG).
Research was performed before programmed stimulation (study patients) or ablation (control patients), in the population in whom we recently reported that APD restitution did not predict VT/VF (7). First, we studied MAPs and simultaneous TWA during right atrial pacing at 109 beats/min for >90 seconds (16) ( figure 1–figure 2). Second, in patients with dual-site MAPs, we measured activation time to the second catheter after RV apical pacing, using 10 drive train beats at CL 500 ms then single extrastimuli coupled at 400 ms, in 20 ms steps to 300 ms, then in 10 ms steps to refractoriness. The clinical procedure was then performed and implantable cardioverter defibrillators (ICD) were implanted according to clinical guidelines.
Figure 1.
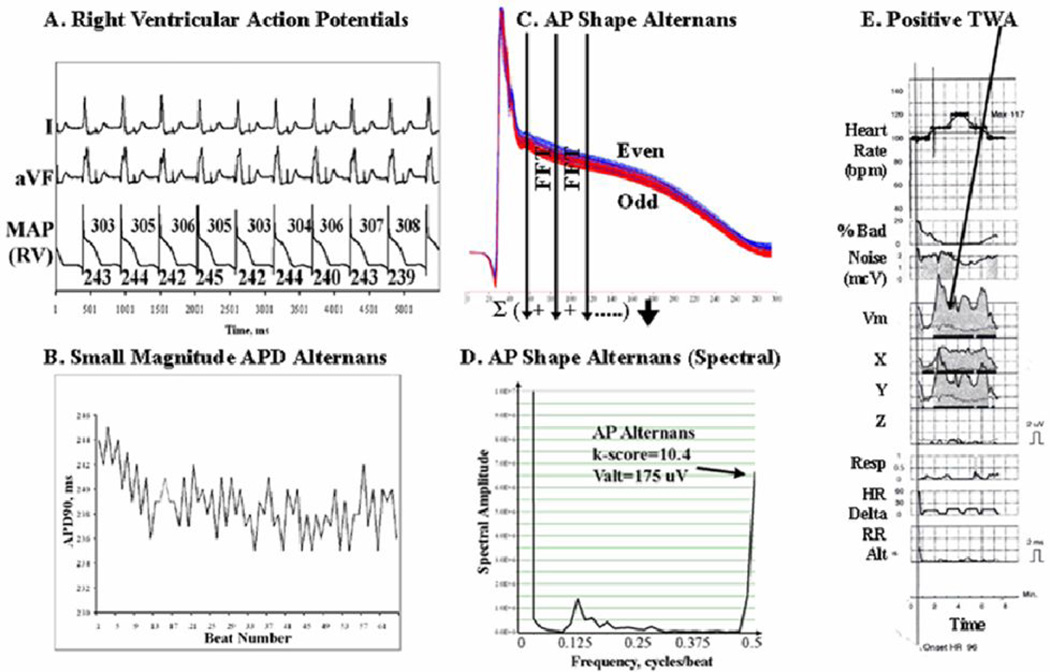
Ventricular Action Potential Alternans. This 59 year old man had ischemic cardiomyopathy and LVEF 20%. (A) 109 beats/min pacing; (B) APD shows minimal oscillations over time. However, when 64 consecutive beats were superimposed, (C) AP amplitude shows marked Alternans, shown by the separation of even (blue) and odd (red) beats. (D) AP Amplitude Alternans (k-score=10.4, Valt=175µV) is depicted on this spectrum across beats, as peak magnitude at 0.5 cycles/beat. (E) TWA is positive at this time (gray areas in X, Y and vector magnitude Vm leads) with low levels of bad beats, noise and no confounding respiratory, heart rate (HR) or RR interval alternans.
Figure 2.
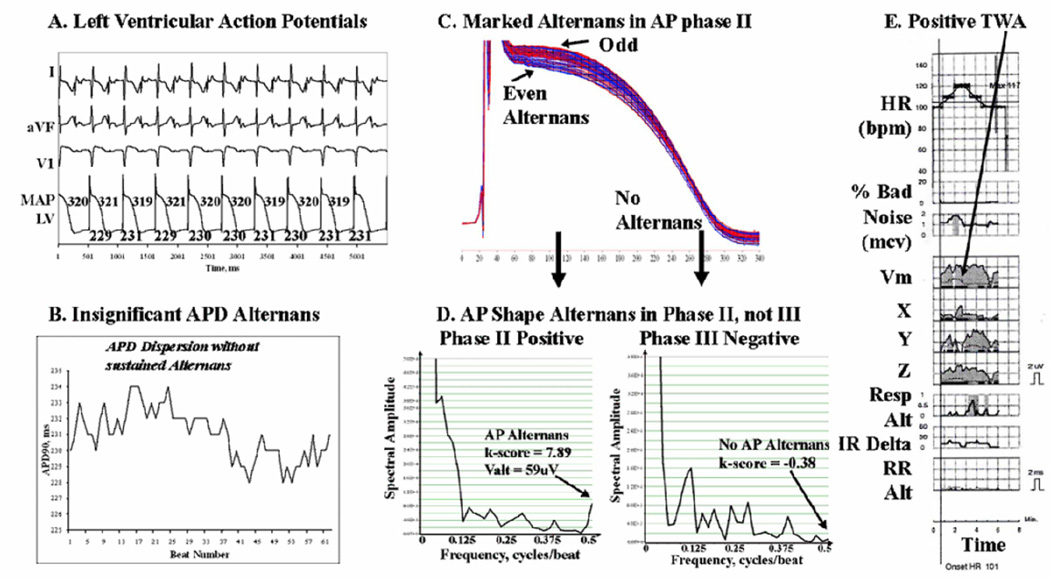
Alternans Predominates in AP Phase II of Left Ventricular APs in this 59 year old man with coronary disease and LVEF 21%. (A, B) APD does not oscillate during pacing. However, (C ) Marked AP amplitude alternans in phase II is seen (red/blue separation). (D) AP alternans occurs in phase II (arrowed: k-score=7.9, Valt=59µV) but is undetectable in phase III (k-score −0.38); APD variations were also minimal. (E) TWA was positive at this time (arrowed) in leads Y, Z and Vm. Same abbreviations as figure 1.
Analysis of Action Potential Alternans
Electrograms were exported at 16-bit digital resolution for offline analysis using custom software written in Labview (National Instruments, TX) by SMN.
AP alternans was computed spectrally as used for TWA . Using validated software (17), 64 contiguous APs were selected ≥20 beats after the onset of pacing, baseline corrected to a 10 ms segment starting 20 ms prior to AP onset, and aligned to phases 0-I. Successive APs were represented as 2-D matrices R (n, t), where n indicates beat number (0≤ n≤63), and t the timesample. A Fourier Transform (FFT) was used to compute power spectra across beats (arrow-wise in fig. 1) for each t, then spectra were summated across the AP (figure 1–figure 3).
Figure 3.
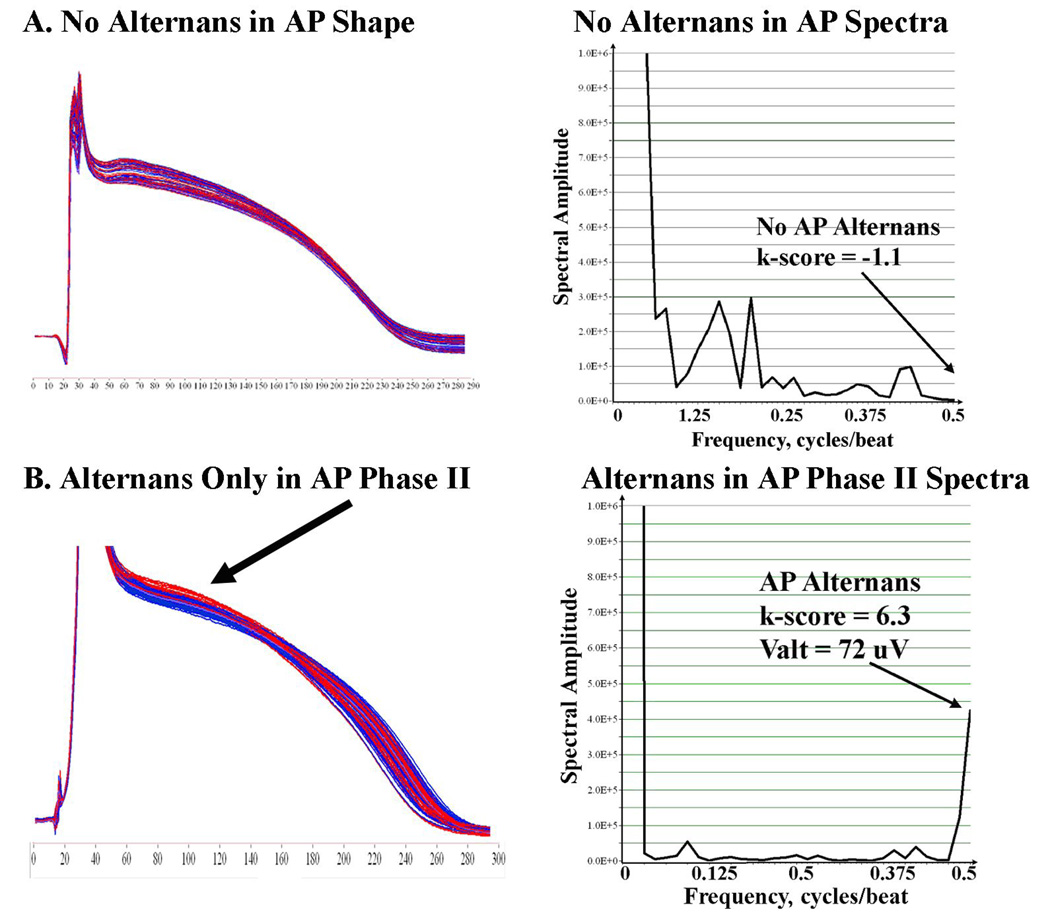
(A) No AP Amplitude alternans in a 66 year old male control patient with LVEF 66 % testing negative for TWA. AP Alternans k-score = − 1.1. (B) AP Phase II Alternans (k-score =6.3; Valt=72µV) in a 72 year old man with ischemic cardiomyopathy and LVEF 26%. Same abbreviations as figure 1.
AP amplitude was defined for phase II or III as the height above baseline. The magnitude of AP amplitude alternans was represented by the dimensionless k-score:
where ΣT is spectral magnitude at 0.5 cycles/beat, and μnoise and σnoise are the mean and SD of noise. Thus, k-score scales with the SD of noise. The noise window (0.33–0.49 Hz) was selected adjacent to alternans frequency (avoiding the 0.125-0.25 Hz respiratory peak), as with TWA. k>0 indicates that alternans exceeds noise (5). AP amplitude was also measured as the absolute voltage of alternation Valt (in µV), that is not scaled by noise SD, as:
We studied AP amplitude for the entire AP, i.e. from the end of the alignment window (phases 0-I) to the time of 90% repolarization (APD90), and for phase II (defined as the first half of this interval) and phase III (second half). We did not study phase I alternans because upstroke velocity is slower in MAPs than single cell APs and potentially unreliable (18), and because aligning beats to phases 0-I minimizes alternans.
Alternans of AP Duration (APD)
APD at 90% repolarization (APD90) was measured for these 64 beats with validated software (7). After identifying phase II (maximum plateau) and IV (diastolic) voltages, APD90 spanned the interval from phase 0 maximum dV/dt to 90% voltage recovery. Diastolic interval (DI) spanned the interval from APD90 of the prior beat to AP onset of the current beat. APD90 alternans was defined if variations in ≥5 beats had opposite sign (19).
Measurement of T-Wave Alternans
We analyzed ECG TWA using HearT-wave™ (Cambridge Heart, Bedford, MA) simultaneous with AP measurements. Each TWA report was classified by consensus from 3 blinded reviewers as positive, negative and indeterminate (5). We compared positive and negative TWA against alternans of AP amplitude alternans and APD alternans. For outcome analyses, we grouped positive and indeterminate tests as “abnormal” TWA (2).
Analysis of Activation restitution
In n=11 patients we measured activation time (AT) from RV apex to the second MAP site (LV, n=9; RV outflow tract, n=2) after progressively early extrastimuli (figure 4). AT is the difference in AP onset between sites. We used (DI, AT) pairs to plot AT restitution (20) as best-fit straight lines for (a) flat AT restitution (arbitrarily, absolute slope < 0.2); and (b) Lengthening AT (conduction slowing) at short DI. We report DI where AT begins to lengthen (4).
Figure 4.
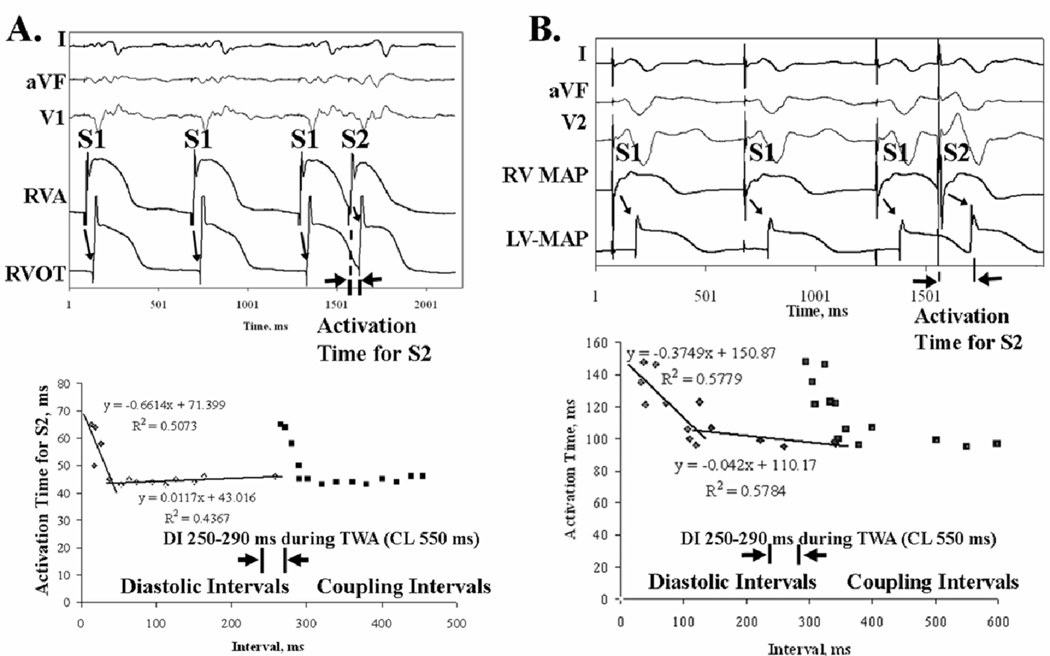
Conduction Does Not Vary (“Flat Restitution”) at 109 beats/min (i.e. DI ≈270–290 ms), measured as activation time from RV apical extrastimuli to a second MAP site. This was true for (A) Preserved Restitution, where AT prolonged only for very short DI (<40 ms) in a 55 year old man with LVEF 35%; and (B) Broad Restitution, where AT prolonged for DI < 120 ms in a 62 year old man with LVEF 31%. Both patients had coronary disease.
Computational Modeling
To study mechanisms explaining AP and T-wave alternans, a human LV transmural wedge preparation was developed with dimensions shown in Figure 5A. Membrane kinetics were represented by the Ten Tusscher-Panfilov (TTP) model of human ventricular tissue (14). Transmural heterogeneity in ion channel expression between the three cell layers was modeled according to Table 1 of Weiss et al (21). Intra- and extracellular components were coupled in 3D using a bidomain formulation and assigned conductivity values to produce transmural conduction velocities of 0.4m/s in endocardial and M-cell layers, and 0.28m/s in epicardium (22).
Figure 5.
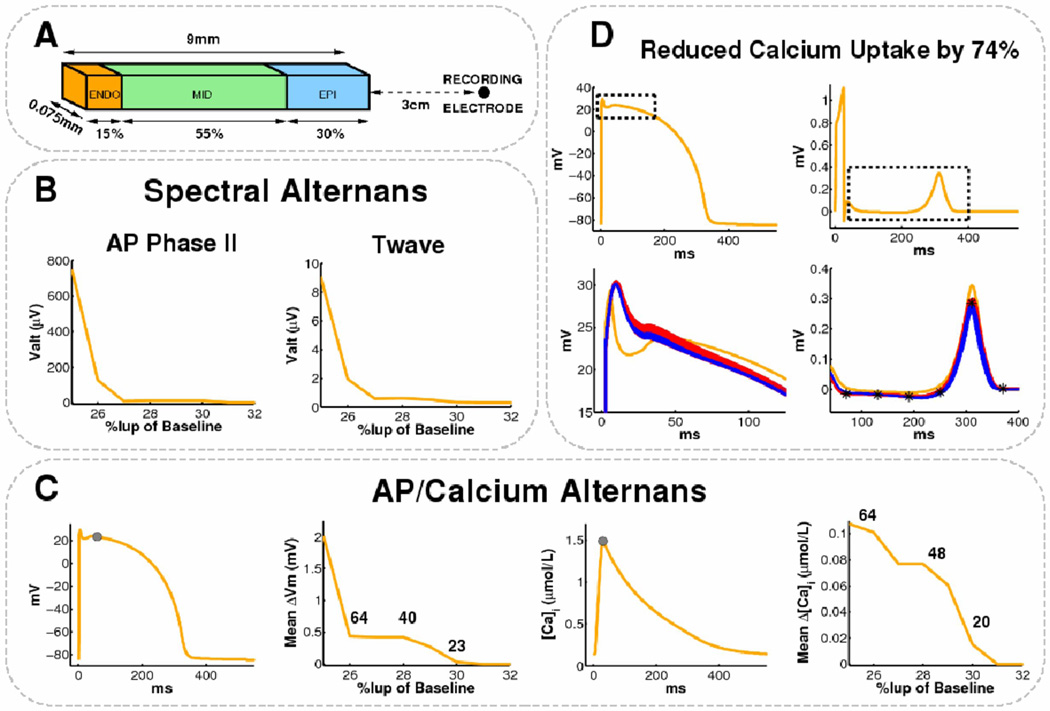
Modeled Reduction in Calcium Uptake above 70% (but not altered Ito or sodium channel inactivation) causes AP and T-wave alternans at 109 beats/min. (A) Human LV wedge dimensions. (B) Endocardial AP Alternans and TWA appear as Iup reduces to 0.25–0.30 of baseline. (C) Mean change in endocardial phase II amplitude (second panel) and peak-diastolic intracellular calcium (fourth panel) computed at locations indicated by the gray circles (first and third panels). The number of alternating beats out of 64 is indicated. (D) Top: Control endocardial AP and pseudo-ECG with bounding boxes depicting AP phase II and T-wave data ranges. Bottom: AP phase II and T-wave alternans for Iup reduced by 74% (odd:red, even:blue, control:orange). Note similarity to clinical alternans (figure 1, figure 2, figure 3B). T-wave locations used to compute TWA amplitude differences are denoted *.
Table 1.
Baseline Clinical Characteristics
| LV Dysfunction (n=53) | Preserved LV (n=18) | P | ||
|---|---|---|---|---|
| Age, y | 65.4±13.3 | 65.8±10.6 | 0.91 | |
| Gender, M/F | 52/1 | 15/3 | 0.02 | |
| Ejection Fraction, % | 28±8 | 58±12 | <0.001 | |
| Coronary disease, n | 47 | 4 | <0.001 | |
| Hypertension, n | 11 | 3 | 0.71 | |
| Diabetes Mellitus, n | 8 | 2 | 0.67 | |
| Na+, mmol/l | 136±17 | 139±2 | 0.14 | |
| K+, mmol/l | 4.4±0.5 | 4.2±0.4 | 0.12 | |
| Ca2+, mg/dl | 9.0±0.5 | 9.0±0.5 | 0.90 | |
| Mg2+, mmol/l | 2.1±0.2 | 2.0±0.2 | 0.30 | |
| HCO3−, mmol/l | 26±4 | 27±3 | 0.57 | |
| BNP, pg/ml | 640±825 | 131±282 | 0.02 | |
| Medication Use / % | ||||
| Beta Blockers | 39 | 7 | 0.01 | |
| ACE inhibitors/ARB | 47 | 11 | 0.01 | |
| Spironolactone | 10 | 1 | 0.18 | |
| CCB | 11 | 4 | 0.89 | |
| Digoxin | 21 | 2 | 0.03 | |
| Amiodarone | 5 | 1 | 0.61 | |
| Statins | 38 | 9 | 0.09 | |
Key: p-value is for comparisons between study and control groups. ACE, Angiotensin Converting Enzyme; ARB, Angiotensin Receptor Blockers; BNP, B-Type Natriuretic Peptide concentration; CCB, Calcium Channel Blockers; Statins, HMG-CoA reductase inhibitors.
As in the clinical protocol, the endocardium was paced for 84 beats at CL 550ms. Three sets of simulations were performed: i) control, ii) Iup, sarcoplasmic reticulum calcium uptake, scaled by 25–200%, and iii) τh, j, time constants of fast and slow sodium channel inactivation, scaled by 25–200%. These parameters were selected since 33–60% down-regulation of Iup protein has been reported in failing human myocytes (table 2 of (23)), and abnormal sodium inactivation may potentiate alternans (14,15). We modified Iup or τh, j simultaneously in all three cell layers of the LV wedge preparation prior to pacing.
Table 2.
Repolarization and Conduction Dynamics: Clinical Data
| LV Dysfunction | Preserved LV | P | ||
|---|---|---|---|---|
| T-Wave Alternans | <0.01 | |||
| Positive | 19 | 1 | ||
| Indeterminate | 14 | 3 | ||
| Negative | 20 | 14 | ||
| AP Amplitude Alternans | ||||
| Entire AP | k-score | 3.26±4.19 | −0.31±0.95 | 0.03 |
| Valt, µV | 49±116 | 11±4 | 0.65 | |
| Phase II | k-score | 3.66±4.48 | −0.44±0.77 | 0.02 |
| Valt, µV | 93±203 | 2.0±4.0 | 0.25 | |
| Phase III | k-score | 2.13±3.69 | −0.25±0.96 | 0.10 |
| Valt, µV | 27±57 | 2.0±3.4 | 0.26 | |
| APD90 During Pacing for TWA | ||||
| APD90, ms | 272±43 | 258±43 | 0.33 | |
| Diastolic Interval, ms | 278±43 | 293±43 | 0.33 | |
| APD alternans, no. Beats | 16±13 | 4±5 | 0.02 | |
| Mean ± SD (range, median) | (0 – 58, 14) | (0 – 12, 2.5) | ||
| Beat-to-beat magnitude, ms | 8±14 | 3±4 | 0.28 | |
| Activation Restitution | ||||
| DI below which AT prolonged | 54.0±41.0 | 35.0±35.4 | 0.59 | |
| Mean ± SD (range) | (20–120) | (10–60) | ||
| Restitution Slope (slowing phase) | −1.32±1.18 | −0.82±0.17 | 0.59 | |
Continuous data are presented as mean SD (median)
Pseudo-ECGs were computed at a centrally-located point 3cm from the epicardium (24). TWA was assigned if the voltage difference between successive T-waves alternated in sign and exceeded 1/500 of normal T-wave amplitude (25). Spectral analysis was used to quantify TWA and AP amplitude alternans (17), with AP measurements taken at the center of the endocardial, M-cell, and epicardial regions in the model.
Prospective Follow-up
LV dysfunction patients were followed prospectively for 949±553 days using 6 monthly device interrogations, electronic medical records and telephonic questionnaires until the first event or 07/27/07. No patient was lost to follow-up. Arrhythmia detection was programmed uniformly in ICD recipients (n=45), and events were verified by consensus. The primary endpoint was appropriate device therapy or sustained VT/VF. The secondary endpoint was the combined occurrence of ventricular arrhythmias or all-cause mortality.
Statistical Analysis and Sample Size Considerations
Continuous data are presented as mean±standard deviation (SD), and were compared between study and control subjects using the 2-tailed t-test. Paired variables were compared using the paired, 2-tailed t-test. The Fisher exact test was applied to contingency tables. Statistics were analyzed using SPSS software (Chicago, IL). Significance was assessed at a two-tailed alpha level of 0.05.
For the prospective study, we split the study population into a training set (first n=26) and a validation set (last n=27), based on alphabetical ordering (no patients were related). Receiver operating characteristic (ROC) analysis on the training set was used to define optimum cutpoints that were used to construct Kaplan-Meier survival curves for the validation set.
Results
Baseline characteristics are listed in Table 1.
Clinical Ventricular Action Potential Alternans
Figure 1A shows RV APs in a study patient with positive TWA. Figure 1C shows 64 consecutive superimposed beats, successively colored blue, red, blue and so on. Baseline correction and alignment was effective, yet phases II-III segregate into even (blue) and odd (red) populations, i.e. action potential amplitudes alternate. At each timepoint (arrows; only 3 shown for clarity), FFT across all 64 beats resulted in the spectrum (figure 1D) in which alternans is the magnitude at 0.5 cycles/beat (every-other-beat). Here, k-score=10.4. Figure 1B shows small magnitude oscillations in APD90 (3±1 ms) in this patient.
Alternans of Amplitude Is Not Uniform Within Action Potentials
Figure 2 illustrates non-uniform alternans within the LV action potential in a study patient. Across the entire AP, alternans k-score=2.23. However, even/odd beats oscillated more in phase II than III (fig. 2C). Comparing phases, amplitude alternans was present in phase II (k-score = 7.89) yet undetectable in phase III (k-score=−0.38) (fig. 2D). APD90 did not oscillate (fig. 2B) yet simultaneous TWA was positive (fig. 2E).
Figure 3A shows no RV AP alternans in a control patient with negative TWA. Figure 3B shows another example of AP amplitude alternans in phase II in a study patient with positive TWA.
Overall, AP amplitude alternans k-score was non-significantly higher in phase II than III in study patients (3.7±4.4 vs 2.1±3.7, p=0.057 paired t-test), but not controls (−0.4±0.8 vs 0.2±1.0, p=0.47).
AP Amplitude Alternans Between Ventricular Sites
In patients with dual-site recordings (n=11; 6 with cardiomyopathy), AP amplitude alternans was similar between RV apex, RV outflow tract and LV apex. Alternans k-scores for the entire AP were similar for RV apex versus RVOT (1.71±2.30 vs 1.93±3.39, p=0.76) or LV (−0.36±1.44 vs −0.11±0.39, p=0.79). We therefore pooled single-RV and -LV site data. In patients with dual-site recordings, we used data from the RV apex.
AP Amplitude Alternans Separated Study from Control Subjects
AP amplitude alternans was more prevalent, i.e. k-score > 0 (72 % vs 33 %; p=0.04), with higher magnitude (k-scores 3.26±4.20 vs −0.31±0.95; p=0.03) in study than control patients. AP amplitude alternans had higher magnitude in study than control groups in phase II (k-score: 3.66±4.48 vs −0.44±0.77, p=0.02) and, non-significantly, in phase III (k-score 2.13±3.69 vs −0.25±0.96, p=0.10; table II). Results were similar for Valt, although may not have reached significance because Valt is artifactually elevated if noise SD is high (table II).
Activation Time (Conduction) Restitution
In patients with ischemic cardiomyopathy, figure 4A shows preserved activation restitution, i.e. AT prolongs only for short DI <40 ms (slope −0.66), while figure 4B shows broad activation restitution, i.e. AT prolonged for DI up to 120 ms (slope −0.37). The DI range for which conduction slowed was <120 ms in study and <60 ms in control subjects (table II).
Thus, AT did not prolong for DI corresponding to ≤ 109 beats/min where TWA is measured (DI≈270–290 ms; figure 1–figure 3), so that conduction dynamics are unlikely to explain TWA.
AP Duration Alternans
APD alternans was presented intermittently for more beats in study (16±13 beats) than control patients (4±5 beats; p=0.015). Neither the number of alternating beats, nor the very small APD alternans amplitude (Table II) separated groups. The number of beats for which APD alternans was detected poorly predicted the primary endpoint (ROC area under curve 0.45).
Relationship of T-Wave Alternans to Intracardiac Measures
TWA was positive in 33 patients. Concordance between TWA and AP amplitude alternans (positive if k-score ≥1.47) was 78 % (kappa=0.48, p=0.002). The absolute values of AP amplitude alternans and simultaneous TWA (averaged across repolarization) varied linearly, and AP amplitude alternans was 1–2 orders of magnitude larger than TWA (AP amplitude alternans magnitude = 38.5 × TWA magnitude − 26.5; p=0.03), as in animal studies (26). The magnitude of AP amplitude alternans agreed with studies of human unipolar electrograms (27). TWA correlated poorly with APD alternans (p=0.60).
Mechanisms for AP Amplitude Alternans: Insights from Computational Modeling
AP amplitude and T-wave alternans arose simultaneously when Iup was reduced beyond the threshold ≥ 70% (figure 5B), and resembled clinical AP alternans (compare figs 5D vs 1-3B). Indeed, Iup reduction ≥ 74% caused sustained alternans in intracellular calcium, AP amplitude and TWA (Figure 5B). At 74% Iup reduction, modeled k-scores, Valt and intermittent APD90 alternans (figures 5BD, Table III) agreed with clinical observation (table II).
Table 3.
Repolarization Dynamics: Simulation Data
| Iup*0.26 | Control | ||
|---|---|---|---|
| AP Amplitude Alternans | |||
| Entire AP | k-score | 12.66 | 0.03 |
| Valt, µV | 198.1 | 9.30 | |
| Phase II | k-score | 5.24 | 0.01 |
| Valt, µV | 127.44 | 5.85 | |
| Phase III | k-score | 7.41 | 0.02 |
| Valt, µV | 151.64 | 7.22 | |
| Computed ECG TWA (Spectral) | |||
| k-score | 1.20 | 0.01 | |
| Valt, µV | 1.97 | 0.15 | |
| Presence of TWA | + | − | |
| APD90 During Pacing for TWA | |||
| APD90, ms | 325±2 | 334±1 | |
| Diastolic Interval, ms | 225±2 | 216±1 | |
| Beat-to-beat ΔAPD90, ms | 1.0±0 | 1.0±0 | |
| APD alternans, no. Beats | 13 | 0 | |
| Intracellular Calcium | |||
| Diastolic [Ca2+]i, µM | 0.22±0.00 | 0.14±0.00 | |
| Peak [Ca2+]i, µM | 0.50±0.05 | 1.44±0.03 | |
| Peak-Diastolic [Ca2+]i, µM | 0.28±0.05 | 1.30±0.03 | |
Continuous data presented as mean±SD.
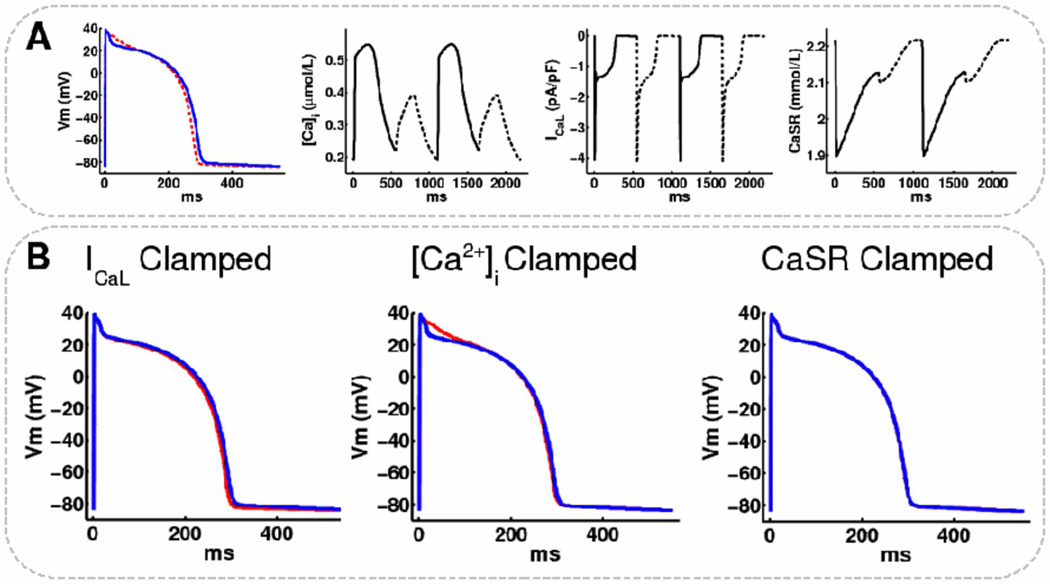
To further define the mechanism for AP amplitude alternans in phases II and III, we modified sarcoplasmic reticulum release current, Irel, and L-type calcium current, ICaL, from 25–200%. ICaL reduction ≥ 48% produced alternans in AP amplitude and intracellular calcium (data not shown). However, on clamping ICaL, [Ca]i or sarcoplasmic reticulum calcium (CaSR) in a single endocardial cell with reduced Iup (figure 6A), only clamping CaSR completely abolished AP alternans (figure 6B). As suggested by the modeling study of Livshitz and Rudy (10), we found that clamping [Ca]i abolished alternans in APD, but not in diadic subspace calcium (CaSS) and CaSR. Therefore, alternans in AP phase I-II amplitude persisted under this constraint by fluctuations in the calcium-dependent inactivation component (fCaSS) of ICaL.
Figure 6.
Sarcoplasmic reticulum calcium clamping abolishes alternans in modeled endocardial cells. (A) Even (solid) and odd (dashed) beats for a single endocardial cell at steady-state with Iup reduced by 70% showing alternans in: AP, intracellular calcium ([Ca]i), L-type calcium current (ICaL), and sarcoplasmic reticulum calcium (CaSR). (B) APs superimposed (even=blue, odd=red) for: Left: ICaL, Middle: [Ca]i, Right: CaSR, clamped to the even traces in A. Clamping to odd beats did not change the results.
AP amplitude alternans (and TWA) did not occur in any layer of control LV wedge, nor in cardiomyopathy with increased or decreased sodium inactivation (data not shown). Since APs in figure 5B suggest phase I alternans, we studied whether altering Ito magnitude and time constants for voltage dependent inactivation and activation by 25–200% could cause AP alternans. We were unable to demonstrate this (data not shown).
Finally, transmural conduction velocity did not vary by more than 0.1m/s in any LV wedge layer, and beat-to-beat variations were not observed at 109 beats/min with any modeled ionic changes.
AP Indices and Outcome
We assessed outcome in LV dysfunction patients, of whom 17 experienced the primary endpoint and 15 died. AP amplitude alternans predicted outcome when applied to the entire AP or phase II; we report the former because clinical surrogates (unipolar electrograms) exist for the entire MAP (27,28).
Patients reaching the primary endpoint had greater AP amplitude alternans than those who did not (k-score 5.4±4.1 vs 1.8±3.6; p=0.02). Patients reaching the secondary endpoint also had greater AP amplitude alternans than those who did not (k-score 4.4±4.9 vs 1.6±3.7; p=0.06).
From ROC analysis of the training set (n=26), AP amplitude alternans k-score ≥1.47 best predicted the primary endpoint and was defined as ‘positive’ (area under curve = 0.85). Confirming its validity, a nearly identical cutpoint (≥1.48) was obtained by ROC analysis of the entire LV dysfunction population (area under curve = 0.86). Using k≥1.47, AP amplitude alternans was 91% concordant between sites in patients with dual-site recordings (kappa=0.79). ROC analysis of the training set for AP amplitude alternans in phase II yielded a similar cutpoint (k≥1.51; area under curve 0.88).
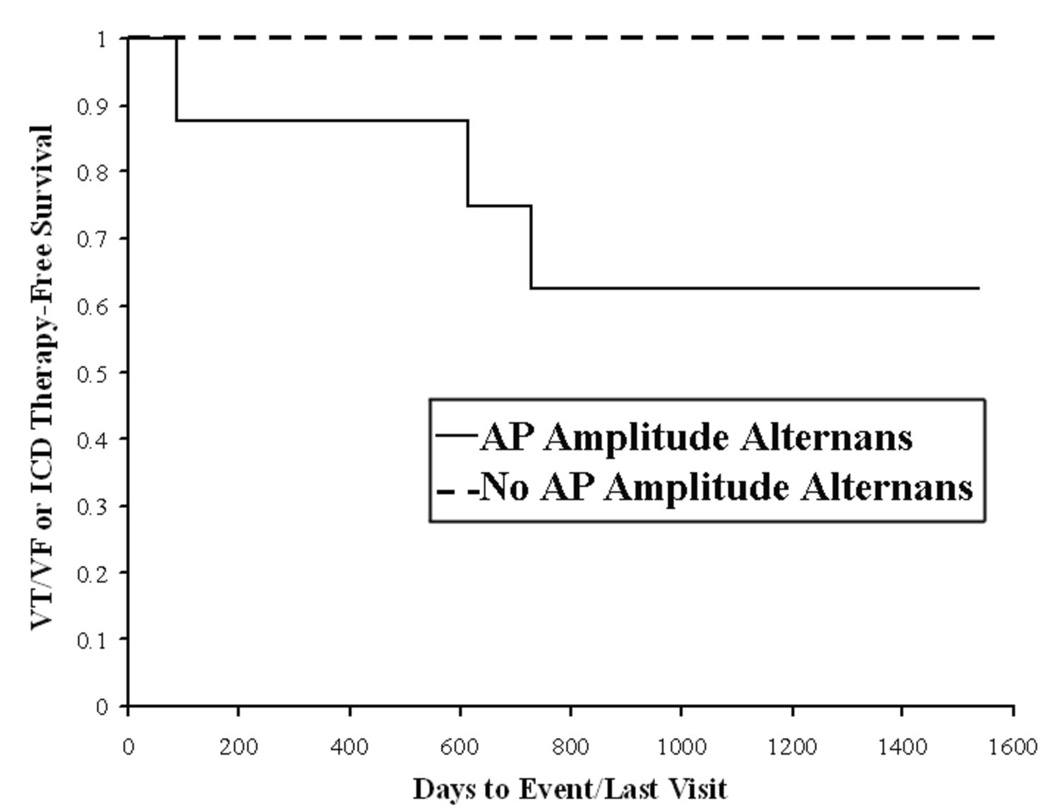
On Kaplan-Meier analysis of validation patients (n=27; 8 arrhythmic events, 9 deaths, figure 7), AP amplitude alternans k-score ≥ 1.47 separated patients with from those without the primary endpoint with 100 % sensitivity, 37 % specificity, 100 % negative predictive value and 40 % positive predictive value (p=0.04). The primary endpoint was also predicted by positive (p=0.03) and abnormal (p=0.02) TWA in all study patients. APD alternans at 109 beats/min did not predict the primary endpoint (p=0.53).
Figure 7.
AP Amplitude Alternans (k≥1.47) Prospectively Predicted Sustained VT/VF or ICD Therapy (in the validation sample) on Kaplan-Meier Analysis (p=0.04).
Discussion
Patients with systolic heart failure developed alternans of RV or LV action potential amplitudes at modest heart rate elevations that predicted malignant arrhythmias on long-term follow-up. Notably, while AP amplitude alternans (particularly in phase II) explained T-wave alternans, we found that AP duration and intra-ventricular conduction did not oscillate at slow heart rates. In computational models, reduced Iup to levels reported in failing myocytes agreed with our clinical data, and resulted from calcium oscillations. Moreover, clamping sarcoplasmic calcium abolished AP amplitude and T-wave oscillations. These results link malignant human ventricular arrhythmias with abnormal calcium cycling, and suggest the novel clinical use of AP amplitude alternans to indicate calcium overload and arrhythmic risk in heart failure patients.
Potential Mechanisms for Action Potential Alternans
AP amplitude alternans was more prevalent in heart failure patients than controls, particularly in those with subsequent VT/VF than those without. This was particularly true in AP phase II compared to phase III. These findings agree with data that human ventricular AP duration does not alternate at slow rates (7,8), and confirm human unipolar electrogram alternans reported by Selvaraj et al. (27) with differences likely due to wider spatial integration of unipolar electrograms and the largely epicardial alternans reported by Selvaraj et al.
Computational modeling showed that reduced Iup, to levels observed in failing myocytes (29), explained AP amplitude and T-wave alternans and linked them to cytosolic calcium oscillations. Although somewhat counter-intuitive, calcium oscillations may alter AP amplitude but not APD because varying constituents of calcium homeostasis have opposing effects on APD. Positive Ca-Vm coupling (where calcium transients prolong AP duration) may be opposed by negative Ca-Vm coupling (from INa-Ca in reverse mode, sarcoplasmic reticulum calcium release inactivation of ICa-L , or intracellular calcium-related enhancement of IKs) (11,30). In addition, our results may be influenced by defining phase III as the second half of the AP that may include the late AP plateau. Conversely, oscillations of APD arise at rapid rates (9,11) and reflect decreased IKr and sodium-calcium exchanger activity (10).
The absence of alternans with increased sodium inactivation is consistent with Panfilov et al (14). Although we did not find alternans with decreased sodium channel inactivation, unlike that study, this likely reflects flat APD and activation restitution at slow rates. Indeed, even in patients with infarct scar and broad activation restitution (figure 4B), and computationally, AT prolongation required shorter DI (i.e. faster rates than ≤ 109 beats/min). We acknowledge, however, that higher spatial resolution mapping is needed to definitively address regional conduction slowing.
Relationship Between Action Potential and T-wave Alternans
These data show that AP amplitude alternans predicts spontaneous VT/VF, and extend elegant studies of Selvaraj et al. (27) and Christini et al. (31) linking intracardiac alternans with TWA. Our results also suggest that intracardiac alternans from implanted devices (32) may indicate calcium overload and electrical instability in heart failure patients.
Concordance between AP amplitude and T-wave alternans agrees with prior reports (31), suggesting shared mechanisms. Nevertheless, TWA also likely reflects spatial non-uniformities in repolarization, as noted by ARI alternans (27) and colocalization of TWA near scar (33). Modeling showed that AP amplitude alternans was most marked in endocardial cells, that are characterized by a smaller maximum Ito conductance than other cells (0.073 vs 0.294 nS/pF (14)) and may explain phase II alternans. However, Selvaraj et al. found unipolar LV alternans in the epicardium (27); detailed intra-operative mapping may help to resolve these inconsistencies.
Magnitude Relationship of AP and T-Wave Alternans
AP amplitude alternans was 2 orders of magnitude larger than TWA, as in animals (26). Selvaraj et al. observed similar magnitude alternans in human unipolar activation-recovery intervals (40–70 µV peak differences in figure 1–figure 2 of (27)).
Limitations
Clinically, while this is the largest reported series of patients with ventricular MAPs to date, the population is small for outcome analysis, that reduces the precision of Kaplan-Meier estimates (computed for the entire study duration). Our results are limited by spatial resolution. Although this likely does not detract from our findings, additional sampling may refine analyses of regional repolarization and conduction dynamics. Third, although AP amplitude alternans k-scores differed significantly between groups, differences in Valt were not significantly different. This is explained by the large Valt range in study patients (table II), that likely reflects artifactual exaggeration of Valt when noise SD is high, while k-scores are scaled to noise. Fourth, cardiac motion, respiratory artifact or baseline wander could theoretically influence our analyses. However, our APs had consistent shape on raw superimposed tracings (fig. 1–fig. 3), while artifacts should not alternate, alternans showed high signal-to-noise ratio (optimal k-score 1.5 versus k≥3 in exercise- TWA (5)), and artifact would not track outcome. Fifth, cellular mechanisms could be influenced by medications and blood chemistry, yet these factors were similar between groups (table I). Our sample is also predominantly male.
A limitation of our modeling is the lack of realistic geometry and fiber anisotropy, which alters repolarization and the pseudo-ECG. However, this should not impact our findings that link cellular calcium with repolarization oscillations (shown to exist in single cells as well). Secondly, Iup is dependent various factors including sarcoplasmic reticulum Ca2+-ATPase, phospholamban, calmodulin, and CAMKII, yet, in the TTP model, Iup is a functional representation of all these factors. In vitro studies typically report SR Ca2+-ATPase protein levels, yet tissue inhibitors (e.g. dephosphorylated phospholamban (23)) may translate reported 33–60% protein reductions (23) into greater functional reductions in Iup. We are therefore comfortable that modeled Iup reductions (≥ 70%) are pathophysiologically plausible. Lastly, modeled phase III Valt was larger than observed clinically. Nevertheless, modeling agreed with observation that AP alternans was less common in phase III than II, and that APD alternans was intermittent and only a few milliseconds in magnitude. The discrepancy may reflect steeper descent of AP phase III in the TTP model (fig 5–fig 6) than in clinical MAPs (fig 1–fig 4), enabling substantial changes in phase III amplitude with less effect on APD. The TTP model may ineffectively represent the sensitivity of repolarizing potassium currents to intracellular calcium alterations in heart failure (11), that cause negative calcium-voltage coupling and the more gradual phase III descent seen clinically. For these reasons, we feel that these phase II/III differences do not detract from the similarity between modeled and clinical AP alternans (e.g. figs 5D versus 1-3B), and our mechanistic conclusions.
Conclusions
In patients with systolic heart failure, in vivo alternans of RV and LV action potential amplitudes at modest heart rate elevations predicted VT/VF and explained TWA. Computational models showed that reduced sarcoplasmic reticulum calcium uptake resulted in calcium oscillations that explained electrophysiologic alternans, and were eliminated by calcium clamping. These data suggest that AP amplitude alternans in heart failure patients is linked to malignant arrhythmias via abnormal calcium handling, and provides a novel clinical index of calcium overload and arrhythmic risk.
Acknowledgements
We are grateful to Kathleen Mills, BA, for coordinating and administering questionnaires for this study, and to Elizabeth Greer, RN, Stephanie Yoakum, RNP, and Stanley Keys, RCVT for helping with data collection. This study was funded by the Doris Duke Charitable Foundation, NIH (HL83359 and HL70529 “The Pathophysiology of T-wave Alternans”) and the American Heart Association (0265120Y) to SMN, and by NIH grants HL063195, HL082729, and HL067322 to NAT.
List of Abbreviations
- AP
Action Potential
- APD
Action Potential Duration
- AT
Activation Time
- DI
Diastolic Interval
- Irel
Sarcoplasmic Reticulum Release Current
- Ito
Transient Outward Current
- Iup
Sarcoplasmic Reticulum Calcium Uptake Current
- MAP
Monophasic Action Potential
- SCA
Sudden Cardiac Arrest
- TWA
T-wave Alternans
Footnotes
Publisher's Disclaimer: This is a PDF file of an unedited manuscript that has been accepted for publication. As a service to our customers we are providing this early version of the manuscript. The manuscript will undergo copyediting, typesetting, and review of the resulting proof before it is published in its final citable form. Please note that during the production process errors may be discovered which could affect the content, and all legal disclaimers that apply to the journal pertain.
Disclosures
Dr. Narayan has received speaking honoraria from Cambridge Heart Incorporated and has received speaking honoraria from St. Jude Medical, Boston Scientific and Medtronic Corporations.
References
- 1.Myerburg RJ, Castellanos A. Emerging paradigms of the epidemiology and demographics of sudden cardiac arrest. Heart Rhythm. 2006;3:235–239. doi: 10.1016/j.hrthm.2005.09.023. [DOI] [PubMed] [Google Scholar]
- 2.Narayan SM. T-Wave Alternans and The Susceptibility to Ventricular Arrhythmias: State of the Art Paper. J Am Coll Cardiol. 2006a;47:269–281. doi: 10.1016/j.jacc.2005.08.066. [DOI] [PubMed] [Google Scholar]
- 3.Koller ML, Maier SKG, Gelzer AR, Bauer WR, Meesmann M, Gilmour RF., Jr Altered Dynamics of Action Potential Restitution and Alternans in Humans With Structural Heart Disease. Circulation. 2005;112:1542–1548. doi: 10.1161/CIRCULATIONAHA.104.502831. [DOI] [PubMed] [Google Scholar]
- 4.Weiss JN, Karma A, Shiferaw Y, Chen P-S, Garfinkel A, Qu Z. From Pulsus to Pulseless: The Saga of Cardiac Alternans (Review) Circ Res. 2006;98:1244. doi: 10.1161/01.RES.0000224540.97431.f0. [DOI] [PubMed] [Google Scholar]
- 5.Bloomfield DM, Hohnloser SH, Cohen RJ. Interpretation and Classification of Microvolt T-Wave Alternans Tests. J. Cardiovasc Electrophysiol. 2002;13:502–512. doi: 10.1046/j.1540-8167.2002.00502.x. [DOI] [PubMed] [Google Scholar]
- 6.Anderson KP, Walker R, Dustman T, Fuller M, Mori M. Spontaneous Sustained Ventricular Tachycardia in the Electrophysiologic Study Versus Electrocardiographic Monitoring (ESVEM) Trial. Journal of the American College of Cardiology. 1995;26:489–496. doi: 10.1016/0735-1097(95)80027-e. [DOI] [PubMed] [Google Scholar]
- 7.Narayan SM, Franz MR, Kim J, Lalani G, Sastry A. T-wave Alternans, Restitution of Ventricular Action Potential Duration and Outcome. J Am Coll Cardiol. 2007f;50:2385–2392. doi: 10.1016/j.jacc.2007.10.011. [DOI] [PubMed] [Google Scholar]
- 8.Ashihara T, Yao T, Ito M, et al. Steep APD Restitution Curve is not Essential For Microvolt T-Wave Alternans: Insights From Computer Simulations (abstract) Heart Rhythm. 2007;4 AB43-1. [Google Scholar]
- 9.Eisner D, Li Y, O'Neill S. Alternans of intracellular calcium: mechanism and significance. Heart Rhythm. 2006;3:743–745. doi: 10.1016/j.hrthm.2005.12.020. [DOI] [PubMed] [Google Scholar]
- 10.Livshitz LM, Rudy Y. Regulation of Ca2+ and electrical alternans in cardiac myocytes: role of CAMKII and repolarizing currents. Am J Physiol Heart Circ Physiol. 2007;292:H2854–H2866. doi: 10.1152/ajpheart.01347.2006. [DOI] [PMC free article] [PubMed] [Google Scholar]
- 11.Laurita KR, Rosenbaum DS. Mechanisms and potential therapeutic targets for ventricular arrhythmias associated with impaired cardiac calcium cycling. J Mol Cell Cardiol. 2008;44:31–43. doi: 10.1016/j.yjmcc.2007.10.012. [DOI] [PMC free article] [PubMed] [Google Scholar]
- 12.Narayan P, McCune SA, Robitaille PM, Hohl CM, Altschuld RA. Mechanical alternans and the force-frequency relationship in failing rat hearts. J. Mol Cell Cardiol. 1995;27:523–530. doi: 10.1016/s0022-2828(08)80047-8. [DOI] [PubMed] [Google Scholar]
- 13.Wu T-J, Lin S-F, Weiss JN, Ting C-T, Chen P-S. Two Types of Ventricular Fibrillation in Isolated Rabbit Hearts: Importance of Excitability and Action Potential Duration Restitution. Circulation. 2002;106:1859–1866. doi: 10.1161/01.cir.0000031334.49170.fb. [DOI] [PubMed] [Google Scholar]
- 14.ten Tusscher K, Panfilov A. Alternans and spiral breakup in a human ventricular tissue model. Am J Physiol Heart Circ Physiol. 2006;291:H1088–H1100. doi: 10.1152/ajpheart.00109.2006. [DOI] [PubMed] [Google Scholar]
- 15.Dos Santos R, Campos F, Ciuffo L, Nygren A, Giles W, Koch H. ATX-II effects on the apparent location of M cells in a computational model of a human left ventricular wedge. J. Cardiovasc Electrophysiol. 2006;17 doi: 10.1111/j.1540-8167.2006.00389.x. [DOI] [PubMed] [Google Scholar]
- 16.Anh D, Srivatsa U, Bui HM, Vasconcellos S, Narayan SM. Biventricular pacing attenuates T-wave alternans and T-wave amplitude compared to other pacing modes. Pacing Clin Electrophysiol. 2008;31:714–721. doi: 10.1111/j.1540-8159.2008.01074.x. [DOI] [PubMed] [Google Scholar]
- 17.Narayan SM, Smith JM. Spectral Analysis of Periodic Fluctuations in ECG Repolarization. IEEE Transactions in Biomedical Engineering. 1999b;46:203–212. doi: 10.1109/10.740883. [DOI] [PubMed] [Google Scholar]
- 18.Franz MR, Burkhoff D, Spurgeon H, Weisfeldt ML, Lakatta EG. In Vitro Validation of a new cardiac catheter technique for recording monophasic action potentials. European Heart Journal. 1986;7:34. doi: 10.1093/oxfordjournals.eurheartj.a061954. [DOI] [PubMed] [Google Scholar]
- 19.Narayan SM, Bode F, Karasik PL, Franz MR. Alternans Of Atrial Action Potentials As A Precursor Of Atrial Fibrillation. Circulation. 2002b;106:1968–1973. doi: 10.1161/01.cir.0000037062.35762.b4. [DOI] [PubMed] [Google Scholar]
- 20.Narayan SM, Kim J, Tate C, Berman BJ. Steep Restitution of Ventricular Action Potential Duration and Conduction Slowing In Human Brugada Syndrome. Heart Rhythm. 2007d;4:1087–1089. doi: 10.1016/j.hrthm.2007.04.018. [DOI] [PubMed] [Google Scholar]
- 21.Weiss D, Seeman G, Keller D, Farina D, Sachse FD, O Modeling of Heterogeneous Electrophysiology in the Human Heart with Respect to ECG Genesis. Computers in Cardiology, IEEE Press. 2007;34:49–52. [Google Scholar]
- 22.Poelzing S, Akar JG, Baron E, Rosenbaum DS. Heterogeneous connexin43 expression produces electrophysiological heterogeneities across ventricular wall. Am. J. Physiol. Heart Circ Physiol. 2004a;286:H2001–H2009. doi: 10.1152/ajpheart.00987.2003. [DOI] [PubMed] [Google Scholar]
- 23.Hasenfuss G, Meyer M, Schillinger W, Preuss M, Pieske BJ, H Calcium handling proteins in the failing human heart. Basic Res Cardiol. 1997;92:87–93. doi: 10.1007/BF00794072. [DOI] [PubMed] [Google Scholar]
- 24.Gima K, Rudy Y. Ionic current basis of electrocardiographic waveforms: a model study. Circulation Research. 2002;90:889–896. doi: 10.1161/01.res.0000016960.61087.86. [DOI] [PMC free article] [PubMed] [Google Scholar]
- 25.Adachi K, Ohnishi Y, Shima T, et al. Determinant of Microvolt-level T-wave Alternans in Patients with Dilated Cardiomyopathy. J Am Coll Cardiol. 1999;34:374–380. doi: 10.1016/s0735-1097(99)00208-9. [DOI] [PubMed] [Google Scholar]
- 26.Pastore JM, Girouard SD, Laurita KR, Akar FG, Rosenbaum DS. Mechanism Linking T-wave alternans to the Genesis of Cardiac Fibrillation. Circulation. 1999;99:1385–1394. doi: 10.1161/01.cir.99.10.1385. [DOI] [PubMed] [Google Scholar]
- 27.Selvaraj RJ, Picton P, Nanthakumar K, Mak S, Chauhan VS. Endocardial and Epicardial Repolarization Alternans in Human Cardiomyopathy: Evidence for Spatiotemporal Heterogeneity and Correlation with Body Surface T wave Alternans. J. Am. Coll. Cardiol. 2007;49:338–346. doi: 10.1016/j.jacc.2006.08.056. [DOI] [PubMed] [Google Scholar]
- 28.Yue AM, Paisey JR, Robinson S, Betts TR, Roberts PR, Morgan JM. Determination of Human Ventricular Repolarization by Noncontact Mapping: Validation with Monophasic Action Potential Recordings. Circulation. 2004;110:1343–1350. doi: 10.1161/01.CIR.0000141734.43393.BE. [DOI] [PubMed] [Google Scholar]
- 29.Hasenfuss G, Reinecke H, Studer R, et al. Relation between myocardial function and expression of sarcoplasmic reticulum Ca(2+)-ATPase in failing and nonfailing human myocardium. Circ Res. 1994;75:434–442. doi: 10.1161/01.res.75.3.434. [DOI] [PubMed] [Google Scholar]
- 30.Mahajan A, Sato D, Shiferaw Y, et al. Modifying L-type calcium current kinetics: consequences for cardiac excitation and arrhythmia dynamics. Biophys. J. 2008;94:411–423. doi: 10.1529/biophysj.106.98590. [DOI] [PMC free article] [PubMed] [Google Scholar]
- 31.Christini DJ, Stein KM, Hao SC, et al. Endocardial Detection of Repolarization Alternans. IEEE Trans Biomed Eng. 2003;50:855–862. doi: 10.1109/TBME.2003.813535. [DOI] [PubMed] [Google Scholar]
- 32.Swerdlow CD, Zhou X, Voroshilovsky O, Abeyratne A, Gillberg JM. High Amplitude T-Wave Alternans Precedes Spontaneous Ventricular Tachycardia or Fibrillation in ICD Electrograms. Heart Rhythm. 2008;5:670–676. doi: 10.1016/j.hrthm.2008.02.018. [DOI] [PubMed] [Google Scholar]
- 33.Narayan SM, Smith JM, Lindsay BD, Cain ME, Davila-Roman VG. Relation of T-Wave Alternans to Regional Left Ventricular Dysfunction and Eccentric Hypertrophy Secondary To Coronary Artery Disease. Am. J. Cardiol. 2006b;97:775–780. doi: 10.1016/j.amjcard.2005.09.127. [DOI] [PubMed] [Google Scholar]


