

Abstract
Chlorella vulgaris (CV) has been reported to have antioxidant and anticancer properties. We evaluated the effect of CV on apoptotic regulator protein expression in liver cancer-induced rats. Male Wistar rats (200~250 g) were divided into eight groups: control group (normal diet), CDE group (choline deficient diet supplemented with ethionine in drinking water to induce hepatocarcinogenesis), CV groups with three different doses of CV (50, 150, and 300 mg/kg body weight), and CDE groups treated with different doses of CV (50, 150, and 300 mg/kg body weight). Rats were sacrificed at various weeks and liver tissues were embedded in paraffin blocks for immunohistochemistry studies. CV, at increasing doses, decreased the expression of anti-apoptotic protein, Bcl-2, but increased the expression of pro-apoptotic protein, caspase 8, in CDE rats, which was correlated with decreased hepatoctyes proliferation and increased apoptosis as determined by bromodeoxy-uridine (BrdU) labeling and terminal deoxynucleotidyl transferase mediated dUTP nick-end labeling (TUNEL) assay, respectively. Our study shows that CV has definite chemopreventive effect by inducing apoptosis via decreasing the expression of Bcl-2 and increasing the expression of caspase 8 in hepatocarcinogenesis-induced rats.
Keywords: Chlorella vulgaris (CV), Apoptosis, Bcl-2, Caspase 8, Liver cancer
INTRODUCTION
Hepatocellular carcinoma (HCC) accounts for approximately 85% of the primary malignant tumors of the liver (Kew, 2002). HCC is the fifth most common malignancy in the world and is the third most common cause of cancer-related death worldwide (Okuda, 2000; Kew, 2002). Korea has the highest incidence of liver cancer in the world (Park, 2005). In Malaysian subcontinent, malignant neoplasm (cancer) is the third most common disease after septicemia and cardivascular disease (National Cancer Registry of Malaysia, 2003). Chronic infection with hepatitis B and hepatitis C, aflatoxin B1, chronic alcohol consumption, and liver cirrhosis have all been implicated in the pathogenesis of liver cancer (Yuspa and Poirier, 1988; Schafer and Sorrell, 1999).
Cancer is caused by an imbalance in the rate of proliferation and apoptosis or cell death. Apoptosis can affect the tumor growth in one or more stages in carcinogenesis. Apoptosis is a form of programed cell death characterized by morphological changes in cells executed by cysteine-aspartate proteases (caspases) and regulated by the Bcl-2 family of proteins (Coultas and Strasser, 2003; Hanson et al., 2008) involved in the signal transduction pathways.
A good chemopreventive agent is a naturally occurring agent that can induce apoptosis in cancer cell without much side effects (Surh, 1999). Chlorella vulgaris (CV) is a unicellular green microalgae that has been widely used for centuries as a food source with complete nutrients, such as carbohydrate, protein, vitamins and minerals, and is marketed commercially as health supplement or incorporated in food such as cereals (Haperin et al., 2003). In an animal study, CV has been shown to have anti-atherogenic, anti-cholesterolemic, anti-inflammatory, and antitumor effects (Sano and Tanaka, 1987; Hasegawa et al., 2000). It has also been shown to induce apoptosis and oxidative damage in HepG2 cells (Md Saad et al., 2006). In the present study, we examined CV as a chemopreventive agent against liver cancer cells via regulation of apoptotic protein, caspase 8 and anti-apoptotic regulator protein, Bcl-2, and correlated these findings with apoptotic rate and proliferation index.
MATERIALS AND METHODS
Animals, chemicals and treatment
A total of 96 male Wistar rats (200~250 g) were obtained from Animal Care Unit, Universiti Kebangsaan Malaysia (Kuala Lumpur, Malaysia), and were lodged in polycarbonate cages in a room with controlled temperature, humidity, and light-dark-cycle. All experiments were conducted following the guidelines of National Institute of Health for the Care and Use of Laboratory Animals. The study was approved by the Animal Ethics Committee of Faculty of Medicine, Universiti Kebangsaan Malaysia.
Rats were divided into eight groups in terms of diet given, with six rats each. The rats in the control group were given both normal diet and drinking water (normal rat chow from Gold Coin, Malaysia). According to the method of Akhurst et al.(2001), the rats in liver cancer-induced group (CDE group) were given choline deficient diet (ICN Biochemicals, USA) supplemented with 0.1% (w/v) ethionine (Sigma Chemical Co., USA) in drinking water. 0.1% (w/v) ethionine was added in drinking water, instead of being supplemented in the pellet, to reduce the risk of mortality upon administration to the rats and to minimize the exposure of the carcinogen. The rats in three groups (CV50, CV150, and CV300) were administered CV alone in three different doses (50, 150 and 300 mg/kg body weight), respectively. They were given 0.1, 0.3, and 0.6 ml of 10% (w/v) CV (100 g of CV diluted in 1 L of hot water) per day via gavage to represent 50, 150, and 300 mg/kg body weight, respectively. The rats in three CDE groups (CDE+CV50, CDE+CV150, and CDE+CV300) were treated with three different doses of CV (50, 150, and 300 mg/kg body weight). The duration of the experiment was 3 months and the rats were sacrificed at 0, 8, and 12 weeks. Animals were anesthetized for liver perfusion procedure prior to excision of the liver. Liver tissue was excised and fixed in formalin and embedded in paraffin for immunohistochemistry work.
Culture of Chlorella vulgaris (CV)
Stock of Chlorella vulgaris Beijerinck (strain 072) was obtained from the University of Malaya Algae Culture Collection (UMACC, Malaysia) and grown in Bold Basal Media (BBM) (12-h dark:12-h light cycle). The algae were centrifuged 3 times at 3000 r/min for 10 min at 4 °C to separate from the media. The pelleted algae were then diluted in distilled water at three different doses (50, 150, and 300 mg/kg body weight) before use.
Hematoxylin and eosin (H&E) staining
Paraffin embedded, formalin-fixed tissues were sectioned at 3-µm thickness and placed on poly-L-lysine covered slides. The sections were deparaffinized and hydrated with sequential washes in xylene and alcohol. The nuclei were stained by immersing in Mayer’s hematoxylin solution (Lab Vision Corp., UK) for 8 min and rinsed under running tap water. The slides were then dipped in 1% (v/v) acid alcohol to remove excess hematoxylin followed by immersing in 2% (w/v) sodium acetate. The slides were rinsed in running water and eosin for 5 min to stain the cytoplasm of the tissue. Finally, the slides were dehydrated through a series of graded alcohols and mounted with dibutylphathalate xylene (DPX).
Immunohistochemistry staining for Bcl-2
Bcl-2 was detected by the indirect method using DAKO antigen retrieval solution (DAKO, USA). Mouse anti-human Bcl-2 oncoprotein clone 124 was purchased from DakoCytomation, Denmark. Paraffin-embedded tissues were sectioned into 3-µm thickness. After deparaffinization, the slides were immersed in target retrieval solution (pH 9.0) and heated in water bath for 20 min at 98 °C to retrieve masked antigens. The sections were then treated with 3% (v/v) hydrogen peroxide for 10 min at room temperature to block endogenous peroxidase followed by rinsing in Tris-buffered solution (TBS) and 3% (w/v) bovine serum albumin (BSA) to block non-specific binding. The slides were incubated for 30 min with the primary antibody (Bcl-2, 1:50 dilution) followed by thorough rinsing in TBS. The tissues were then incubated with the secondary antibody, anti-mouse IgG conjugated horse radish peroxidase (HRP), for 30 min. Negative control slides in the absence of primary antibody were included for each staining. Human tonsil tissue was kept as a positive control for Bcl-2. Finally, 3,3′-diaminobenzidine (DAB; Sigma, St. Louis, MO) was used to develop the colour, and haematoxylin was used for counterstaining. Positive staining was recorded when more than 5% of cells were stained (Crawford et al., 1998). The mean percentage of positive staining in the cytoplasm of liver tissues was determined in at least 10 areas at 400× magnification.
Immunohistochemistry staining for caspase 8
Detection of caspase 8 was according to Labeled StreptAvidin Biotinated (LSAB) method. The sections were deparaffinized, hydrated, and treated with 3% (v/v) hydrogen peroxides for 10 min to quench endogenous peroxidase activity. Thereafter, the sections underwent microwave exposure in target retrieval solution (pH 9.0) for 20 min to retrieve antigenicity. Rabbit polyclonal caspase 8 (Abcam, UK) was used as the primary antibody (1:100 dilution). After 1 h incubation at room temperature, the slides were immersed in 3% (w/v) biotin [3 g biotin (Merck, Darmstadt, German) is diluted in 100 ml of diluted egg white] and egg yolks (diluted in TBS) to block endogeneous biotin and avidin, respectively. The slides were then incubated with biotinylated anti-rabbit antibody for 15 min, followed by streptavidin-HRP for 15 min (LSAB Kit from DakoCytomation, Denmark). The DAB was used to develop the colour and the sections were lightly counterstained with hematoxylin. The slides were then dehydrated through a graded series of alcohols and mounted in mounting medium. Human gastric tissue was included as a positive control for caspase 8 in each run, and negative controls were the slides omitted with the primary antibody. Analysis of caspase 8 expression was determined by an average of positively stained liver cells in 10 areas at 400× magnification.
Bromodeoxy-uridine (BrdU) labeling and immunohistochemical detection
BrdU labeling and immunohistochemical detection of proliferating hepatocytes were performed according to the manufacturer’s instruction (DAKO, USA). The rats were injected with BrdU (100 mg/kg body weight) 24 h prior to sacrifice. The liver tissues were excised and fixed in 10% (w/v) formalin and embedded in paraffin wax. BrdU that gets incorporated into the newly synthesized DNA was detected using specific monoclonal antibodies raised against BrdU. The tissue sections were mounted on the coated slides, deparaffinized in a graded series of alcohols, and rehydrated. The slides were then incubated for 5 min in 3% (v/v) H2O2 to block endogenous peroxidase activity. After several washings in TBS (pH 7.4), the tissues were treated with target retrieval high pH for 20 min at 98 °C. Primary mouse anti-BrdU (DAKO, USA) was subsequently applied for 30 min at 37 °C at 1:100 dilution. The tissues were washed thoroughly with TBS (pH 7.4) before application with secondary rabbit anti-mouse antibody conjugated with HRP (1:100 dilution) for 30 min. Finally, the slides were developed using DAB and counter-stained with H&E. Proliferation index was evaluated at 400× magnification in 10 different fields of at least 1000 cells in each field.
Terminal deoxynucleotidyl transferase mediated dUTP nick-end labeling (TUNEL) assay
TUNEL assay was used to identify double stranded DNA fragmentation, characteristic of DNA degradation by apoptosis. TUNEL detection kit (Promega, USA) was used according to the manufacturer’s directions. The tissue sections were mounted on the coated slides, deparaffinized in a graded series of alcohols, rehydrated, and pretreated with proteinase K (20 µg/ml) for 15 min at 37 °C. After quenching endogenous peroxidase activity with 3% (v/v) H2O2 and rinsing in TBS, terminal deoxynucleotidyl transferase (TdT) was subsequently applied for 1 h at 37 °C in biotynylated nucleotide mix and equilibration buffer (Tris acetate (pH 7.9), 50 mmol/L potassium acetate, 10 mmol/L magnesium acetate, 1 mmol/L dithiothreitol, 0.25 mmol/L CoCl2, 24 µmol/L biotin-dATP). The tissues were then blocked with stop/wash buffer, and incubated with 100 µl streptavidin-HRP (1:500 dilution) for 30 min at room temperature. Finally, after several washings in TBS (pH 7.4), the slides were developed using DAB and counterstained with H&E. Apoptotic index was evaluated at 400× magnification in 10 different fields of at least 1000 cells in each field.
Statistical analysis
Mean percentages of stained cells from all groups were counted and bar graphs plotted. Significant differences among the groups were analyzed by using Statistical Package for the Social Sciences (SPSS) software version 11.0 at the significant level of P<0.05.
RESULTS
Incidence of liver tumors in CDE-induced rats
Table 1 shows the presence of gross liver preneoplastic nodules in CDE rats after 12 weeks with size ranging from 0.1 to 0.5 cm in diameter. The presence of liver nodules was more prominent at 12 weeks compared with that at 8 weeks. The number of liver nodules showed a significant decrease when higher doses of CV were supplemented to rats, with a reduction to 67%, 33%, and 17% at 50, 150, and 300 mg/kg body weight, respectively.
Table 1.
The presence of preneoplastic nodules in CDE rats treated with Chlorella vulgaris at 12 weeks of experiment
| Group | nt | nn | Incidence of nodules (%)* | Nodule size (cm) |
| Control | 6 | 0 | 0 | 0 |
| CDE | 6 | 6 | 100 | 1 |
| CV50 | 6 | 0 | 0 | 0 |
| CV150 | 6 | 0 | 0 | 0 |
| CV300 | 6 | 0 | 0 | 0 |
| CDE+CV50 | 6 | 4 | 67 | <0.5 |
| CDE+CV150 | 6 | 2 | 33 | <0.3 |
| CDE+CV300 | 6 | 1 | 17 | <0.1 |
n t: total number of rats examined; n n: number of rats with nodules;
Incidence of nodules: n n/n t×100%
H&E staining
Fig.1a shows normal morphology of hepatocytes, Kupfer cells, and sinusoids lining in the control group, while Fig.1b shows abnormal morphology of liver tissues in the CDE group with the presence of numerous oval cells (scanty cytoplasm with large nucleus), which are precursors of liver cancer cells.
Fig. 1.
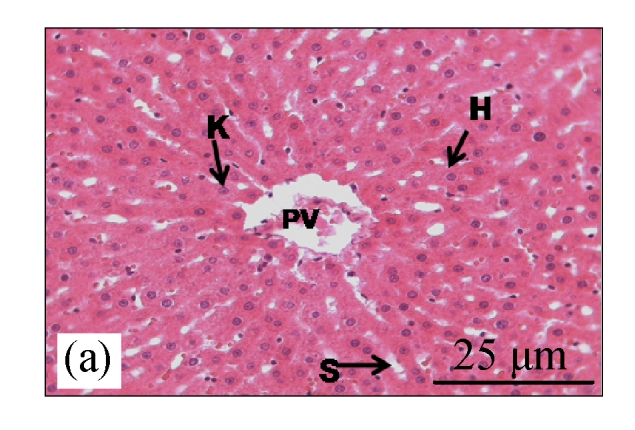
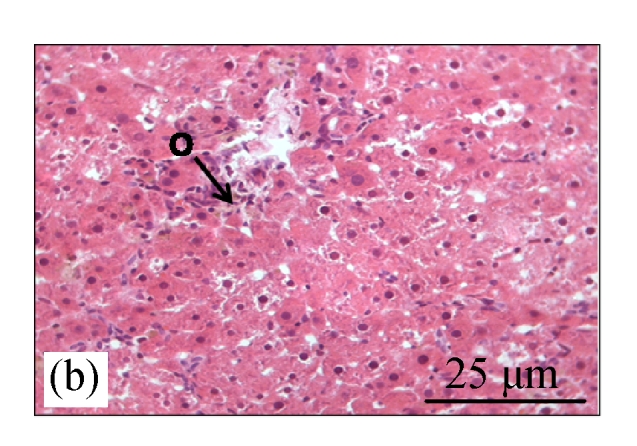
H&E staining on liver tissues of (a) control group (normal diet given) and (b) CDE group (liver cancer was induced with 0.1% (w/v) ethionine in drinking water plus choline deficient diet) without treatment of CV
H: hepatocyte; K: Kuppfer cell; PV: portal vein; S: sinusoid; O: oval cell
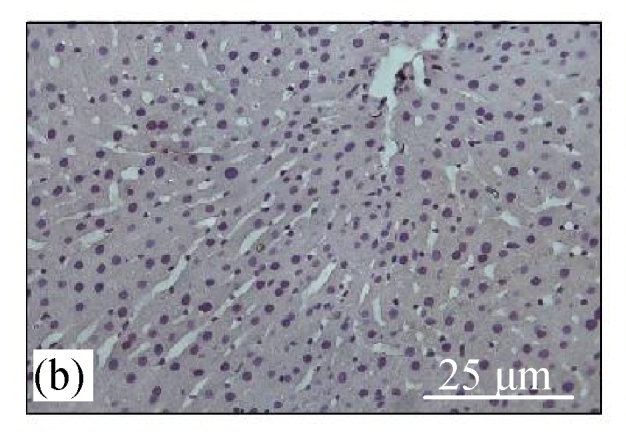
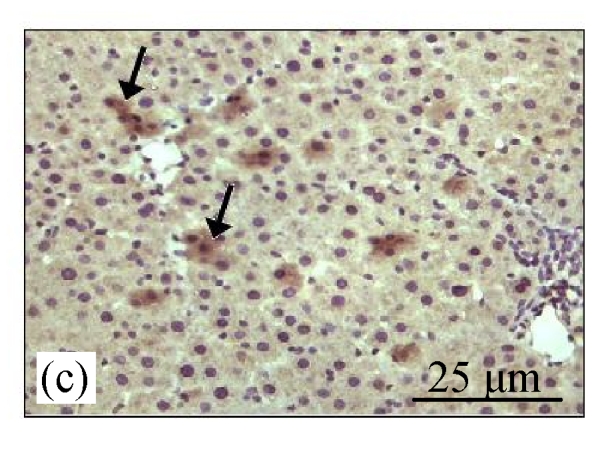
Immunohistochemistry staining for Bcl-2
Fig.2a shows the positive expression of Bcl-2 with clear dark brown color on the germinal layer of tonsil tissue under 400× magnification. There were no Bcl-2 expressions in the liver tissues of the control group (Fig.2b) and the CV300 group (Fig.2d). The liver tissues from the CDE group (Fig.2c) and the CDE+CV300 group (Fig.2e) at 8 weeks were positive for Bcl-2 immunostaining in the cytoplasm; however, the frequency of Bcl-2 staining in the CDE+CV300 group was reduced compared with that in the CDE group. Analysis of Bcl-2 expressions by different diet groups at 8 and 12 weeks is shown in Fig.3. There were no Bcl-2 expressions observed in the liver tissues of control and all CV groups; however, Bcl-2 expressions were seen in the CDE group at both 8 and 12 weeks (Fig.3, see page 19). Expression of Bcl-2 decreased with increasing concentration of CV administered to CDE rats at 12 weeks: 75%, 58.33%, and 0% expressions of Bcl-2 in CDE+CV50, CDE+CV150, and CDE+CV300 groups, respectively. Bcl-2 expression was completely blocked at a higher dosage of CV (300 mg/kg body weight).
Fig. 2.
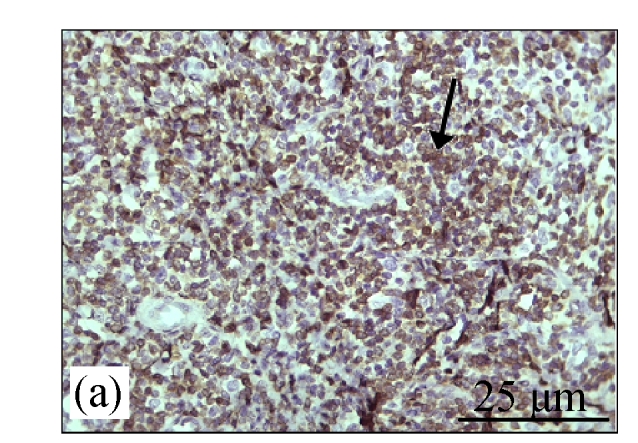
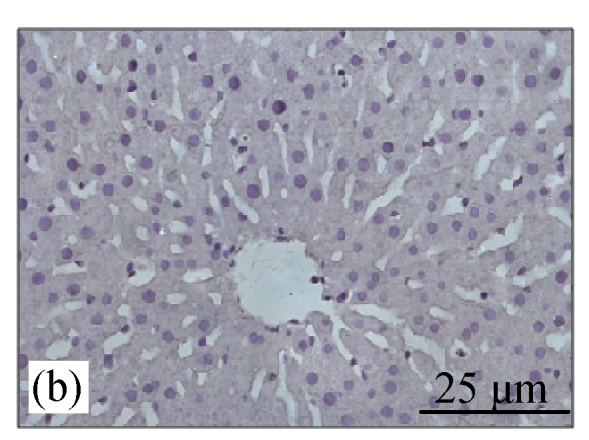
Immunohistochemistry staining for Bcl-2 at 8 weeks. (a) The human tonsil tissue showed positive staining for Bcl-2; (b) Control group (normal diet given); (c) CDE group; (d) CV300 group; (e) CDE+CV300 group
The arrows showed cytoplasmic pattern of Bcl-2 expression
Fig. 3.

Analysis of Bcl-2 expression in different diet groups at 8 and 12 weeks
Values are expressed as mean±SEM. aSignificant different (P<0.05) compared with the control group at the same week; bSignificant different (P<0.05) compared with the CDE group at the same week. Groups: 1: Control; 2: CDE; 3: CV50; 4: CV150; 5: CV300; 6: CDE+CV50; 7: CDE+CV150; 8: CDE+CV300
Immunohistochemistry staining for caspase 8
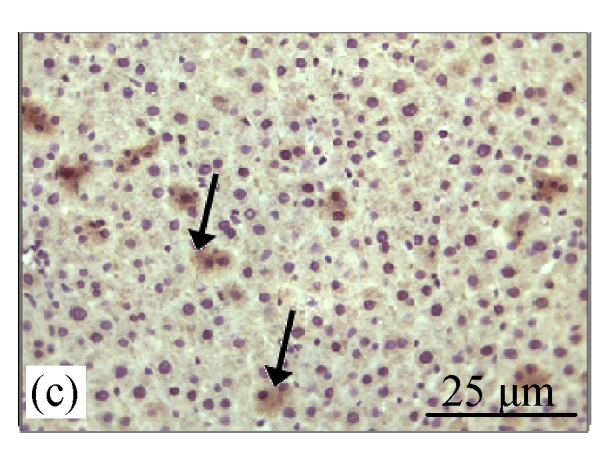
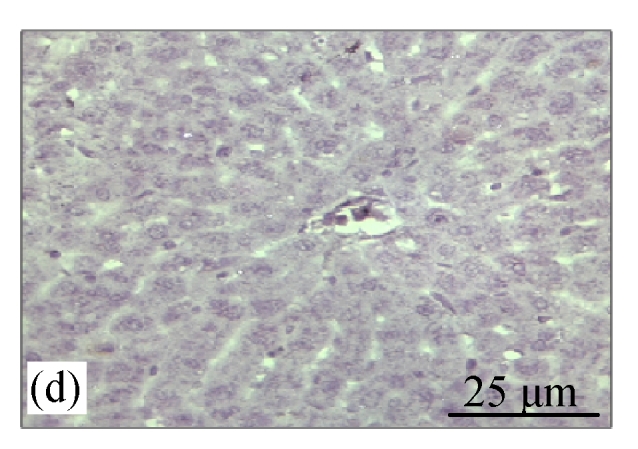
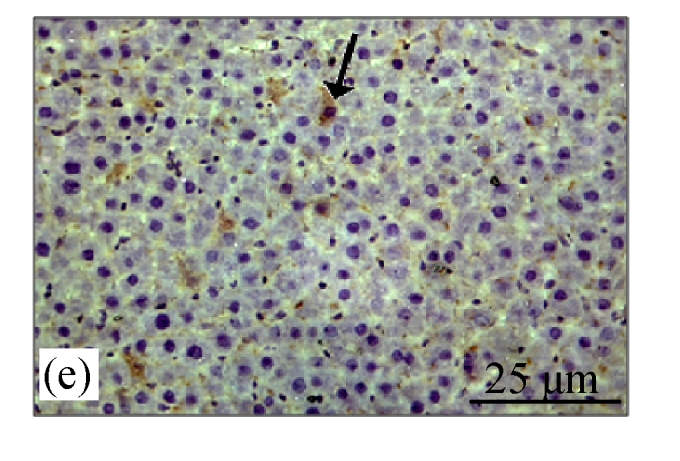
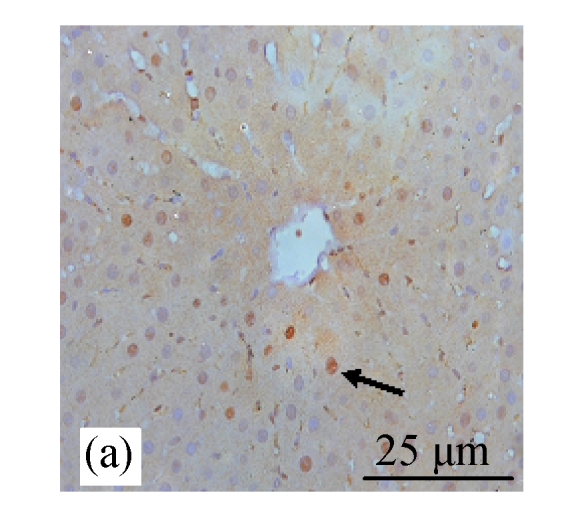
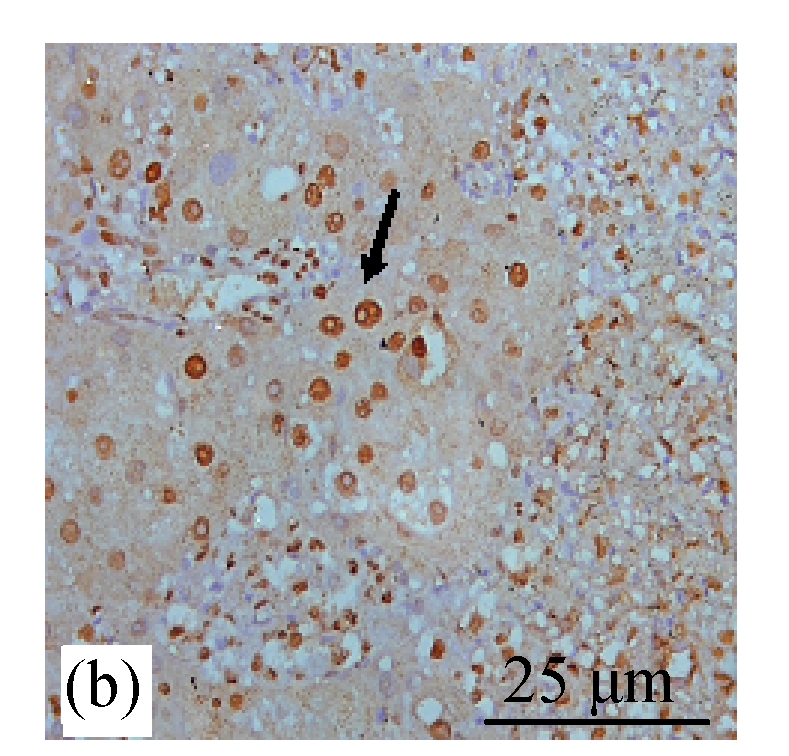
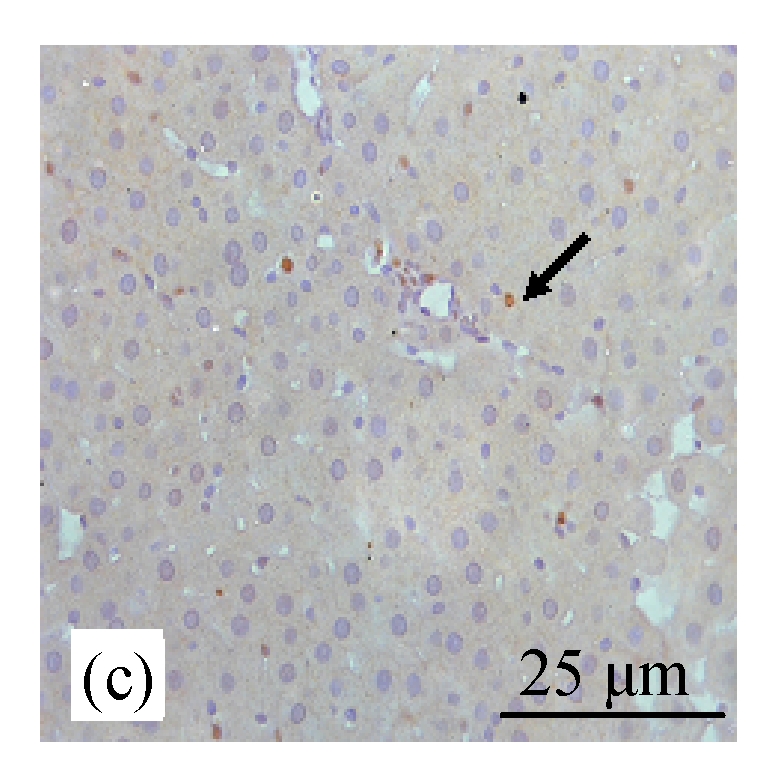
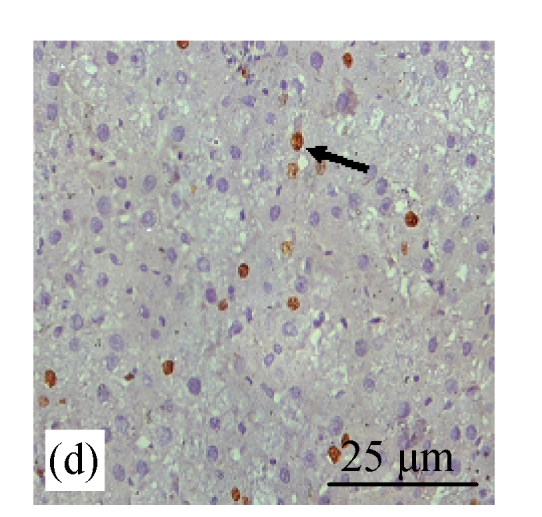
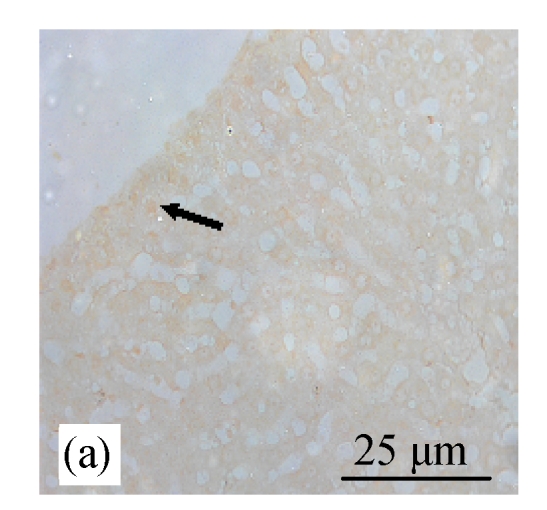
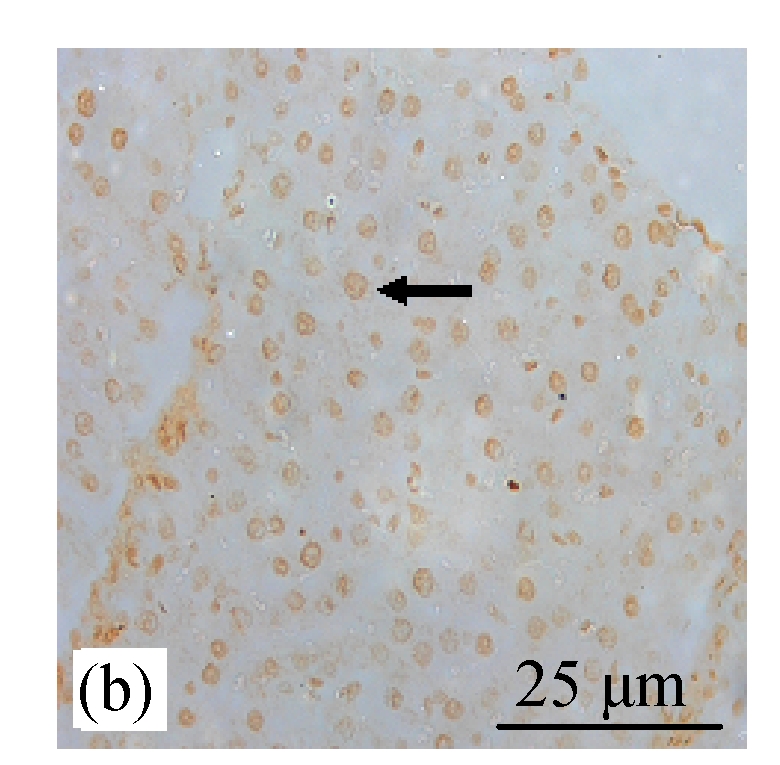
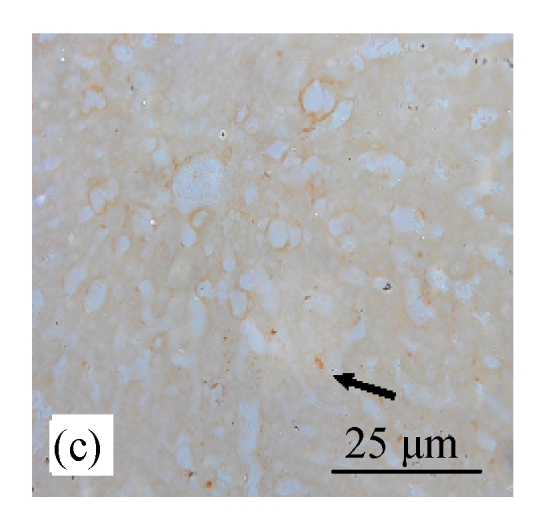
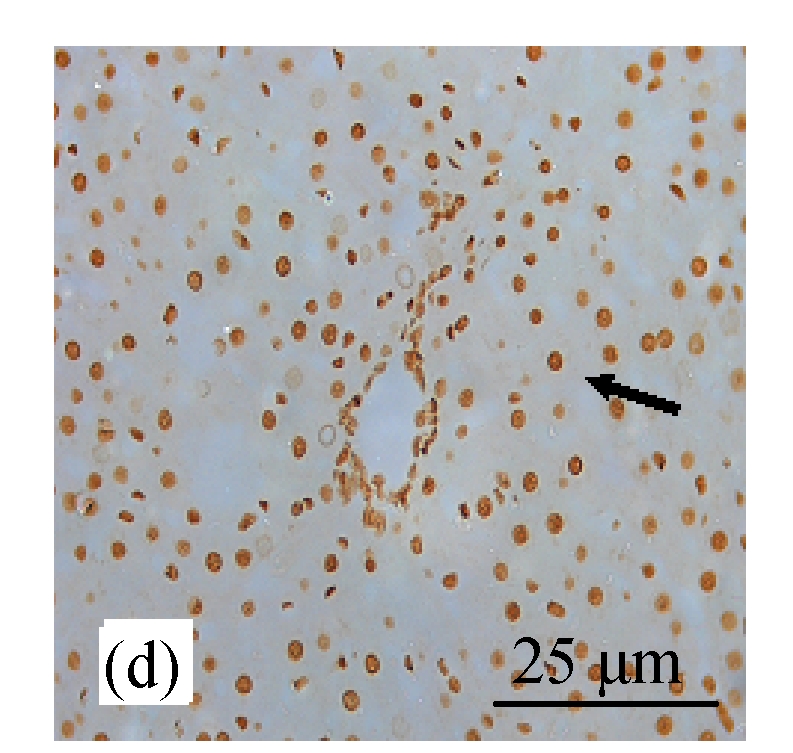
Fig.4a shows positive expression of caspase 8 with clear brownish color in the gastric gland of human gaster tissue. Caspase 8 showed patchy immuno-staining in the cytoplasm of the CDE group (Fig.4c) and homogenous staining on the CDE+CV300 group (Fig.4e). The control and CV300 groups were negative for caspase 8 immunostaining (Figs.4b and 4d).
Fig. 4.
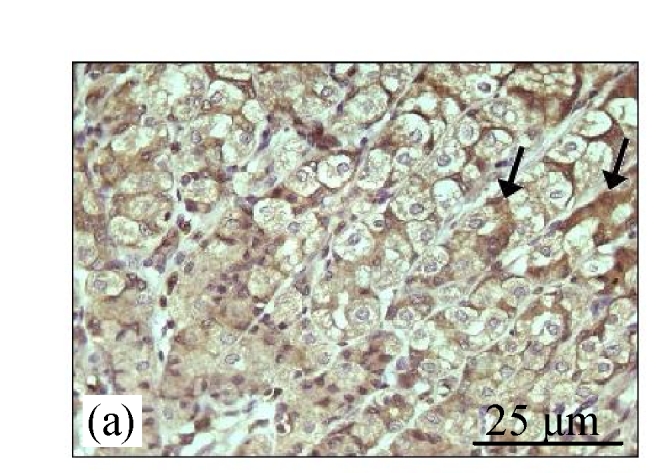
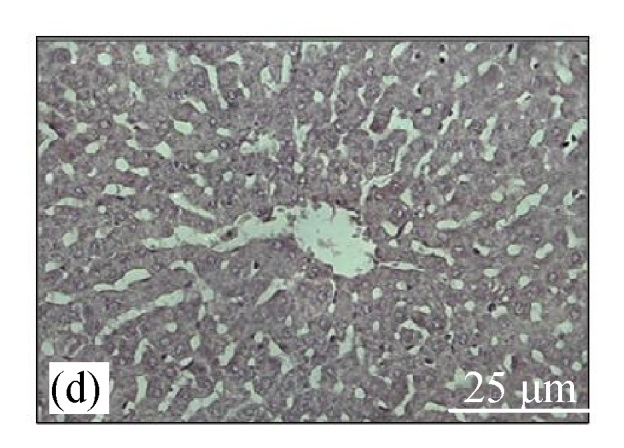
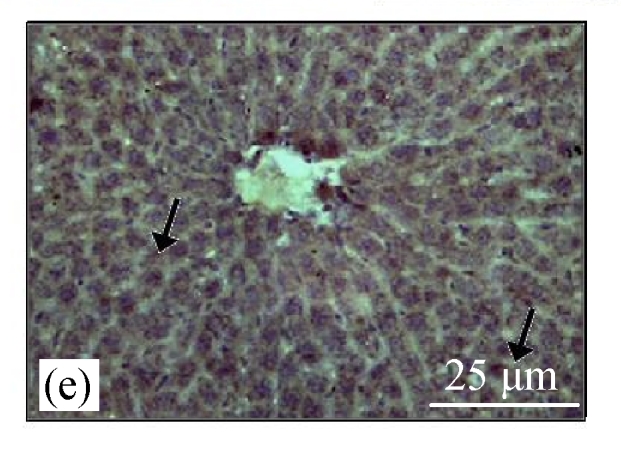
Immunohistochemistry staining for caspase 8 at 8 weeks. (a) The gastric gland of human gastric tissue showed positive staining for caspase 8; (b) Control group (normal diet given); (c) CDE group; (d) CV300 group; (e) CDE+CV300 group
The arrows showed cytoplasmic pattern of caspase 8 expression
Analysis of caspase 8 expression by different diet groups at 8 and 12 weeks is shown in Fig.5. There were no caspase 8 expressions observed in the liver tissues of the control group and the groups treated with CV. Caspase 8 stained 35.5% and 28.43% of cells in the CDE group at 8 and 12 weeks, respectively. The caspase 8 expression increased with increasing doses of CV (50, 150, and 300 mg/kg body weight, respectively) administered to the CDE group at 8 weeks (27.33%, 70.83%, and 100%, respectively) and 12 weeks (40.5%, 64.5%, and 100%, respectively).
Fig. 5.

Analysis of caspase 8 expression in different diet groups at 8 and 12 weeks
Values are expressed as mean±SEM. aSignificant different (P<0.05) compared with the control group at the same week; bSignificant different (P<0.05) compared with the CDE group at the same week. Groups: 1: Control; 2: CDE; 3: CV50; 4: CV150; 5: CV300; 6: CDE+CV50; 7: CDE+CV150; 8: CDE+CV300
BrdU and TUNEL staining
BrdU staining was performed to verify that CDE diet, which induced the formation of liver tumors, exhibited high rate of cell proliferation, which is one of the characteristics of tumor cells. Fig.6b (in preceding page) and Fig.7 show the presence of increased BrdU staining in the CDE group, which was reduced significantly when treated with increasing doses of CV (Figs.6d and 7).
Fig. 6.
Immunohistochemical analysis of cell proliferation using BrdU antibodies in rats of different diet groups at 8 weeks. (a) Control group; (b) CDE group; (c) CV300 group; (d) CDE+CV300 group
BrdU-positive cells were visualized as brown color staining (arrows)
Fig. 7.

Effect of CV on cell proliferation in rats of different diet groups at 8 and 12 weeks
Data are expressed as mean±SEM. aSignificantly different (P(0.05) compared with the control group at the same week; bSignificantly different (P(0.05) compared with the CDE group at the same week. Groups: 1: Control; 2: CDE; 3: CV50; 4: CV150; 5: CV300; 6: CDE+CV50; 7: CDE+CV150; 8: CDE+CV300
TUNEL staining showed increased expression of apoptosis (Figs.8d and 9) in the CDE group that was treated with increasing doses of CV. However, significant elevation of apoptosis was observed only in the CDE+CV300 group at 8 and 12 weeks compared with the CDE group. Rates of apoptosis in all the CV groups were similar to the control group, showing that small apoptosis rate is a normal physiological event.
Fig. 8.
Analysis of apoptosis cells using the TUNEL assay in rats of different diet groups. (a) Control group; (b) CDE group; (c) CV300 group; (d) CDE+CV300 group
Apoptotic cells were shown as a brown color staining (arrows)
Fig. 9.

Effect of CV on cell apoptosis in rats of different diet groups at 8 and 12 weeks
Data are expressed as mean±SEM. aSignificantly different (P(0.05) compared with the control group at the same week; bSignificantly different (P(0.05) compared with the CDE group at the same week. Groups: 1: Control; 2: CDE; 3: CV50; 4: CV150; 5: CV300; 6: CDE+CV50; 7: CDE+CV150; 8: CDE+CV300
DISCUSSION
CV, a unicellular microalgae, has been shown to inhibit cell proliferation and to induce apoptosis in liver cancer-induced rats as well as in hepatoma cell line, HepG2 (Md Saad et al., 2006; Sulaiman et al., 2006). The results of our study clearly exhibit that CV extract inhibited the liver tumor growth in CDE-treated rats. Since tumor growth is closely related to increased proliferation, a compound that inhibits proliferation and induces apoptosis is expected to have chemopreventive effect on tumors. In this study, we observed that CV can induce apoptosis via caspase 8 by inhibiting the anti-apoptotic protein Bcl-2. Apoptosis is a way of removing damaged and “bad cells” from the system. Apoptotic pathway consists of several families of proteins such as Bcl-2, Bax and caspases 3, 6, 7, 8 and 9 which could be traced via immunocytochemistry or Western blot techniques. Potential chemopreventive agents including ginger extract, Spirulina, curcumin and other herbs have been linked to a good inducer of apoptosis and inhibitor of tumour cell growth (Surh, 2002; Lampe, 2003).
Oval cell proliferation precedes neoplasia in many rodent models of hepatocellular carcinoma, and prevention of this proliferative response can reduce the risk of subsequent carcinoma (Akhurst et al., 2001; Lowes et al., 2003; Sulaiman et al., 2006). Oval cell apoptosis has been shown to be mediated via Akt activity (Davies et al., 2006). We observed that a few oval cells stained positively for Bcl-2 and caspase 8 especially in the periportal areas. This may suggest that CV inhibits tumors by inducing apoptosis in damaged hepatocytes as well as oval cells.
Enhancement of Bcl-2 expressions in CDE group indicated the increased cell proliferation in cancerous cells, while no Bcl-2 expressions were observed in the control and CV groups, which showed normal tissue growth. However, the percentage of Bcl-2 expressions declined to almost zero score at the highest dose of CV (300 mg/kg body weight), showing potent growth inhibitory effect of CV on liver cancer cells. Perhaps CV is involved in the inhibition of initiation and promotion stages in chemical carcinogenesis (Surh, 1999). This pattern of Bcl-2 expression was seen only in the CDE group at 12 weeks but not at 8 weeks due to numerous oval cells found in the CDE rats at 8 weeks that differentiated into bile-duct like cells at 12 weeks (Tee et al., 1994). As such we would expect the expression of Bcl-2, an anti-apoptotic protein, to be high, even with CV treatment. Decreased expression of Bcl-2 with increasing concentration of CV administered to the CDE rats at 12 weeks could be associated with increased apoptosis and inhibition of cellular proliferation.
Similar to Bcl-2 expression, there were no caspase 8 expressions in the control and CV groups (for all concentrations) at 8 and 12 weeks. It was evident that caspase 8 expression increased with increasing doses of CV (50, 150, and 300 mg/kg body weight) administered to the CDE group at 8 and 12 weeks (Fig.6), indicating higher apoptosis rate when increasing doses of CV were administered. Miyao et al.(2006) showed high rate of apoptotic cells in human cholesteatoma as indicated by high rate of expressions of caspases 3 and 8 compared to normal skin, since both caspases are pro-apoptotic proteins involved in the death signaling pathway. Loss of caspase 8 expression in neuroblastoma was shown to be related to malignancy and resistance to TRAIL (tumor necrosis factor-related apoptosis-inducing ligand)-induced apoptosis (Hopkins-Donaldson et al., 2000).
We have also correlated our findings on the expressions of Bcl-2 and caspase 8 with increased proliferation by BrdU labeling index and apoptosis via TUNEL assay in the CDE rats that were treated with CV extract (Figs.6~9). The CDE rats at 8 and 12 weeks showed high proliferation rate as indicated with increased BrdU labeling of the nuclei. However, when treated with CV at increasing doses, proliferation of neoplastic cells decreased significantly, which correlated with increased apoptotic rate as evidenced by increased TUNEL staining. Increased apoptosis seen in the CDE rats may reflect a normal physiological event, in which the “bad cells are killed” and they were augmented in the presence of CV.
To the best of our knowledge, this study for the first time defined the chemopreventive role of CV by inhibiting cellular proleferation (decreasing Bcl-2 expresion) and inducing apoptosis (increasing caspase 8 expression) in liver cancer cells. The results of the study could justify the role of CV in the treatment of thousands of liver cancer patients, thereby opening a new door for future research.
Footnotes
Project supported by Department of Biochemistry, Faculty of Medicine, UKM Medical Center, Universiti Kebangsaan Malaysia, and the Malaysian Ministry of Science and Technological Innovation (MOSTI)
References
- 1.Akhurst B, Croager EJ, Farley-Roche CA, Ong JK, Dumble ML, Knight B, Yeoh GC. A modified choline-deficient, ethionine-supplemented diet protocol effectively induces oval cells in mouse liver. Hepatology. 2001;34(3):519–522. doi: 10.1053/jhep.2001.26751. [DOI] [PubMed] [Google Scholar]
- 2.Coultas L, Strasser A. The role of the Bcl-2 protein family in cancer. Semin Cancer Biol. 2003;13(2):115–123. doi: 10.1016/S1044-579X(02)00129-3. [DOI] [PubMed] [Google Scholar]
- 3.Crawford RA, Caldwell C, Iles RK, Shepherd JH, Chard T. Prognostic significance of the Bcl-2 apoptotic family of proteins in primary and recurrent cervical cancer. Br J Cancer. 1998;78(2):210–214. doi: 10.1038/bjc.1998.466. [DOI] [PMC free article] [PubMed] [Google Scholar]
- 4.Davies RA, Knight B, Tian YW, Yeoh GC, Olynyk JK. Hepatic oval cell response to the choline-deficient, ethionine supplemented model of murine liver injury is attenuated by the administration of a cyclo-oxygenase 2 inhibitor. Carcinogenesis. 2006;27(8):1607–1616. doi: 10.1093/carcin/bgi365. [DOI] [PubMed] [Google Scholar]
- 5.Hanson CJ, Bootman MD, Distelhorst CW, Maraldi T, Roderick HL. The cellular concentration of Bcl-2 determines its pro- or anti-apoptotic effect. Cell Calcium. 2008;44(3):243–258. doi: 10.1016/j.ceca.2007.11.014. [DOI] [PubMed] [Google Scholar]
- 6.Haperin SA, Smith B, Nolan C, Shay J, Kralovec J. Safety and immunoenhancing effect of a Chlorella-derived dietary supplement in healthy adults undergoing influenza vaccination: randomized, double-blind, placebo-controlled trial. CMAJ. 2003;162(2):111–117. [PMC free article] [PubMed] [Google Scholar]
- 7.Hasegawa T, Noda K, Kumamoto S, Ando Y, Yamada A, Yoshikai Y. Chlorella vulgaris culture supernatant (CVS) reduces psychological stress-induced apoptosis in thymocytes of mice. Int J Immuno-pharmacol. 2000;22(11):877–885. doi: 10.1016/S0192-0561(00)00049-7. [DOI] [PubMed] [Google Scholar]
- 8.Hopkins-Donaldson S, Bodmer JL, Bourloud KB, Brognara CB, Tschopp J, Gross N. Loss of caspase-8 expression in neuroblastoma is related to malignancy and resistance to TRAIL-induced apoptosis. Med Pediatr Oncol. 2000;35(6):608–611. doi: 10.1002/1096-911X(20001201)35:6<608::AID-MPO25>3.0.CO;2-U. [DOI] [PubMed] [Google Scholar]
- 9.Kew MC. Epidemiology of hepatocellular carcinoma. Toxicology. 2002;181-182:35–38. doi: 10.1016/S0300-483X(02)00251-2. [DOI] [PubMed] [Google Scholar]
- 10.Lampe JW. Spicing up a vegetarian diet: chemopreventive effects of phytochemicals. Am J Clin Nutr. 2003;78(Suppl. 3):579S–583S. doi: 10.1093/ajcn/78.3.579S. [DOI] [PubMed] [Google Scholar]
- 11.Lowes KN, Croager EJ, Olynyk JK, Abraham LJ, Yeoh GC. Oval cell-mediated liver regeneration: role of cytokines and growth factors. J Gastroenterol Hepatol. 2003;18(1):4–12. doi: 10.1046/j.1440-1746.2003.02906.x. [DOI] [PubMed] [Google Scholar]
- 12.Md Saad S, Mohd Yusof YA, Wan Ngah WZ. Comparison between locally produced Chlorella vulgaris and Chlorella vulgaris from Japan on proliferation and apoptosis of liver cancer cell line, HepG2. Malaysian J Biochem & Molec Biol. 2006;13(1):32–36. [Google Scholar]
- 13.Miyao M, Shinoda H, Takahashi S. Caspase-3, caspase-8 and nuclear factor-kappaB expression in human cholesteatoma. Otology & Neurotology. 2006;27(1):8–13. doi: 10.1097/01.mao.0000180482.34545.b8. [DOI] [PubMed] [Google Scholar]
- 14.National Cancer Registry of Malaysia. Cancer Incidence of Malaysia 2002. 2003 (Available at: http://www.crc.gov.my)
- 15.Okuda K. Hepatocellular carcinoma. J Hepatol. 2000;32(Suppl. 1):225–237. doi: 10.1016/S0168-8278(00)80428-6. [DOI] [PubMed] [Google Scholar]
- 16.Park JW. Hepatocellular carcinoma in Korea: introduction and overview. Korean J Gastroenterol. 2005;45(4):217–226. [PubMed] [Google Scholar]
- 17.Sano T, Tanaka Y. Effect of dried, powdered Chlorella vulgaris on experimental atherosclerosis and alimentary hypercholestrolemia in cholesterol-fed rabbits. Artery. 1987;14(2):76–84. [PubMed] [Google Scholar]
- 18.Schafer DF, Sorrell MF. Hepatocellular carcinoma. Lancet. 1999;353(9160):1253–1257. doi: 10.1016/S0140-6736(98)09148-X. [DOI] [PubMed] [Google Scholar]
- 19.Sulaiman S, Wan Ngah WZ, Shamaan NA, Mohd Yusof YA. Chemopreventive effect of Chlorella vulgaris on liver cancer induced rats. Int J Cancer Res. 2006;2(3):234–241. [Google Scholar]
- 20.Surh YJ. Molecular mechanisms of chemopreventive effects of selected dietary and medical phenolic substances. Mutation Res. 1999;428(1-2):305–327. doi: 10.1016/s1383-5742(99)00057-5. [DOI] [PubMed] [Google Scholar]
- 21.Surh YJ. Anti-tumor promoting potential of selected spice ingredients with antioxidative and anti-inflammatory activities: a short review. Food Chem Toxicol. 2002;40(8):1091–1097. doi: 10.1016/S0278-6915(02)00037-6. [DOI] [PubMed] [Google Scholar]
- 22.Tee LBG, Kirilak Y, Huang WH, Morgan RH, Yeoh GC. Differentiation of oval cells into duct-like cells in preneoplastic liver of rats placed on a choline-deficient diet supplemented with ethionine. Carcinogenesis. 1994;15(12):2747–2756. doi: 10.1093/carcin/15.12.2747. [DOI] [PubMed] [Google Scholar]
- 23.Yuspa SH, Poirier MC. Chemical carcinogenesis: from animal models to molecular models in one decade. Adv Cancer Res. 1988;50:25–68. doi: 10.1016/S0065-230X(08)60434-0. [DOI] [PubMed] [Google Scholar]