Abstract
Right ventricular (RV) dysfunction is associated with poor clinical outcome following pulmonary embolism (PE). Previous studies in our laboratory show that influx of neutrophils contributes to acute RV damage seen in an 18 h rat model of PE. The present study describes the further progression of inflammation over 6 weeks and compares the neutrophil and monocyte responses. The RV outflow tract became white in colour by day 1 with influx of neutrophils (tissue myeloperoxidase activity increased 17-fold) and mononuclear cells with characteristics of M1 phenotype (high in Ccl20, Cxcl10, CcR2, MHCII, DNA microarray analysis). Matrix metalloproteinase activities were increased and tissue was thinned to produce a translucent appearance in weeks 1 through 6 in 40% of hearts. RV contractile function was significantly reduced at 6 weeks of PE. In this later phase, there was accumulation of myofibroblasts, the presence of mononuclear cells with M2 characteristics (high in scavenger mannose receptors, macrophage galactose lectin 1, PDGFR1, PDGFRβ), enrichment of the subendocardial region of the RV outflow tract with neovesels (α-smooth muscle immunohistochemistry) and deposition of collagen fibres (picrosirius red staining) beginning scar formation. Thus, while neutrophil response is associated with the early, acute inflammatory events, macrophage cells continue to be present during the proliferative phase and initial deposition of collagen in this model, changing from the M1 to the M2 phenotype. This suggests that the macrophage cell response is biphasic.
Keywords: healing, inflammation, macrophages, neutrophils, pulmonary embolism, right ventricle
Pulmonary embolism (PE) is a major cardiopulmonary disease with an incidence of 1 per 1000 individuals in a year, hospitalizing approximately 150,000 Americans per year (Stein et al. 2003), and having a mortality rate that exceeds 15% in the first 3 months after diagnosis (Goldhaber & Elliott 2003a,b; White 2003). The incidence of mortality increases dramatically with the presence of right ventricular (RV) dysfunction based on echocardiographic indexes (Kasper et al. 1997; Ribeiro et al. 1997; Ribeiro et al. 1999; Kreit 2004; Schoepf et al. 2004) or liberation of cardiac biomarkers such as troponin proteins into the blood (Giannitsis et al. 2000; Meyer et al. 2000; Kline et al. 2006; Lippi & Favaloro 2008). Even among survivors of submassive PE without evidence of shock, 40% of survivors have persistent RV dysfunction (Kline et al. 2006; Stevinson et al. 2007). These data underscore the importance of understanding the mechanisms of RV damage resulting from PE.
Current literature provides only minimal insight into the mechanism of persistent RV dysfunction after PE. The abrupt rise in pulmonary vascular resistance following PE increases RV peak systolic pressure and enlarges the RV (Ribeiro et al. 1997; Ribeiro et al. 1999). This increases RV wall tension causing myocyte stretch, increased work and compression of coronary vessels, resulting in functional RV ischaemia. This interpretation was made as early as 1949 (Dack et al. 1949) and has continued to be the predominant explanation for RV dysfunction (Vlahakes et al. 1981; Gold & Bache 1982; Wood 2002; Kreit 2004). The importance of RV inflammation to the development and extension of RV injury has only recently been examined in PE.
Our previous studies indicate a central role of neutrophils in the pathogenesis of acute RV damage after experimental PE in rats (Watts et al. 2006; Zagorski et al. 2007). RV tissue obtained at autopsy from humans with PE also shows the presence of neutrophils and monocytes (Iwadate et al. 2001, 2003). This study examines the 6-week time course of neutrophil and monocyte/macrophage cell infiltration and the role of these cells in the proliferative and resolution phases of myocardial healing in the rat model of PE.
Materials and methods
Animals
Experiments were performed using male Sprague–Dawley rats weighing between 300 and 375 g at the start of the experimental period. All experiments were conducted with the approval of the Institutional Animal Care and Use Committee of the Carolinas Medical Center in accordance with the Guide for the Care and Use of Laboratory Animals.
Pulmonary embolism model
Pulmonary embolism was induced in anaesthetized animals (xylazine 3 mg/kg and ketamine 70 mg/kg, IP) by injecting polystyrene microspheres (2.0 million/100 g body wt, 24 ± 1 μm, 7525A; Duke Scientific, Palo Alto, CA, USA) into the right jugular vein as previously described (Zagorski et al. 2003; Watts et al. 2006; Zagorski et al. 2007, 2008). Vehicle-treated animals received vehicle (0.01% Tween 20 at 0.16 ml/100 g body wt), but not microspheres. Surgical incisions were sealed with staples and animals recovered for the period indicated in each experimental group.
In vivo measurements
Animals were anaesthetized with xylazine (3 mg/kg) and ketamine (70 mg/kg) and placed on a warming pad at the indicated time point (day 1, day 4, 1, 2, 3, 4 or 6 weeks). Breathing rate was manually counted. A 2-French micromanometer (Millar Instruments, Houston, TX, USA) was placed in the left carotid artery to measure systemic pressures and heart rate. A 2-French bent Millar micromanometer was inserted into the jugular vein and placed into the RV intermittently to assess RV pressures. Acknowledge software (Biopac Systems, Inc., Santa Barbara, CA, USA) was used to acquire the pressure data. PE-50 tubing was used to aspirate arterial blood (0.4 ml) for blood chemistry (StatProfile Ultra analyzer; Nova Biomedical, Waltham, MA, USA). An additional blood sample (5 ml) was removed and plasma was aliquoted and stored (−70 °C) for subsequent analysis of cardiac troponin I content (ELISA #2010-2-HSP; Life Diagnostics, Inc., West Chester, PA, USA).
In vitro RV outflow contractile force measurements
Hearts were isolated in anaesthetized rats via midline thoracotomy and placed in ice-cold saline. The aorta was perfused for 3–5 min at 60 mmHg in a non-recirculating, temperature-controlled (37 °C) system, using Krebs–Henseleit bicarbonate buffer as previously described (Watts et al. 2006; Zagorski et al. 2007). RV-free walls were isolated and a strip of muscle (approximately 1 mm2 diameter) was cut longitudinally from the midline of the outflow tract. Muscle strips were placed into a tissue bath, containing Krebs–Henseleit bicarbonate buffer (37 °C, gassed with 95% O2/5% CO2) and were tied to the fixed point and the isometric tension transducer with digital micrometer in the Refined Myograph System (Kent Scientific, Torrington, CT, USA). Strips were paced at 10 ms duration, 80 V and 0.2 Hz using platinum plate electrodes, which were placed on each side of the muscle tissue. Data were recorded using Acknowledge software (Biopac Systems, Inc., Goletta, CA, USA). Length–tension curves were constructed using 0.25 mm increments in length to determine contractile force at the optimum length resulting in maximum active force (mN/mm2) cross-sectional area. The components were calculated as follows: mNewton = gm tension × 9.807; mm2 cross-section area = wet wt/optimum length, assuming specific gravity = 1.0.
Biochemical measurements
Hearts were perfused as described above. RV-free walls were isolated, weighed and then frozen using liquid nitrogen-cooled Wallenberger tongs. Frozen RV tissues were pulverized using a liquid nitrogen-cooled, stainless steel custom mortar and pestle. Frozen powders were stored at −70 °C until analysis.
Myeloperoxidase activity was determined in heart extracts and normalized for total protein as previously described (Zagorski et al. 2003; Watts et al. 2006; Zagorski et al. 2007). Protein concentrations were determined from the BCA assay (Pierce, Inc., Rockford, IL, USA). Gelatin zymography was performed as follows. Protein extracts were prepared by homogenizing frozen RV powder (approximately 25 mg) from individual hearts in phosphate-buffered saline. Extracts were centrifuged (9,500 × g, 5 min, 23 °C) and protein concentration was determined in supernatants. The protein extracts of 8–10 hearts were pooled in equal concentration for all groups of hearts. Aliquots of these extracts containing 20 μg of total RV protein in PBS were combined with 1× lithium dodecyl sulfate (LDS) sample buffer minus reducing agent and were loaded in gels without heating. Zymogram gels were pre-poured using Novex NuPage 10% minigels with gelatin substrate (Invitrogen, Carlsbad, CA, USA). Gels were electrophoresed, renatured in situ and allowed to digest gel substrate overnight. Gels were then stained with Amido Black as recommended by the vendor (Invitrogen).
Histology
Hearts were isolated from anaesthetized rats and perfused briefly as described above to remove blood from the coronary vessels. The RV tissue was then dissected and the basal outflow tract was isolated, fixed in 10% neutral buffered formalin, embedded in paraffin, sectioned, de-parafinized, rehydrated and stained. Monocyte/macrophages were stained by immunohistochemistry using mouse antirat CD68, clone number ED1 (MCA341R; Serotec, Inc., Raleigh, NC, USA) primary antibody, the Animal Research Kit (ARK; Dakocytomation, Carpenteria, CA, USA) kit and biotinylated mouse secondary antibody with mouse Blocking Reagent. Sections were treated with proteinase K (20 μg/ml in PBS) and the primary antibody was added for 60 min. Slides were incubated for 15 min in peroxidase-conjugated streptavidin and 5 min in diaminobenzidine/hydrogen peroxidase and were then counter stained with 0.03% aqueous light green stain (Polysciences, Warrington, PA, USA). Negative controls were prepared for each heart sectioned by eliminating the primary antibody. Smooth muscle actin (α-SMA) was labelled with mouse monoclonal anti-actin, Clone 1A4 (A 5228; Sigma-Aldrich, St. Louis, MO, USA), including negative controls. Collagen was identified using the sequence of Weigert's haematoxylin (#s216BA and s216BB; Polysciences), alcian blue solution (#A35-500; Sigma-Aldrich), and then picrosirius red solution (0.1% Sirius Red F3B Aldrich #36,554-8; Sigma-Aldrich) in saturated aqueous picric acid (#925-40; Sigma-Aldrich). Sections were then rinsed in 0.01 N HCl for 2 min, dehydrated, cleared and mounted with cover slips.
Microarray analysis
Hearts were isolated and perfused to remove coronary vascular blood. RV tissue was collected from five animals in each of four groups: day 1 PE, day 1 vehicle; week 6 PE, week 6 vehicle. RV tissues were quick-frozen in liquid nitrogen and stored at −70 °C. Frozen RV tissue was crushed using a custom-built, stainless steel, mortar and pestle chilled with liquid nitrogen. Approximately 100 mg of tissue powder from each heart was then processed for RNA by the Trizol method (Invitrogen). The extracted RNAs were purified on Qiagen RNeasy columns and 5 μg total RNA was converted to double-stranded cDNA with a Superscript double stranded cDNA synthesis kit (Invitrogen). The cDNA was then transcribed into biotin-labelled cRNA by in vitro transcription (IVT) with the Affymetrix IVT Labeling Kit. The biotin-labelled cRNAs were fragmented non-enzymatically according to Affymetrix procedures. Each fragmented sample was spiked with bioB, bioC, bioD and cre which served as hybridization controls. The fragmented cRNAs were then hybridized to Affymetrix Rat Genome 230 v2.0 microarrays in Affymetrix hybridization buffer for 16 h at 45 °C. The hybridized arrays were washed and fluorescently stained in the Affymetrix Fluidics Station 400 following Affymetrix procedures. Each array was scanned twice by the Agilent Gene Array Scanner G2500A (Agilent Technologies, Palo Alto, CA, USA).
Statistical analysis
Values are presented as mean ± SE. Time course data were collected for individual animals in each time point, and thus represent independent groups for statistical analysis. Multiple independent groups were compared using anova with Tukey's post hoc testing. Significance was determined as P < 0.05 using two-tailed testing. Microarray data were analysed with Genesifter web-based software (VizX Labs, Seattle, WA, USA). Affymetrix ‘.cel’ files were uploaded to the Genesifter web site using GC-RMA normalization. Five independent arrays were analysed for each group. Statistical analyses compared PE and vehicle at day 1 and PE and vehicle at week 6 using t-tests (P < 0.05) and Benjamini and Hochberg adjustment for false discovery rates. All microarray data have been deposited in the NIH/NCBI GEO database (http://www.ncbi.nlm.nih.gov/projects/geo) GEO accession no. GSE6104 (day 1), GSE11851 (week 6).
Results
In vivo responses to PE
Pulmonary embolism caused a significant increase in breathing rate (141 ± 9 breaths per min in PE vs. 90 ± 3 vehicle) and pleural effusion (8.3 ± 1.5 ml) on day 1 (Table 1). The PE also produced mild hypotension (93 ± 14 peak systolic arterial pressure in PE vs. 128 ± 4 mmHg in vehicle) and elevated RV peak systolic pressure (36 ± 3 in PE vs. 30 ± 1 mmHg in vehicle) on day 1 together with hyperlactacidemia and hypoxemia. These abnormalities tended to normalize on day 4 and week 1 (Table 1) and were not different by 6 weeks.
Table 1.
In vivo physiological parameters
| Group | Breaths/min | Pleural effusion | Lactate | PO2 | PSAP | RVPSP |
|---|---|---|---|---|---|---|
| Veh D1 | 90 ± 3 | ND | 1 ± 0.1 | 83 ± 6 | 128 ± 4 | 30 ± 1 |
| PE D1 | 141 ± 9* | 8.3 ± 1.5* | 2.8 ± 0.4* | 62 ± 5* | 93 ± 14* | 36 ± 3* |
| PE D4 | 105 ± 2* | ND | 1.7 ± 0.4 | 61 ± 6* | 119 ± 5 | 38 ± 2* |
| PE W1 | 101 ± 4 | ND | 0.9 ± 0.2 | 69 ± 2 | 131 ± 5 | 34 ± 3 |
| PE W2 | 95 ± 5 | ND | 0.4 ± 0.1 | 76 ± 3 | 140 ± 6 | 31 ± 2 |
| PE W4 | 90 ± 3 | ND | 0.9 ± 0.1 | 67 ± 2 | 145 ± 7 | 32 ± 2 |
| PE W6 | 95 ± 5 | ND | 0.8 ± 0.1 | 70 ± 3 | 146 ± 5 | 32 ± 2 |
| Veh W6 | 94 ± 4 | ND | 0.1 ± 0.1 | 86 ± 4 | 135 ± 6 | 28 ± 2 |
ND, none detected; PSAP, peak systolic arterial pressure (mmHg); RVPSP, right ventricular peak systolic pressure (mmHg).
Significant difference from vehicle day 1. n = 8–10/group.
Cardiac changes
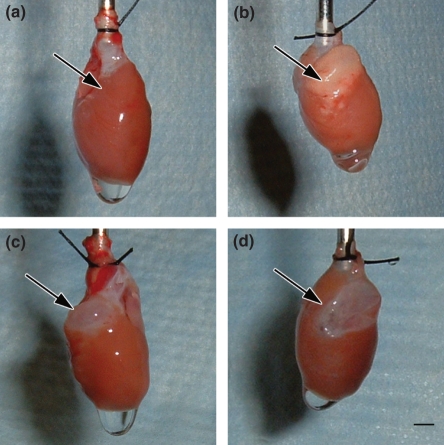
Over the 6-week course studied, PE produced gross evidence of RV damage. In contrast to healthy hearts (Figure 1a), PE-stressed hearts show a focal, white plaque on day 1 (Figure 1b, arrow). Three weeks later, this white plaque transformed to a sharply demarcated, transparent area in the RV base (Figure 1c, arrow), which persisted through week 6 (Figure 1d, arrow). No changes were observed in the apical portion of the RV or in the LV during any period of the experiment. This pattern of macroscopic injury was observed in approximately 40% of animals (11 of 29) by week 6 after PE. The RV outflow tract muscle contractile force was significantly reduced 6 weeks after PE, compared with contractile force in vehicle-treated animals (4.6 ± 0.5 PE vs. 7.2 ± 0.6 mN/mm2 vehicle, mean ± SE, n = 22 PE, n = 11 vehicle, P < 0.003, t-test). Coincident with the development of the white plaque in the RV base, circulating concentrations of cardiac troponin I increased from undetectable (<0.05 ng/ml) to 3.00 ± 0.76 ng/ml plasma. This confirms the presence of cardiomyocyte necrosis during the first 24 h of the PE. Troponin release resolved to baseline levels by day 4 after PE.
Figure 1.
Pictures of hearts taken 6 weeks after vehicle treatment (a), on day 1 (b), week 3 (c) or week 6 (d) after PE. Arrows point to the right ventricular outflow tract in each panel. Bar = 3 mm.
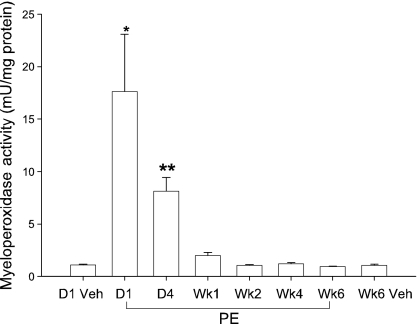
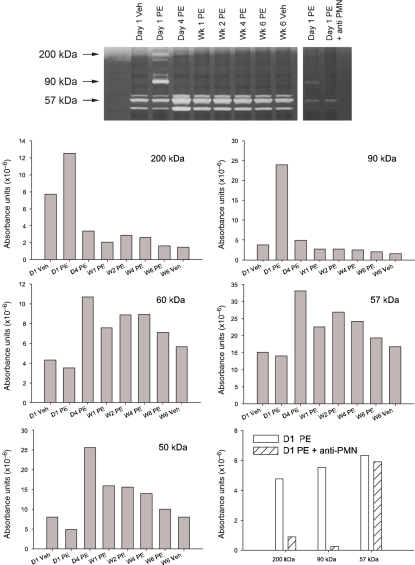
Coincident with the development of the white plaque in the RV base and cardiac troponin leak, the RV content of myeloperoxidase activity, a marker of neutrophil cell content, increased 17-fold on day 1 (Figure 2). This high MPO activity declined on day 4 after PE and returned to normal by week 1 after PE. Gelatin zymography (Figure 3) revealed a peak activity at 90 kDa, suggesting the presence of elevated MMP-9 (Van den Steen et al. 2002), and a 200 kDa activity, identified as the homodimer form of MMP-9 (Van den Steen et al. 2002) on day 1 after PE. Three other unidentified gelatinase activity bands, observed in the 57 kDa range appear to have activity peaking on day 4 and persisting at elevated levels throughout the 6-week period. Taken together, the elevated MPO and MMP-9 activity suggest the presence of neutrophilic infiltration in the RV after PE. We further tested the hypothesis that neutrophils contributed to RV damage by treating rats with intravenous anti-PMN antibody (0.2 ml containing 1 mg/rat, product #AIA51140; Accurate Chemical and Scientific Corp., Westbury, NY, USA) 15 min before inducing PE. As previously described, anti-PMN treatment reduces the accumulation of MPO activity and prevented RV dysfunction day 1 after PE (Watts et al. 2006). The present data (Figure 3) show that this treatment also abolished the 200 and 90 kDa MMP9 bands, but not the 57 kDa band.
Figure 2.
Myeloperoxidase activity measured in right ventricular tissue vehicle treatment (day 1 or week 6) or after PE (day 1, day 4 and weeks 1, 2, 4 and 6). Values are mean ± SE, n = 8–10 hearts per group. Asterisks indicate a significant difference from other groups (*) or a significant difference from vehicle (**).
Figure 3.
Gelatinase zymogram from right ventricular tissue isolated from animals on day 1 and week 6 after vehicle treatment or at the indicated times after PE. The right panel shows a separate experiment determining gelatinase activity on day 1 after PE and day 1 after PE in animals treated with anti-PMN antibody to reduce neutrophil influx into RV tissue. Extracts from 8 to 10 hearts were pooled for each group. Density absorbance values are graphed for each of the major bands of activity.
Histology
Histological analyses focused on detection of monocyte/macrophages, collagen and α-SMA. The outflow tract of the RV of hearts 6 weeks after vehicle treatment (no PE) showed few CD68+ cells (Figure 4a), collagen staining was identified around blood vessels and in spaces between cardiomyocytes (Figure 4b), and α-SMA staining was confined to the walls of blood vessels (Figure 4c).
Figure 4.
Representative sections taken from a 6-week vehicle heart and stained with CD68 immunohistochemistry for (a) monocytes, (b) picrosirius red for collagen or (c) α-SMA for smooth muscle or myofibroblasts. Arrows indicate the structures staining positive in each panel.
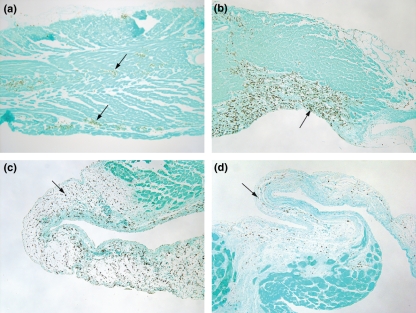
Hearts stained 1 day after PE show clusters of CD68+ cells within the RV outflow tract (Figure 5a). On day 4, the CD68+ cells are more numerous and appear to be clustered in areas where muscle damage is evident (Figure 5b). Examination of hearts 1 week after PE shows that CD68+ cells are prevalent throughout the region of the RV outflow tract that is thinned (Figure 5c). The CD68+ cells are found throughout the loose connective tissue region of the outflow tract by week 3 after PE (data not shown) and by week 6 after PE (Figure 5d). The CD68+ cells appear to be excluded from the endocardial side of this region, where fibrous material is observed at 6 weeks after PE (Figure 5d). Stain was not evident in corresponding sections when the procedure was performed with the omission of the primary antibody from the stain procedure (data not shown).
Figure 5.
Histology of the right ventricular outflow tract seen with CD68 immunohistochemistry identifying monocyte/macrophage cells. (a, arrows) CD68+ cells are in clusters in the right ventricular outflow tract at day 1 after PE, (b, arrows) aggregated in regions of damage at day 4 after PE, (c, arrow) in the debrided, thinned outflow tract week 1 after PE and (d) in the loose connective tissue above the developing fibres seen on the endocardial side 6 weeks after PE. Sections are serial to those in Figures 6 and 7. Endocardial side is downward.
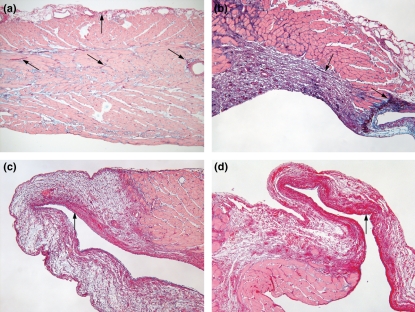
Collagen distribution was observed in the serial sections of those hearts examined for CD68 staining. The stain pattern revealed by picrosirius red indicated that collagen was disbursed between cardiomyocytes, along the epicardial layer and around blood vessels 1 day after PE (Figure 6a, arrows). A similar stain pattern was observed in hearts from vehicle-treated animals (Figure 4b). At day 4 after PE, there was a large accumulation of collagen in the endocardial part of the outflow tract in the space devoid of cardiomyocytes (Figure 6b, arrows). Collagen content also appeared to increase between myocytes in some parts of the tissue. At week 1 after PE, collagen staining was predominantly found in the endocardial region of the thinned RV outflow tract (Figure 6c), a pattern that persisted into week 6 (Figure 6d). The region containing the increased collagen deposition in Figure 6d is the region where CD68+ cells appeared to be excluded in Figure 5d.
Figure 6.
Histology of the right ventricular outflow tract seen with picrosirius red collagen stain. (a, arrows) Collagen fibres are seen between myocytes and at the epicardial area on day 1 after PE, (b, arrow) in the damaged region at day 4 after PE, (c, arrow) in the endocardial side of the debrided, thinned outflow tract week 1 after PE and (d) in the endocardial side 6 weeks after PE. Sections are serial to those in Figures 5 and 7. Endocardial side is downward.
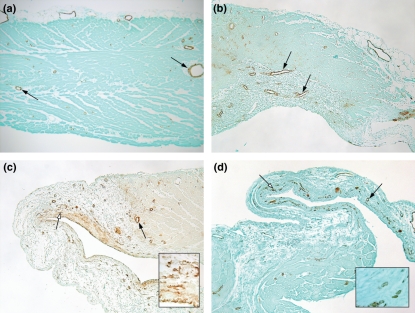
Smooth muscle actin immunohistochemistry showed regions of positive staining associated with blood vessels 1 and 4 days (Figure 7a,b) after PE. A similar pattern of stain was observed in hearts of vehicle-treated animals (Figure 4c). By week 1 after PE, diffuse α-SMA staining was also observed in the subendocardial region (Figure 7c) where the collagen deposition was observed with picrosirius red staining (Figure 6c). The α-SMA stain was found in discrete regions of the subendocardial muscle layer at 6 weeks after PE (Figure 7d). Higher magnification of the outflow tract at 1 and 6 weeks after PE, taken from the points indicated by the white arrows, are shown in Figure 7c,d inserts. These views revealed that the α-SMA stain occurred in small blood vessels that formed in subendocardial layer. When the primary antibody for α-SMA was omitted from the stain procedure, there were no positive cells observed on any slide (data not shown). Microarray data also show increased α-SMA content in the hearts 6 weeks after PE (7.7-fold elevated compared with 6 week vehicle, P = 0.0001), while there was very little increase during the acute inflammatory phase on day 1 (1.7-fold elevated compared with day 1 vehicle, P = 0.0034).
Figure 7.
Histology of the right ventricular outflow tract seen with α-SMA stain. (a, arrows) Stain is localized to blood vessels on day 1 after PE (b) and day 4 after PE. (c, black arrow) Stain is in blood vessels 1 week after PE and also in a diffuse stain pattern within the endocardial side. The insert comes from the area indicated by the white arrow, showing neovessels. (d, black arrow) Stain is observed in blood vessels at 6 weeks. The white arrow (d) indicates the region where the insert was taken to show neovessel formation. Sections are serial to those in Figures 5 and 6. Endocardial side is downward.
Microarray
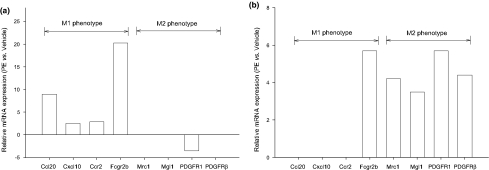
A comprehensive evaluation of hierarchical clustering, Kyoto Encyclopedia of Genes and Genomics (KEGG) and Gene Ontology (GO) reports for gene changes on day 1 has recently been published (Zagorski et al. 2008). A broad transcriptional evaluation of the changes observed at 6 weeks is being prepared; however, a focused evaluation of these data was made to begin to assess markers identified in the literature to be characteristic of M1 or M2 subtypes of mononuclear cells (Figure 8) (Mantovani et al. 2005; Yrlid et al. 2006; Zymek et al. 2006; Martinez et al. 2006, 2008). The emerging pattern was that markers identifying characteristics of M1 cells (Ccl20, Cxcl10, Ccr2, MHCII) were significantly elevated at day 1 (Figure 8a) compared with vehicle, while markers characteristic of M2 cells (scavenger mannose receptors, macrophage galactose N-acetyl-galactosamine specific lectin 1, PDGF receptor1 and PDGF-receptor β) were significantly elevated at week 6 (Figure 8b) compared with vehicle.
Figure 8.
Differential expression of genes describing mononuclear cell M1 and M2 subtypes in right ventricles at (a) day 1 (b) and week 6 after PE in comparison with time-matched vehicle-treated tissue. Fold changes are statistically significant using t-test with Benjamini and Hochberg adjustment for false discovery rates (n = 5 arrays/group). Gene symbols are CC chemokine ligand 20 also known as MIP-3α (Ccl20), CXC chemokine ligand 10 also known as IP-10 (Cxcl10), CC chemokine receptor 2 (Ccr2), major histocompatibility complex II (Fcgr2b), scavenger mannose receptors (Mrc1), macrophage galactose specific lectin 1 (CD301, Mgl1), platelet-derived growth factor receptor 1 (PDGFR1) and platelet-derived growth factor receptor beta polypeptide (PDGFRβ).
Discussion
This study shows the central role of neutrophils and macrophages in producing RV damage and remodelling after PE in the rat heart. The evidence includes gross pathology, contractile dysfunction, biochemical measurements and histological observations. Early in the course, the RV became white in colour, had elevated MPO and MMP-9 activity (indicating the presence of neutrophils), troponin was released (indicating necrosis) and histology showed the presence of macrophage cells. Over the subsequent weeks, the RV outflow tract had decreased contractile function, and became transparent with the death of muscle cells, collagen deposition and the appearance of neovessels. Monocyte subtypes paralleled the morphology with M1 characteristics at the early stage and M2 phenotype in the healing stage. These events approximate those observed in the left ventricle in response to myocardial infarction, which have been divided into three general phases, the inflammatory phase, the proliferative phase and resolution of inflammation and scar formation (Frangogiannis 2006; Zymek et al. 2006).
Our previous studies show that the influx of neutrophils in the inflammatory phase occurs between 6 and 18 h after PE and that CINC-1 is a primary chemokine involved in recruiting neutrophils (Watts et al. 2006; Zagorski et al. 2007). This influx contributes to the dysfunction of the RV, since partial blockade of neutrophil influx with anti-PMN antibodies or with anti-CINC antibodies reduces the development of acute RV dysfunction (Watts et al. 2006; Zagorski et al. 2007). The present study shows that the neutrophil influx was resolved between day 4 and week 1 after PE, while the monocytes persist through week 6.
The roles of monocytes in acute heart function and cardiac healing after PE are just beginning to be defined. We examined gene expression by focusing upon markers that have been identified in the literature in M1 vs. M2 mononuclear cells (Mantovani et al. 2005; Yrlid et al. 2006; Zymek et al. 2006; Martinez et al. 2006, 2008). The profiles of expression suggest that the macrophage response is biphasic after PE, with the M1 pro-inflammatory phenotype present on day 1 and the M2 healing phenotype predominating at week 6. The localization of CD68+ cells also changed throughout the 6-week period of the study. These cells were observed in clusters on day 1 and encompassed the entire wall of the RV outflow tract by week 1 after PE. By 6 weeks after PE, the CD68+ cells seemed to decrease in number and were observed in the loose tissue outside the collagen-rich subendocardial region during scar formation. Smooth muscle-positive cells accumulated in the endocardial side of the transparent outflow tract and formed small neovessels in the region showing deposition of collagen filaments. Recent studies show that platelet-derived growth factor (PDGF) acts upon receptor subtypes PDGFRα and PDGFRβ in healing left ventricle to promote fibroblast recruitment, development and maturation of neovessels required for normal collagen deposition and scar formation in the left ventricle (Zymek et al. 2006). The present data are consistent with a role of PDGF in development of the neovessels observed with the α-SMA stain, since PDGFR1 and PDGFRβ were significantly elevated in the RV at 6 weeks of PE in this study.
The relevance of the model used to produce the PE in this study should be considered. The microsphere model should not directly induce systemic inflammation or directly cause cardiac ischaemia and the model should produce cardiac inflammation and regional dysfunction that is similar to that observed in the clinical setting of PE. Several observations suggest that it is unlikely that the polystyrene microspheres directly activate circulating inflammation pathways. First, there is no evidence of inflammation occurring in the left ventricle of the heart. Second, RV inflammation and dysfunction are associated with moderate pulmonary hypertension and not just the presence of microspheres in the lungs (Watts et al. 2006). Third, when microspheres were co-cultured with rat pulmonary artery endothelial cells in a ratio similar to that observed in vivo, there was no evidence of stimulation of endothelial cell message for chemokines (Zagorski et al. 2003). The microspheres do not directly cause cardiac ischaemia when infused into the jugular vein, since microspheres have not been observed in histological studies of the right or left ventricle, while they are clearly visible within the lungs, and the left ventricle is not damaged (Zagorski et al. 2003; Watts et al. 2006). Thus, RV injury is secondary to increased pulmonary resistance.
The model produces RV damage that is similar to clinical PE. Case studies of human RV tissue obtained at autopsy after PE show that neutrophil and monocyte/macrophage cells are present (Iwadate et al. 2001, 2003). Humans with PE also have elevated circulating concentrations of myeloperoxidase, as well as other inflammatory biomarkers (Moyad 2001; Smulders 2001). Furthermore, the defects found in human hearts occur in the pulmonary outflow tract of the RV (McConnell et al. 1996), which is the location of injury observed in this study of the rat hearts. Thus, humans have inflammatory responses and RV dysfunction like those observed in the rat model.
The RV comprised three components, including the inlet, the apical myocardium and the pulmonary outflow tract (infundibulum or conus region). Several differences among these regions may explain why the outflow tract is the focus of injury in the setting of an abrupt rise in pulmonary resistance. First, the apical myocardium and the outflow tract have different embryologic derivations (Dell'Italia 1991). Second, the apical myocardium is thicker and trabeculated, while the outflow tract is thinner and smooth. Third, the outflow tract contracts 25–50 ms later than the apical region, allowing blood to move upward from the apical region into the outflow tract before being ejected into the pulmonary artery (Dell'Italia 1991; Haddad et al. 2008). Thus, the outflow tract distends outward during the early part of the systolic phase of the cardiac cycle as a result of having thinner muscularity and delayed contraction. With increased pulmonary resistance that occurs abruptly during PE, the outflow tract would be expected to experience greater stretch, increased shear forces and more compression of coronary circulation than the apical region. At present, it is not clear which of these factors contributes to the upregulation of inflammation and the development of dysfunction.
Mortality and morbidity increase dramatically after PE when there is RV dysfunction (Kasper et al. 1997; Ribeiro et al. 1997; Ribeiro et al. 1999; Kreit 2004; Schoepf et al. 2004) and release of cardiac biomarkers, such as troponin (Giannitsis et al. 2000; Meyer et al. 2000; Kline et al. 2006; Lippi and Favaloro 2008). Our recent clinical studies find that 40% of patients with PE of severity similar to that in the rat model have persistent RV dysfunction with functional cardiopulmonary limitations, independent of co-morbid state (Kline et al. 2006; Stevinson et al. 2007). The present study describes the early, monophasic response of the neutrophils and suggest a biphasic response of monocytes, continuing during the progression of hearts into the resolution of inflammation and early stages of scar formation in the rat. Thus, the events described in the rat model may provide a tool to determine if regulation of the acute inflammatory phase induced by the abrupt increase in pulmonary resistance to flow may improve the chronic recovery of heart function.
Acknowledgments
Histological services were provided by Dr Helen Gruber, Orthopaedic Biology, and Ms. Jane Ingram of the Cannon Research Center Histology Core Facility. Digital images were compiled by John Lord of the AHEC Audiovisual Photography Services Department, Carolinas Medical Center.
References
- Dack S, Master AM, Horn H, Grishman A, Field LE. Acute coronary insufficiency due to pulmonary embolism. Am. J. Med. 1949;7:464–477. doi: 10.1016/0002-9343(49)90396-4. [DOI] [PubMed] [Google Scholar]
- Dell'Italia LJ. The right ventricle: anatomy, physiology, and clinical importance. Curr. Probl. Cardiol. 1991;16:653–720. doi: 10.1016/0146-2806(91)90009-y. [DOI] [PubMed] [Google Scholar]
- Frangogiannis NG. The mechanistic basis of infarct healing. Antioxid. Redox Signal. 2006;8:1907–1939. doi: 10.1089/ars.2006.8.1907. [DOI] [PubMed] [Google Scholar]
- Giannitsis E, Muller-Bardorff M, Kurowski V, et al. Independent prognostic value of cardiac troponin T in patients with confirmed pulmonary embolism. Circulation. 2000;102:211–217. doi: 10.1161/01.cir.102.2.211. [DOI] [PubMed] [Google Scholar]
- Gold FL, Bache RJ. Transmural right ventricular blood flow during acute pulmonary artery hypertension in the sedated dog. Evidence for subendocardial ischemia despite residual vasodilator reserve. Circ. Res. 1982;51:196–204. doi: 10.1161/01.res.51.2.196. [DOI] [PubMed] [Google Scholar]
- Goldhaber SZ, Elliott CG. Acute pulmonary embolism. Part I: epidemiology, pathophysiology, and diagnosis. Circulation. 2003a;108:2726–2729. doi: 10.1161/01.CIR.0000097829.89204.0C. [DOI] [PubMed] [Google Scholar]
- Goldhaber SZ, Elliott CG. Acute pulmonary embolism. Part II: risk stratification, treatment, and prevention. Circulation. 2003b;108:2834–2838. doi: 10.1161/01.CIR.0000098427.74047.42. [DOI] [PubMed] [Google Scholar]
- Haddad F, Hunt SA, Rosenthal DN, Murphy DJ. Right ventricular function in cardiovascular disease, part I: anatomy, physiology, aging, and functional assessment of the right ventricle. Circulation. 2008;117:1436–1448. doi: 10.1161/CIRCULATIONAHA.107.653576. [DOI] [PubMed] [Google Scholar]
- Iwadate K, Tanno K, Doi M, Takatori T, Ito Y. Two cases of right ventricular ischemic injury due to massive pulmonary embolism. Forensic Sci. Int. 2001;116:189–195. doi: 10.1016/s0379-0738(00)00367-4. [DOI] [PubMed] [Google Scholar]
- Iwadate K, Doi M, Tanno K, et al. Right ventricular damage due to pulmonary embolism: examination of the number of infiltrating macrophages. Forensic Sci. Int. 2003;134:147–153. doi: 10.1016/s0379-0738(03)00138-5. [DOI] [PubMed] [Google Scholar]
- Kasper W, Konstantinides S, Geibel A, Tiede N, Krause T, Just H. Prognostic significance of right ventricular afterload stress detected by echocardiography in patients with clinically suspected pulmonary embolism. Heart. 1997;77:346–349. doi: 10.1136/hrt.77.4.346. [DOI] [PMC free article] [PubMed] [Google Scholar]
- Kline JA, Hernandez-Nino J, Rose GA, Norton HJ, Camargo CA., Jr Surrogate markers for adverse outcomes in normotensive patients with pulmonary embolism. Crit. Care Med. 2006;34:2773–2780. doi: 10.1097/01.CCM.0000241154.55444.63. [DOI] [PubMed] [Google Scholar]
- Kreit JW. The impact of right ventricular dysfunction on the prognosis and therapy of normotensive patients with pulmonary embolism. Chest. 2004;125:1539–1545. doi: 10.1378/chest.125.4.1539. [DOI] [PubMed] [Google Scholar]
- Lippi G, Favaloro EJ. Cardiac biomarkers in pulmonary embolism. Thromb. Haemost. 2008;99:1134–1136. doi: 10.1160/TH08-02-0064. [DOI] [PubMed] [Google Scholar]
- Mantovani A, Sica A, Locati M. Macrophage polarization comes of age. Immunity. 2005;23:344–346. doi: 10.1016/j.immuni.2005.10.001. [DOI] [PubMed] [Google Scholar]
- Martinez FO, Gordon S, Locati M, Mantovani A. Transcriptional profiling of the human monocyte-to-macrophage differentiation and polarization: new molecules and patterns of gene expression. J. Immunol. 2006;177:7303–7311. doi: 10.4049/jimmunol.177.10.7303. [DOI] [PubMed] [Google Scholar]
- Martinez FO, Sica A, Mantovani A, Locati M. Macrophage activation and polarization. Front. Biosci. 2008;13:453–461. doi: 10.2741/2692. [DOI] [PubMed] [Google Scholar]
- McConnell MV, Solomon SD, Rayan ME, Come PC, Goldhaber SZ, Lee RT. Regional right ventricular dysfunction detected by echocardiography in acute pulmonary embolism. Am. J. Cardiol. 1996;78:469–473. doi: 10.1016/s0002-9149(96)00339-6. [DOI] [PubMed] [Google Scholar]
- Meyer T, Binder L, Hruska N, Luthe H, Buchwald AB. Cardiac troponin I elevation in acute pulmonary embolism is associated with right ventricular dysfunction. J. Am. Coll. Cardiol. 2000;36:1632–1636. doi: 10.1016/s0735-1097(00)00905-0. [DOI] [PubMed] [Google Scholar]
- Moyad MA. An introduction to aspirin, NSAIDs, and COX-2 inhibitors for the primary prevention of cardiovascular events and cancer and their potential preventive role in bladder carcinogenesis: part I. Semin. Urol. Oncol. 2001;4:294–305. [PubMed] [Google Scholar]
- Ribeiro A, Lindmarker P, Juhlin-Dannfelt A, Johnsson H, Jorfeldt L. Echocardiography Doppler in pulmonary embolism: right ventricular dysfunction as a predictor of mortality rate. Am. Heart J. 1997;134:479–487. doi: 10.1016/s0002-8703(97)70085-1. [DOI] [PubMed] [Google Scholar]
- Ribeiro A, Lindmarker P, Johnsson H, Juhlin-Dannfelt A, Jorfeldt L. Pulmonary embolism: one-year follow-up with echocardiography doppler and five-year survival analysis. Circulation. 1999;99:1325–1330. doi: 10.1161/01.cir.99.10.1325. [DOI] [PubMed] [Google Scholar]
- Schoepf UJ, Kucher N, Kipfmueller F, Quiroz R, Costello P, Goldhaber SZ. Right ventricular enlargement on chest computed tomography: a predictor of early death in acute pulmonary embolism. Circulation. 2004;110:3276–3280. doi: 10.1161/01.CIR.0000147612.59751.4C. [DOI] [PubMed] [Google Scholar]
- Smulders YM. Contribution of pulmonary vasoconstriction to haemodynamic instability after acute pulmonary embolism. Implications for treatment? Netherlands J. Med. 2001;58:241–247. doi: 10.1016/s0300-2977(01)00117-6. [DOI] [PubMed] [Google Scholar]
- Stein PD, Hull RD, Ghali WA, et al. Tracking the uptake of evidence: two decades of hospital practice trends for diagnosing deep vein thrombosis and pulmonary embolism. Arch. Intern. Med. 2003;163:1213–1219. doi: 10.1001/archinte.163.10.1213. [DOI] [PubMed] [Google Scholar]
- Stevinson BG, Hernandez-Nino J, Rose G, Kline JA. Echocardiographic and functional cardiopulmonary problems six months after first-time pulmonary embolism in previously healthy patients. Eur. Heart J. 2007;28:2517–2524. doi: 10.1093/eurheartj/ehm295. [DOI] [PubMed] [Google Scholar]
- Van den Steen PE, Dubois B, Nelissen I, Rudd PM, Dwek RA, Opdenakker G. Biochemistry and molecular biology of gelatinase B or matrix metalloproteinase-9 (MMP-9) Crit. Rev. Biochem. Mol. Biol. 2002;37:375–536. doi: 10.1080/10409230290771546. [DOI] [PubMed] [Google Scholar]
- Vlahakes GJ, Turley K, Hoffman JI. The pathophysiology of failure in acute right ventricular hypertension: hemodynamic and biochemical correlations. Circulation. 1981;63:87–95. doi: 10.1161/01.cir.63.1.87. [DOI] [PubMed] [Google Scholar]
- Watts JA, Zagorski J, Gellar MA, Stevinson BG, Kline JA. Cardiac inflammation contributes to right ventricular dysfunction following experimental pulmonary embolism in rats. J. Mol. Cell. Cardiol. 2006;41:296–307. doi: 10.1016/j.yjmcc.2006.05.011. [DOI] [PubMed] [Google Scholar]
- White RH. The epidemiology of venous thromboembolism. Circulation. 2003;107:I4–I8. doi: 10.1161/01.CIR.0000078468.11849.66. [DOI] [PubMed] [Google Scholar]
- Wood KE. Major pulmonary embolism: review of a pathophysiologic approach to the golden hour of hemodynamically significant pulmonary embolism. Chest. 2002;121:877–905. doi: 10.1378/chest.121.3.877. [DOI] [PubMed] [Google Scholar]
- Yrlid U, Jenkins CD, MacPherson GG. Relationships between distinct blood monocyte subsets and migrating intestinal lymph dendritic cells in vivo under steady-state conditions. J. Immunol. 2006;176:4155–4162. doi: 10.4049/jimmunol.176.7.4155. [DOI] [PubMed] [Google Scholar]
- Zagorski J, Debelak J, Gellar M, Watts JA, Kline JA. Chemokines accumulate in the lungs of rats with severe pulmonary embolism induced by polystyrene microspheres. J. Immunol. 2003;171:5529–5536. doi: 10.4049/jimmunol.171.10.5529. [DOI] [PubMed] [Google Scholar]
- Zagorski J, Gellar MA, Obraztsova M, Kline JA, Watts JA. Inhibition of CINC-1 decreases right ventricular damage caused by experimental pulmonary embolism in rats. J. Immunol. 2007;179:7820–7826. doi: 10.4049/jimmunol.179.11.7820. [DOI] [PubMed] [Google Scholar]
- Zagorski J, Sanapareddy N, Gellar MA, Kline JA, Watts JA. Transcriptional profile of right ventricular tissue during acute pulmonary embolism in rats. Physiol. Genomics. 2008;34:101–111. doi: 10.1152/physiolgenomics.00261.2007. [DOI] [PubMed] [Google Scholar]
- Zymek P, Bujak M, Chatila K, et al. The role of platelet-derived growth factor signaling in healing myocardial infarcts. J. Am. Coll. Cardiol. 2006;48:2315–2323. doi: 10.1016/j.jacc.2006.07.060. [DOI] [PubMed] [Google Scholar]


