

Abstract
Objective
To assess the impact of employing a variety of controls for hospital quality and patient burden of illness on the mean estimated inefficiency and relative ranking of hospitals generated by stochastic frontier analysis (SFA).
Study Setting
This study included urban U.S. hospitals in 20 states operating in 2001.
Data Design/Data Collection
We took hospital data for 1,290 hospitals from the American Hospital Association Annual Survey and the Medicare Cost Reports. We employed a variety of controls for hospital quality and patient burden of illness. Among the variables we used were a subset of the quality indicators generated from the application of the Patient Safety Indicator and Inpatient Quality Indicator modules of the Agency for Healthcare Research and Quality, Quality Indicator software to the Healthcare Cost and Utilization Project (HCUP), State Inpatient Databases. Measures of a component of patient burden of illness came from the application of the Comorbidity Software to HCUP data.
Data Analysis
We used SFA to estimate hospital cost-inefficiency. We tested key assumptions of the SFA model with likelihood ratio tests.
Principal Findings
The measures produced by the Comorbidity Software appear to account for variations in patient burden of illness that had previously been masquerading as inefficiency. Outcome measures of quality can provide useful insight into a hospital's operations but may have little impact on estimated inefficiency once controls for structural quality and patient burden of illness have been employed.
Conclusions
Choices about controlling for quality and patient burden of illness can have a nontrivial impact on mean estimated hospital inefficiency and the relative ranking of hospitals generated by SFA.
Keywords: Hospital efficiency, stochastic frontier analysis, hospital quality, patient safety
Fueled by rising health care expenditures, greater attention has recently gone toward health care efficiency and its measurement. For stakeholders to evaluate their progress and to make informed choices about quality improvement strategies, the impact of their decisions on both quality and efficiency needs to be understood. Scientifically valid measures of efficiency can yield insight into the escalating costs of health care, help identify the different sources of efficiency, and be used in organizational improvement, public reporting, and pay for performance.
A recent report prepared for the Agency for Healthcare Research and Quality (AHRQ) by the RAND Corporation provides a scan of existing efficiency measures in both the published and unpublished literatures. This report finds that most existing efficiency measures do not explicitly account for provider quality of care. (It also clarifies the concepts of “efficiency” and “costs” [McGlynn 2008].)
Employers, insurers, and purchasing groups have used ratio-based measures, such as expense per adjusted admission, to capture hospital efficiency. While these measures may be risk-adjusted, quality is not explicitly considered and is implicitly assumed to be equal across hospitals.
The published literature primarily consists of the application of stochastic frontier analysis (SFA), an econometric technique, and data envelopment analysis (DEA), a mathematical programming technique, to hospital data. These frontier approaches measure provider-level inefficiency as a departure from an estimated best-practice frontier (BPF). See Worthington (2004) and Rosko and Mutter (2008) for reviews.
There have been numerous calls in the literature for the explicit incorporation of controls for quality in frontier studies. In discussing the SFA literature, Li and Rosenman (2001) note that “much empirical work in estimating hospital costs has been criticized as failing to control for quality in the model, which gives rise to possible biases” (p. 78). Indeed, Folland and Hofler (2001), McKay, Deily, and Dorner (2002/2003), and Rosko (2004) note the difficultly in obtaining data that adequately adjusts for quality and express caution about the effects of omitting quality variables in SFA studies.
This article contributes to the literature by explicitly incorporating quality of care and patient burden of illness measures (i.e., factors that predispose a patient to require more resources) in the hospital cost function used in the conduct of SFA. (Valdmanis, Rosko, and Mutter [2008] examine the incorporation of quality measures in an advance of DEA.) We also compared strategies for controlling multiple dimensions of patient burden of illness, something which has received even less attention in the SFA literature than quality. Elixhauser et al. (1998) provide a detailed discussion of patient burden of illness and describe its components.
We tested the impact of including quality measures and controls for patient burden of illness on both the mean estimated hospital inefficiency for the sample, as well as on the relative ranking of hospitals. We used a variety of strategies that reflect the different data sources available to researchers, as well as the multidimensional nature of hospital quality and the different concepts involved in patient burden of illness. As a byproduct of our analyses, we assessed the association of various measures of hospital quality and patient burden of illness with cost.
BACKGROUND
SFA
SFA was proposed by Aigner, Lovell, and Schmidt (1977) and Meeusen and van den Broeck (1977). SFA decomposes variations from the cost BPF into a random (or classical) error and a strictly positive, deterministic error, which is assumed to represent, in the case of this study, cost inefficiency. Cost inefficiency is defined as the percentage by which observed costs exceed minimum costs predicted for the BPF (Lovell 1993).
Recent empirical work has relied on SFA to estimate the association of a variety of hospital characteristics and environmental pressures with hospital inefficiency. Several studies have examined the relationship between hospital quality and inefficiency. McKay and Deily (2005) place hospitals into categories of low and high performers based on risk-adjusted excess mortality and SFA-derived inefficiency. They identify the characteristics of institutions in both performance groups. Deily and McKay (2006) examine the association between SFA-derived hospital inefficiency and risk-adjusted excess mortality in Florida and find that lower cost inefficiency is associated with fewer in-hospital deaths. As they note, their analysis raises questions about controlling for quality in the use of SFA to derive hospital inefficiency estimates.
Controlling for Quality
Zuckerman, Hadley, and Iezzoni (1994) note that “it is essential … that the relationship between quality and cost be accounted for in the measurement of inefficiency” (p. 256). In their seminal study, they controlled for quality using the ratio of actual-to-predicted 30-day mortality rates made available by the Health Care Financing Administration (HCFA, now the Centers for Medicare & Medicaid Services [CMS]) and patient safety event rates produced by the application of the Iezzoni et al. (1992) algorithms to MEDPAR data. The HCFA mortality rates are no longer produced, and the strategy of Iezzoni et al. (1992) for controlling for complications is unlikely to be accessible to most researchers.
A limited number of approaches have been used to control for hospital quality in recent SFA studies. These approaches can be categorized into Donabedian's (2003) structure-process-outcome schema as applied by Romano and Mutter (2004) to empirical studies of hospitals.
Structural measures of quality encompass the conditions under which care is provided and reflect the resources available to providers in treating patients. Teaching status and Joint Commission on Accreditation of Healthcare Organizations ( JCAHO) accreditation are examples that have been frequently applied in SFA studies.
There are a number of limitations to structural measures of quality: hospitals with structural advantages can nevertheless produce low-quality care, and hospitals with structural disadvantages can overcome them to produce high-quality care. Also, the policy implications of finding an impact of structural measures of quality can be limited, because many structural measures of quality cannot be changed in a short time period.
Process measures of quality reflect the activities providers perform in caring for patients. No SFA study has used process measures, although the Hospital Compare project has recently made hospital process of care measures more accessible.1
Outcome measures of quality are of inherent interest to consumers. Among the outcome measures that have recently been included in SFA studies are the risk-adjusted, all-causes excess mortality rate provided by Solucient Inc. (Carey 2003; Rosko et al. 2007; Rosko and Mutter 2008), an infant mortality index (Frech and Mobley 2000), in-hospital complication rates (Sari 2003; Rosko and Mutter 2008), and in-hospital mortality rates (Rosko and Mutter 2008).
Controlling for Patient Burden of Illness
Patient burden of illness refers to factors that predispose a patient to require more resources. Zuckerman, Hadley, and Iezzoni (1994) controlled for severity, one dimension of patient burden of illness, with a modified version of the Medicare Case Mix Index (MCMI). A study of Pennsylvania hospitals found that MCMI is highly correlated (r>0.90) with a Diagnosis Related Group (DRG) case-mix index based on all patients (Rosko and Carpenter 1994). It is common in the SFA literature to use MCMI to control for case-mix complexity (Rosko and Mutter 2008).
Yet as Elixhauser et al. (1998) note, primary diagnosis is only part of the overall patient burden of illness. They contend that it consists of five components: (1) the primary reason for admission to the hospital, (2) the severity of the principal diagnosis, (3) iatrogenic complications, (4) comorbidities that are unrelated to the primary diagnosis and yet have a substantial impact on both the resources used to treat the patient and the outcomes of the care provided, and (5) unimportant comorbidities that have a trivial impact on resources used for treatment and on the patient's outcomes. Rosko and Chilingerian (1999) reported that the addition of intra-DRG severity of illness variables to a model that already had a case-mix index had little impact on results. SFA studies have not directly accounted for the impact of the fourth concept in controlling for patient burden of illness.
METHODS AND DATA
Empirical Strategy
We used an SFA model developed by Jondrow et al. (1982) to estimate hospital cost-inefficiency. We assume a cost function of the following general form:
| (1) |
where TC represents total costs, Y is a vector of outputs, W is a vector of input prices, PD is a vector of product descriptors, and e is the error term, which can be decomposed as follows:
| (2) |
where v is statistical noise assumed to be distributed as N (0, σ2).
The stochastic total cost frontier is defined by the value total costs would be if ui were zero. Battese, Heshmati, and Hjalmarsson (1998) show that
| (3) |
where CEt is cost efficiency, and ui consists of strictly positive departures from the cost frontier.
There are many different specifications that could be used to estimate a frontier cost function. In developing a preferred model, the following decisions had to be made: (1) should ordinary least squares or SFA be used; (2) what should the structural form of the cost function be; and (3) what theoretical distribution should the composed error follow? These choices are not determined by theory, but they can be guided by empirical tests.
Our preferred model was based on the results of a number of likelihood ratio tests (Greene 2003). See Supplementary Table S1. As result of the tests, we used SFA, a translog cost function, and assumed the composed error followed a truncated normal distribution.
Data
This study was conducted at the hospital level. In order that we might include a subset of quality indicators from the application of the Inpatient Quality Indicator (IQI) and Patient Safety Indicator (PSI) modules of the AHRQ Quality Indicator (QI ) software2 to inpatient data from the Healthcare Cost and Utilization Project (HCUP),3 we restricted our analysis to 20 states4 for which HCUP State Inpatient Databases (SID)5 were available. There were 1,601 nonfederal, urban, general hospitals in those 20 states. Over 300 hospitals were eliminated from the sample because of key missing variables in the American Hospital Association (AHA) Annual Survey of Hospital data, which was also used for this study, or because they had missing observations for some of the QIs that we used. Thus, our sample consisted of 1,290 urban, acute-care hospitals for which complete data were available for 2001. As shown in Table 1 below, these hospitals were larger, on average, than the universe of urban, acute-care hospitals in the 20 states. However, they were fairly similar on a number of important dimensions including: proportion of public hospitals and several case- and payer-mix variables.
Table 1.
Descriptive Statistics of Characteristics of All Urban, Acute-Care Hospitals in 20 States and Sample Hospitals
| Variable | Mean, All | SD, All | Mean, Sample | SD, Sample |
|---|---|---|---|---|
| % Public | 10.43% | 30.58 | 10.00% | 30.00 |
| % Nonprofit | 70.15% | 45.78 | 72.64% | 44.60 |
| % Forprofit | 19.42% | 39.57 | 17.36% | 37.89 |
| Beds | 258.58 | 211.70 | 276.96 | 207.46 |
| % Medicare discharges | 42.13% | 12.30 | 41.67% | 11.65 |
| % Medicaid discharges | 15.76% | 11.02 | 15.86% | 10.86 |
| % Surgical discharges | 29.30% | 16.65 | 29.10% | 13.36 |
| Teaching hospital | 41.03% | 49.85 | 44.23% | 49.02 |
We augmented AHA data with two variables from the Medicare Hospital Cost Report Minimum Data Set: days in nontraditional hospital units (i.e., skilled nursing facility, long-term care, hospice, etc.) and price of capital.
Cost Function
As noted above, we used a hybrid translog cost function to estimate the stochastic cost frontier for our sample of hospitals. It can be expressed as follows:
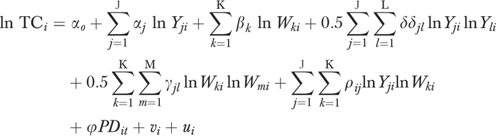 |
(4) |
We imposed the standard assumption of linear homogeneity in input prices by normalizing the equation by the wage rate. The continuous output and input price variables were log-transformed.
The price of two inputs, capital (Pk) and labor (Pl), are recognized by the cost-function. Pl was approximated by the area average of salary and benefits per full-time equivalent employee, and Pk was approximated by area average depreciation and interest expenses per bed. This approach is similar to that used by Dor and Farley (1996).
The outputs in the cost function included inpatient admissions (ADMITS), outpatient visits (OPV), and patient days in nonacute care units (OTHERDAYS). We used patient days for the latter variable because compared with acute care units, the length of stay in these units is much longer and more variable. While a long length of stay may be appropriate in long-term care units, it may reflect inefficient patient management processes in acute care units. Accordingly, we did not include postadmission patient days as an output.
We conducted Hausman tests of the null hypotheses that the outputs were exogenous. We could reject this hypothesis only for ADMITS. Accordingly, this variable was replaced by an instrument. The R 2 was 0.76 in the ADMITS prediction equation. It was 0.59 and 0.43, respectively, when OPV and OTHERDAYS were modeled. The instruments for each of the output's equations included the population rank of the Primary Metropolitan Statistical Area central city in which the hospital is located, bed size code, median income, percent population aged 5 and younger, population aged 65 and older, and a vector of k−1 regional binary variables. In addition, we included two unique variables in each output equation. These included short-term beds in county and population per bed in the county in the ADMITS equation; number of ambulatory surgical facilities, and percentage of population without health insurance in the OPV equation; and number of skilled nursing facility beds in the county and number of long-term hospitals in the county in the OTHERDAYS equation.
We used a variety of product descriptor variables to control for the heterogeneity of output in hospitals. We included a binary variable, HITECH6, for the availability of six or more of the eight high technology services described by Zuckerman, Hadley, and Iezzoni (1994). Hospitals that offer more of these services are likely to attract more patients with high resource requirements. We also included two variables suggested by Dor and Farley (1996): ER% (emergency room visits as a percent of total outpatient visits) and OUTSURG% (outpatient surgery as a percent of total outpatient visits). Each is expected to have a positive relationship with total costs.
A key concern and the central part of this study is that variations in hospital quality and patient burden of illness might masquerade as inefficiency if appropriate controls are not used. Accordingly, we included structural and outcome measures of quality in our models, as well as a variety of strategies for controlling for patient burden of illness. We varied these measures to assess robustness of results across models.
Model 1
Model 1 contains the aforementioned input price, output, and product descriptor variables, as well as the MCMI to control for variations in case-mix complexity. The MCMI is weighted according to the relative costliness of DRGs into which the hospital's patients have been classified.
Taylor, Whellan, and Sloan (1999) reported that quality of care was positively associated with teaching activities. Therefore, Model 1 also includes two binary teaching variables to represent different levels of commitment to graduate medical education—membership in the Council of Teaching Hospitals (COTH) and non-COTH hospitals with one or more medical residents or interns. COTH members tend to have a much higher ratio of interns and residents per bed than non-COTH teaching hospitals.
Model 2
Model 2 consists of Model 1 with the addition of an outcome measure of quality—Solucient's all-causes, risk-adjusted, excess in-hospital mortality rate index for Medicare patients, MORTINDX.
Model 3
We next employ an alternative approach to controlling for outcomes. We use condition-specific, risk-adjusted mortality rates estimated by the IQI module of the AHRQ QI software because hospital-level variations among the IQI rates may be associated with differences in quality of care (Andrews, Russo, and Pancholi 2007). Moreover, they may be more accurate indicators of a hospital's performance than an all-causes mortality rate, because Rosenthal (1997) finds that correlations between standardized hospital mortality ratios for diagnoses and procedures commonly used to measure hospital quality are quite low. Therefore, combining mortality rates across conditions and procedures into a single measure may be misleading.
We also include a set of measures estimated by the PSI module that capture complicating factors that should not occur with good medical care, yet do not necessarily lead to death. Zhan and Miller (2003) note that the PSIs are “similar” to the Iezzoni et al. (1992) algorithms used by Zuckerman, Hadley, and Iezzoni (1994). Indeed, Romano et al. (2003) note that the Iezzoni et al. (1992) algorithms were “an especially important source” in the development of the PSIs (p. 155). Zhan and Miller (2003) find that the occurrences of many of the PSI events are associated with excess length of stay, excess charges, and excess mortality.
A subset of the IQIs and PSIs was used in the 2006 National Healthcare Quality Report to measure the effectiveness of care and patient safety, respectively (AHRQ 2006). The AHRQ QIs have begun to be used for pay-for-performance, and 12 states currently use the AHRQ QIs for public reporting.
To maintain an adequate sample size, we selected the following risk-adjusted IQIs and PSIs, which had at least 1,400 nonmissing observations (out of a sample of 1,459 urban hospitals in the 20 HCUP states that had nonmissing observations for the AHA variables of interest): mortality rates for acute myocardial infarction (AMI), congestive heart failure (CHF), stroke, gastrointestinal hemorrhage, and pneumonia; failure to rescue rate; iatrogenic pneumothorax rate; infection due to medical care rate, and accidental puncture or laceration rate.6 All of these are in-hospital rates. We Box-Cox transformed these variables because some hospitals had observations with values of zero.
Model 4
Model 4 consists of Model 1 plus controls for the fourth component of patient burden of illness. We add 30 hospital-level rates of comorbidities per admission, which we log transform. The comorbidities were identified by the application of the Comorbidity Software 7 to HCUP data. They estimate the presence of comorbidities that are unrelated to the principal diagnosis but which have an important impact on the resources used in the treatment of patients and on the outcomes of the care they receive. Indeed, Elixhauser et al. (1998) note that these 30 comorbidities are associated with longer length of stay, higher hospital charges, and greater risk of in-hospital mortality. In an analysis of the external validity of the Comorbidity Software, Stukenborg, Wagner, and Connors (2001) find that the approach of Elixhauser et al. (1998) outperforms the alternative Charlson-Deyo method for measuring comorbidities.
Model 5
Model 5 controls for multiple aspects of patient burden of illness: it contains the Model 4 variables plus MORTINDX. We could not estimate a model with the comorbidity variables and the AHRQ QIs because the risk-adjustment strategy for the PSIs relies, in part, on the Comorbidity Software.
Descriptive statistics for hospital cost function variables are provided in Table 2. (Descriptive statistics for comorbidity variables are available in Supplementary Table S2.) The descriptive statistics reported in this study are very similar to those reported in other recent studies (e.g., Romano et al. 2003; Andrews, Russo, and Pancholi 2007; Rosko et al. 2007).
Table 2.
Descriptive Statistics of Cost Function Variables
| Variable | Description | Mean | SD |
|---|---|---|---|
| Basic cost function variables | |||
| Total cost | Total expenses | $147,048,306 | 157,415,077 |
| Pk | Area average depreciation and interest expenses per bed | $39,328.32 | 8,127.94 |
| Pl | Area average of salary and benefits per FTE | $50,673.20 | 6,102.46 |
| ADMITS | Total inpatient admissions | 12,815.92 | 9,626.98 |
| OPV | Total outpatient visits | 182,317.60 | 183,017.87 |
| OTHERDAYS | Total patient days in non-acute care units | 16,165.17 | 19,469.40 |
| HITECH6 | Binary variable for hospitals that have at least six of eight high technology services | 0.35 | 0.48 |
| ER% | Emergency room visits as a percent of total outpatient visits × 100 | 28.49% | 16.42 |
| OUTSURG% | Outpatient surgery as a percent of total outpatient visits × 100 | 4.52% | 4.03 |
| Structural measures of quality | |||
| COTH | Binary variable for member of Council of Teaching Hospitals | 0.12 | 0.32 |
| MNTEACH | Binary variable for hospitals that are not COTH-members but have at least one FTE medical resident | 0.32 | 0.47 |
| Outcome measures of quality | |||
| MORTINDX | All-causes, risk-adjusted excess mortality rate index for Medicare patients | 0.99 | 0.25 |
| BRPPS04 | Risk-adjusted failure to rescue rate | 0.14216 | 0.03942 |
| BRPPS06 | Risk-adjusted iatrogenic pneumothorax rate | 0.00081 | 0.00052 |
| BRPPS07 | Risk-adjusted infection due to medical care rate | 0.00195 | 0.00119 |
| BRPPS15 | Risk-adjusted accidental puncture/ laceration rate | 0.00345 | 0.00180 |
| BRPIQ15 | Risk-adjusted in-hospital mortality rate for AMI | 0.10800 | 0.04670 |
| BRPIQ16 | Risk-adjusted in-hospital mortality rate for CHF | 0.04572 | 0.01893 |
| BRPIQ17 | Risk-adjusted in-hospital mortality rate for stroke | 0.11187 | 0.03679 |
| BRPIQ18 | Risk-adjusted in-hospital mortality rate for gastrointenstinal hemorrhage | 0.03241 | 0.01677 |
| BRPIQ20 | Risk-adjusted in-hospital mortality rate for pneumonia | 0.08588 | 0.02601 |
| Patient burden of illness | |||
| MCMI | Medicare case-mix index | 1.40 | 0.22 |
The parameters of the cost frontier were estimated by a maximum likelihood method using the Frontier 4.1 program (Coelli 1996).
RESULTS
We report coefficients for the basic cost function variables, as well as the controls for quality, in Table 3.8
Table 3.
Cost Function Coefficient Estimates by Model†
| Variable | Model 1 | Model 2 | Model 3 | Model 4‡ | Model 5‡ |
|---|---|---|---|---|---|
| Basic cost function variables§ | |||||
| Pk | 0.05230 | −0.28283 | −0.79700 | −2.22090*** | −2.01968*** |
| (0.09050) | (−0.47516) | (−1.08134) | (−4.78040) | (−4.30406) | |
| ADMITS | 1.69109*** | 1.66657*** | 1.36139*** | 0.57955 | 0.57822 |
| (3.66947) | (3.59595) | (2.74227) | (1.51392) | (1.51393) | |
| OPV | 1.06611*** | 1.07961*** | 1.11353*** | 0.07769 | 0.06285 |
| (2.92670) | (2.96417) | (2.98350) | (0.26795) | (0.21695) | |
| OTHERDAYS | 0.06125 | 0.07012 | 0.11460 | 0.31735*** | 0.31652*** |
| (0.48850) | (0.55710) | (0.89385) | (3.07570) | (3.06815) | |
| HITECH6 | 0.018354 | 0.02039 | 0.01983 | −0.00528 | −0.00612 |
| (1.04558) | (1.15954) | (1.13947) | (−0.37662) | (−0.43744) | |
| ER% | 0.00534*** | 0.00533*** | 0.00533*** | 0.00125** | 0.00125** |
| (9.37014) | (9.35103) | (9.36370) | (2.55344) | (2.55200) | |
| OUTSURG% | 0.02813*** | 0.02838*** | 0.02860*** | 0.01772*** | 0.017635*** |
| (12.80380) | (12.93330) | (13.09827) | (9.18021) | (9.15118) | |
| Structural measures of quality | |||||
| COTH | 0.40159*** | 0.40388*** | 0.39510*** | 0.25479*** | 0.25391*** |
| (13.26709) | (13.46845) | (12.95458) | (9.66980) | (9.64932) | |
| MNTEACH | 0.08064*** | 0.08494*** | 0.08420*** | 0.05838*** | 0.05600*** |
| (4.64973) | (4.86555) | (4.87239) | (4.13985) | (3.95178) | |
| Patient burden of illness | |||||
| MCMI | 0.39710*** | 0.39170*** | 0.37518*** | 0.29445*** | 0.29725*** |
| (8.11512) | (8.00441) | (7.50663) | (6.71551) | (6.82604) | |
| Outcome measures of quality | |||||
| MORTINDX | 0.05723* | −0.03873 | |||
| (1.92106) | (−1.50973) | ||||
| BRPPS04 | 0.33326** | ||||
| (2.17169) | |||||
| BRPPS06 | −0.47847** | ||||
| (−1.98917) | |||||
| BRPPS07 | 0.20461** | ||||
| (1.99322) | |||||
| BRPPS15 | −0.01021 | ||||
| (−0.19142) | |||||
| BRPIQ15 | −0.06308 | ||||
| (−1.43433) | |||||
| BRPIQ16 | −0.04742 | ||||
| (−0.62889) | |||||
| BRPIQ17 | −0.07821 | ||||
| (−1.11298) | |||||
| BRPIQ18 | −0.14756*** | ||||
| (−2.69600) | |||||
| BRPIQ20 | −0.46056** | ||||
| (−2.25060) | |||||
| Includes 30 comorbidity variables | No | No | No | Yes | Yes |
t-statistics are in parentheses.
This model also includes the 30 variables identified by the Comorbidity Software. Full results are available from the authors upon request.
We used a translog specification. Full results are available from the authors upon request.
Significant at the 1% level.
Significant at the 5% level.
Significant at the 10% level.
Cost Function Variables
The coefficient on the MCMI in Model 1 was positive and highly significant and remained so in all subsequent models in which it was used. The coefficients on the teaching status variables were also positive and highly significant across models.
MORTINDX was positive and significant in Model 2. This result suggests that a higher risk-adjusted mortality rate is associated with higher costs.
The appropriateness of including the AHRQ QIs in Model 3 was confirmed by a likelihood ratio test of the hypothesis that the coefficients on all of these variables were equal to 0 (λ=35.3, p<.01). The coefficients on failure to rescue and infection due to medical care were positive and statistically significant. These results reflect the findings of Zhan and Miller (2003), who report that infection due to medical care is associated with excess charges of $38,656.9
The coefficient on iatrogenic pneumothorax was negative and statistically significant even though Zhan and Miller (2003) find that this event is associated with excess charges of $17,312. Our result might reflect the cost savings that can occur by substituting care by physicians with care by residents. Indeed, McDonald et al. (2002) note that higher iatrogenic pneumothorax rates can be associated with higher rates of procedure performance by new residents.
The coefficients on the in-hospital mortality rate for gastrointestinal hemorrhage and pneumonia were negative and statistically significant. This might suggest that lower mortality rates are associated with higher costs, a result that could reflect the resources that hospitals must invest to reduce patient in-hospital mortality. Alternatively, it could reflect the fact that death shortens length of stay and shorter lengths of stay cost less ceteris paribus.
The comorbidity variables were significant as a group in Model 4 (λ=619.9, p<.01). Nine of the comorbidity variables had coefficients that were statistically significant and of the expected, positive sign. They are hypertension, paralysis, uncomplicated diabetes, complicated diabetes, liver failure, metastatic cancer, rheumatoid arthritis/collagen vascular diseases, coagulopathy, and psychoses. Five of the comorbidity variables had coefficients that were statistically significant and of an unexpected, negative sign. They are CHF, peripheral vascular disorders, other neurological disorders, solid tumor without metastasis, and blood loss anemia.
The positive coefficients on the comorbidity variables are supported by Elixhauser et al. (1998). The negative coefficients are surprising. Multicollinearity is a possible explanation for the finding. Indeed, there are some very high correlations among the hospital-level rates of comorbidities per admission.10Greene (2003) notes that multicollinearity problems are often characterized by shifts in the sign and magnitude of coefficients when small changes are made to the sample size. However, running Model 4 on an 85 percent random sample of the data resulted in very little change in the coefficients.11
The coefficient on MORTINDX was insignificant in Model 5, and the addition of MORTINDX to Model 4 did not result in any significant changes to the parameter estimates for Model 4.
Estimated Mean Inefficiency
Table 4 shows the impact that the various strategies for controlling for quality and patient burden of illness had on the mean inefficiency estimated for the hospitals in the sample. Models 1, 2, and 3 yielded very similar results. The most substantial drop occurred as a result of the inclusion of the comorbidity variables. This highlights the concern that in under-specified models variations in patient burden of illness might masquerade as inefficiency.
Table 4.
Estimated Hospital Inefficiency by Strategy
| Model | Mean | SD | Minimum | Maximum |
|---|---|---|---|---|
| Model 1 | 0.17353 | 0.10996 | 0.041348 | 1.40288 |
| Model 2 | 0.17209 | 0.10815 | 0.04196 | 1.39364 |
| Model 3 | 0.17340 | 0.11027 | 0.04138 | 1.36254 |
| Model 4 | 0.14256 | 0.08948 | 0.02953 | 1.00059 |
| Model 5 | 0.14448 | 0.09178 | 0.02956 | 1.02019 |
Correlations among Models
Table 5 provides the Pearson correlations among the hospital-level inefficiency estimates produced by the various models. The first column gives an indication of the benefit of additional controls for quality and patient burden of illness. The most dramatic change comes with the addition of the comorbidity variables in Model 4. The correlations among Models 1, 2, and 3 are very high (rxy>0.992), indicating that little changes to the model with teaching status and the MCMI occur when outcome measures of quality are included. The correlation between Models 4 and 5 is very high (rxy=0.999), providing further evidence that changes to the model with teaching status and patient burden of illness are small when outcome measures of quality are added. Spearman's rank correlation coefficients, which are displayed in Supplementary Table S3, mirror the Pearson correlation coefficients for these models.
Table 5.
Pearson's Correlations
| Model | 1 | 2 | 3 | 4 | 5 |
|---|---|---|---|---|---|
| 1 | 1.000 | ||||
| 2 | 0.999 | 1.000 | |||
| 3 | 0.990 | 0.992 | 1.000 | ||
| 4 | 0.801 | 0.802 | 0.808 | 1.000 | |
| 5 | 0.801 | 0.799 | 0.806 | 0.999 | 1.000 |
DISCUSSION
We find that controls for quality and patient burden of illness can have a nontrivial impact on the inferences derived from SFA about hospital performance.
The AHRQ QIs have the advantage of taking the multidimensional nature of hospital quality into account. As the coefficients on the AHRQ QIs show, measures of hospital quality can have conflicting effects on hospital costs. A single measure that combines these effects into one variable offers less insight into hospital performance. Indeed, the perspective it provides may be misleading because the measure is taking so many factors into account.
However, the AHRQ QIs, as well as some of the other controls employed in this analysis, may not be accessible to all researchers. Our results indicate that the impact on both mean estimated hospital inefficiency and the ranking of hospitals of accounting for outcome measures of quality is small once controls for patient burden of illness and teaching status have been employed. Therefore, researchers estimating average institutional inefficiency for aggregate groups of hospitals can be less concerned about how they control for outcome measures of quality than researchers attempting to use hospital cost functions to understand the trade-offs between cost and quality.
The negative coefficients on some of the comorbidity variables were unexpected. However, we are inclined not to attach too much importance to the sign of the coefficients. The measures generated by the Comorbidity Software reflect secondary diagnoses that are unrelated to the principal reason for admission. So, a person admitted for a broken leg (who is also depressed) will probably be much less costly to treat than a person admitted for a stroke (who is also depressed). Thus, while we may not put too much trust on the signs of the coefficients, the variables as a group might be capturing some previously unexplained patient burden of illness that had been masquerading as inefficiency.
Our results suggest that users of SFA who want to measure overall hospital inefficiency or to investigate inefficiency differences among groups of hospitals may want to use the Comorbidity Software variables. If they do not use these measures, they might want to view the overall inefficiency measure they generate as an upper bound. They also might want to be aware that differential differences in patient burden of illness across hospitals could be influencing their results. Analysts seeking to investigate the cost impacts of control variables might want to be more cautious about using the comorbidity variables because of multicollinearity concerns.
Our estimated mean cost-inefficiencies ranged from 14.8 to 17.3 percent. Before our study, Zuckerman, Hadley, and Iezzoni (1994) used the most extensive set of outcome and product descriptor variables in hospital SFA. Their estimates dropped from 18.8 percent in a basic model to 13.6 percent in the model with the most control variables, a range very similar ours. The estimates in both studies fall in the middle of estimates obtained from national SFA studies of hospitals that ranged from 10.8 to 25.5 percent. The largest estimated mean inefficiency was obtained from a study (Rosko 1999) that did not include mortality rates and used relatively few product descriptor variables. Our analysis suggests that this is the type of study where we would expect to have output heterogeneity masquerading as inefficiency, thereby inflating inefficiency estimates. This reinforces our contention that it is important to include comorbidities and other product descriptors in the cost function. Our analysis of the literature suggests that SFA estimates over time and across methods have been quite stable, especially among the more completely specified models.
We are unaware of other SFA applications have attempted to control for the multiple concepts that comprise patient burden of illness, especially important comorbidities that are unrelated to the principal diagnosis. Thus, our findings indicate that SFA is a powerful analytic technique that is still in its developmental stage. This, of course, does not preclude it from being used to analyze categories of hospitals (e.g., for-profit and non-for-profit institutions). Even researchers who contend that SFA generates estimates that are insufficiently robust to be used to reward individual hospital performance believe that it can be used to assess the efficiency of categories of hospitals (e.g., Folland and Hofler 2001).
Thus, the results of this study combined with those from Rosko and Mutter (2008) who found that cost-inefficiency estimates are not very sensitive to assumptions about the composed error, quality measures, and structure of production suggest that SFA can be a very useful tool for analyzing the cost-inefficiency of different groups of hospitals when a fully specified model is used.
Acknowledgments
Joint Acknowledgement/Disclosure Statement: Dr. Ryan Mutter and Dr. Herbert Wong are employees of the Agency for Healthcare Research and Quality, which provides the Healthcare Cost and Utilization Project (HCUP) data, as well as the Quality Indicator (QI) software and Comorbidity software, which are used in this paper.
We gratefully acknowledge the data organizations in participating states that contributed data to the Healthcare Cost and Utilization Project (HCUP) and that we used in this study: the Arizona Department of Health Services; California Office of Statewide Health Planning & Development; Colorado Health & Hospital Association; Florida Agency for Health Care Administration; Illinois Health Care Cost Containment Council; Iowa Hospital Association; Maine Health Data Organization; Maryland Health Services Cost Review Commission; Massachusetts Division of Health Care Finance and Policy; New Jersey Department of Health and Senior Services; New York State Department of Health; North Carolina Department of Health and Human Services; Oregon Association of Hospitals and Health Systems; Pennsylvania Health Care Cost Containment Council; South Carolina State Budget and Control Board; Texas Department of State Health Services; Utah Department of Health; Virginia Health Information; Washington State Department of Health; and Wisconsin Department of Health and Family Services.
We gratefully acknowledge helpful suggestions from participants at the 2006 conference of the American Society of Health Economists (ASHE).
Michael Rosko's effort was partially supported by a Widener University, School of Business Administration Dean's Summer Grant.
Disclaimers: This paper does not represent the policy of either the Agency for Healthcare Research and Quality (AHRQ) or the U.S. Department of Health and Human Services (DHHS). The views expressed herein are those of the authors and no official endorsement by AHRQ or DHHS is intended or should be inferred.
Footnotes
Hospital Compare is a consumer-oriented website providing information on how well hospitals give recommended care to patients. For more information, see http://www.cms.hhs.gov/HospitalQualityInits/25_HospitalCompare.asp
AHRQ makes this software available for free at http://www.qualityindicators.ahrq.gov
HCUP is a family of health care databases and related software tools developed through a Federal–State–Industry partnership to build a multistate health data resource for health care research and decisionmaking. For more information, go to http://www.hcup-us.ahrq.gov/home.jsp
The 20 states are Arizona, California, Colorado, Florida, Illinois, Iowa, Maine, Maryland, Massachusetts, New Jersey, New York, North Carolina, Oregon, Pennsylvania, South Carolina, Texas, Utah, Virginia, Washington, and Wisconsin.
For each participating state, the SID contains the discharge record for every inpatient hospitalization that occurred. For more information, see http://www.hcup-us.ahrq.gov/sidoverview.jsp
We exclude decubitus ulcer rate and postoperative pulmonary embolism or deep vein thrombosis rate because Houchens, Elixhauser, and Romano (2008) find that a high percentage of the events that the AHRQ PSI software identifies for these measures are present on admission and are, therefore, not indicators of hospital quality.
Comorbidity Software is one in a family of databases and software tools developed as part of the HCUP project. It assigns variables that identify comorbidities in hospital discharge records using the diagnosis coding of the International Classification of Diseases, Ninth Edition, Clinical Modifications (ICD-9-CM). For more information, see http://www.hcup-us.ahrq.gov/toolssoftware/comorbidity/comorbidity.jsp
The counterintuitive signs for the coefficient of Pk in some models might be due to multicollinearity among the squared and cross-product variables of the cost function. As a check, we examined results from the Cobb–Douglas models (i.e., the translog function in which the parameters of the squared and cross-product terms are restricted to equal 0). In those models, the coefficients on Pk had the expected positive and significant coefficients.
Zhan and Miller (2003) do not calculate excess charges for failure to rescue. It would not have been meaningful, since the patient died during hospitalization.
For example, the correlation coefficient between cardiac arrhythmias and nine other comorbidity variables is 0.80 or higher.
As an additional check, we combined the 30 comorbidity variables into 18 clinically similar variables. We continued to get negative and significant coefficients, and many of the coefficients on the unaltered variables remained unchanged. Since Elixhauser et al. (1998) recommend against combining the comorbidity variables, we do not report these results.
NOTES
Supporting Information
Additional supporting information may be found in the online version of this article:
Author Matrix.
Likelihood ratio tests.
Descriptive statistics.
Spearman correlations.
Please note: Wiley-Blackwell is not responsible for the content or functionality of any supporting materials supplied by the authors. Any queries (other than missing material) should be directed to the corresponding author for the article.
REFERENCES
- Agency for Healthcare Research and Quality. National Healthcare Quality Report. Rockville, MD: U.S. Department of Health and Human Services, Agency for Healthcare Research and Quality; 2006. AHRQ Pub. No. 07-0013. [Google Scholar]
- Aigner D, Lovell C K, Schmidt P. Formulation and Estimation of Stochastic Frontier Production Models. Journal of Econometrics. 1977;6:21–37. [Google Scholar]
- Andrews R, Russo C, Pancholi M. Rockville, MD: Agency for Healthcare Research and Quality; 2007. Trends in Hospital Risk-Adjusted Mortality for Select Diagnosis and Procedures, 1994–2004. [accessed on April 15, 2008]. HCUP Statistical Brief #38. Available at http://www.hcup-us.ahrq.gov/reports/statbriefs/sb38.pdf. [PubMed] [Google Scholar]
- Battese G, Heshmati A, Hjalmarsson L. Efficiency of Labour Use in the Swedish Banking Industry: A Stochastic Frontier Approach. 1998. CEPA Working Paper 98/06, Armidale.
- Carey K. Hospital Cost Efficiency and System Membership. Inquiry. 2003;40:25–38. doi: 10.5034/inquiryjrnl_40.1.25. [DOI] [PubMed] [Google Scholar]
- Coelli T. A Guide to FRONTIER Version 4.1: A Computer Program for Stochastic Frontier Production and Cost Function Estimation. 1996. CEPA Working Paper 96/07, Armidale.
- Deily M, McKay N. Cost Inefficiency and Mortality Rates in Florida Hospitals. Health Economics. 2006;15:419–31. doi: 10.1002/hec.1078. [DOI] [PubMed] [Google Scholar]
- Donabedian A. An Introduction to Quality Assurance in Health Care. New York: Oxford University Press; 2003. [Google Scholar]
- Dor A, Farley D. Payment Source and the Cost of Hospital Care: Evidence from a Multiproduct Cost Function with Multiple Payers. Journal of Health Economics. 1996;15(1):1–22. doi: 10.1016/0167-6296(95)00029-1. [DOI] [PubMed] [Google Scholar]
- Elixhauser A, Steiner C, Harris R, Coffey R. Comorbidity Measures for Use with Administrative Data. Medical Care. 1998;36:8–27. doi: 10.1097/00005650-199801000-00004. [DOI] [PubMed] [Google Scholar]
- Folland S, Hofler R. How Reliable Are Hospital Efficiency Estimates? Health Economics. 2001;10:683–98. doi: 10.1002/hec.600. [DOI] [PubMed] [Google Scholar]
- Frech H, Mobley L. Efficiency, Growth, and Concentration: An Empirical Analysis of Hospital Markets. Economic Inquiry. 2000;38:369–84. [Google Scholar]
- Greene W. Econometric Analysis. 5th Edition. Upper Saddle River, NJ: Prentice-Hall; 2003. [Google Scholar]
- Houchens R, Elixhauser A, Romano P. How Often Are Potential ‘Patient Safety Events’ Present on Admission? Joint Commission Journal on Quality. 2008;34:154–63. doi: 10.1016/s1553-7250(08)34018-5. [DOI] [PubMed] [Google Scholar]
- Iezzoni L, Foley S, Heeren T, Daley J, Duncan C, Fisher E, Hughes J. A Method for Screening the Quality of Hospital Care Using Administrative Data: Preliminary Validation Results. Quality Review Bulletin. 1992;18:361–71. doi: 10.1016/s0097-5990(16)30557-7. [DOI] [PubMed] [Google Scholar]
- Jondrow J, Lovell C K, Materov I, Schmidt P. On the Estimation of Technical Efficiency in the Stochastic Frontier Production Function Model. Journal of Econometrics. 1982;19:233–8. [Google Scholar]
- Li T, Rosenman R. Cost Efficiency in Washington Hospitals: A Stochastic Frontier Approach Using Panel Data. Health Care Management Science. 2001;4:73–81. doi: 10.1023/a:1011493209102. [DOI] [PubMed] [Google Scholar]
- Lovell C K. Production Frontiers and Productive Efficiency. In: Fried H, Lovell C K, Schmidt S, editors. The Measurement of Productive Efficiency. New York: Oxford University Press; 1993. pp. 3–67. [Google Scholar]
- McDonald K, Romano P, Geppert J, Davies S, Duncan B, Shojania K. Rockville, MD: Agency for Healthcare Research and Quality; 2002. Measures of Patient Safety Based on Hospital Administrative Data – The Patient Safety Indicators. Technical Review 5 (Prepared by the University of California-Stanford Evidence-based Practice Center under Contract Number 290-97-0013). AHRQ Publication Number 02-0038. [PubMed] [Google Scholar]
- McGlynn E. Rockville, MD: Agency for Healthcare Research and Quality; 2008. Identifying, Categorizing, and Evaluating Health Care Efficiency Measures. Final Report (prepared by the Southern California Evidence-based Practice Center – RAND Corporation, under Contract No. 282-00-0005-21). AHRQ Publication No. 08-0030. [Google Scholar]
- McKay N, Deily M. Comparing High- and Low-Performing Hospitals Using Risk Adjusted Excess Mortality and Cost Inefficiency. Health Care Management Review. 2005;30:347–60. doi: 10.1097/00004010-200510000-00009. [DOI] [PubMed] [Google Scholar]
- McKay N, Deily M, Dorner F. Ownership and Changes in Hospital Inefficiency. Inquiry. 2002/2003;39:388–99. doi: 10.5034/inquiryjrnl_39.4.388. [DOI] [PubMed] [Google Scholar]
- Meeusen W, van den Broeck J. Efficiency Estimation from Cobb-Douglas Production Functions with Composed Error. International Economic Review. 1977;18:435–44. [Google Scholar]
- Romano P, Geppert J, Davies S, Miller M, Elixhauser A, McDonald K. A National Profile of Patient Safety in U.S. Hospitals. Health Affairs. 2003;22:154–66. doi: 10.1377/hlthaff.22.2.154. [DOI] [PubMed] [Google Scholar]
- Romano P, Mutter R. The Evolving Science of Quality Measures for Hospitals: Implications for Studies of Competition and Consolidation. International Journal of Health Care Finance and Economics. 2004;4:131–57. doi: 10.1023/B:IHFE.0000032420.18496.a4. [DOI] [PubMed] [Google Scholar]
- Rosenthal G. Weak Associations between Hospital Mortality Rates for Individual Diagnoses: Implications for Profiling Hospital Quality. American Journal of Public Health. 1997;87:429–33. doi: 10.2105/ajph.87.3.429. [DOI] [PMC free article] [PubMed] [Google Scholar]
- Rosko M. Impact of Internal and External Environmental Pressures on Hospital Inefficiency. Health Care Management Science. 1999;2:64–78. doi: 10.1023/a:1019031610741. [DOI] [PubMed] [Google Scholar]
- Rosko M. Performance of U.S. Academic Medical Centers: A Panel Analysis of Cost Inefficiency. Health Care Management Science. 2004;7:7–16. doi: 10.1023/b:hcms.0000005393.24012.1c. [DOI] [PubMed] [Google Scholar]
- Rosko M, Carpenter C. The Impact of Intra-DRG Severity of Illness on Hospital Profitability: Implications for Payment Reform. Journal of Health Politics, Policy, and Law. 1994;19:729–51. doi: 10.1215/03616878-19-4-729. [DOI] [PubMed] [Google Scholar]
- Rosko M, Chilingerian J. Estimating Hospital Inefficiency: Does Case Mix Matter? Journal of Medical Systems. 1999;23:51–71. doi: 10.1023/a:1020823612156. [DOI] [PubMed] [Google Scholar]
- Rosko M, Mutter R. Stochastic Frontier Analysis of Hospital Inefficiency: A Review of Empirical Issues and an Assessment of Robustness. Medical Care Research and Review. 2008;65:131–66. doi: 10.1177/1077558707307580. [DOI] [PubMed] [Google Scholar]
- Rosko M, Proenca J, Zinn J, Bazzoli G. The Impact of Membership in Different Types of Systems on Hospital Cost-Inefficiency. Inquiry. 2007;44:335–49. doi: 10.5034/inquiryjrnl_44.3.335. [DOI] [PubMed] [Google Scholar]
- Sari N. Efficiency Outcomes of Market Concentration and Managed Care. International Journal of Industrial Organization. 2003;21:1571–89. [Google Scholar]
- Stukenborg G, Wagner D, Connors A. Comparison of the Performance of Two Comorbidity Measures, with and without Information from Prior Hospitalizations. Medical Care. 2001;7:727–39. doi: 10.1097/00005650-200107000-00009. [DOI] [PubMed] [Google Scholar]
- Taylor D, Whellan D, Sloan F. Effects of Admission to a Teaching Hospital on the Cost and Quality of Care for Medicare Beneficiaries. New England Journal of Medicine. 1999;340:293–302. doi: 10.1056/NEJM199901283400408. [DOI] [PubMed] [Google Scholar]
- Valdmanis V, Rosko M, Mutter R. Hospital Quality, Efficiency, and Input Slack Differentials. Health Services Research. 2008 doi: 10.1111/j.1475-6773.2008.00893.x. DOI: 10.1111/j.1475-6773.2008.00893.x. [DOI] [PMC free article] [PubMed] [Google Scholar]
- Worthington A. Frontier Efficiency Measurement in Health Care: A Review of Empirical Techniques and Selected Applications. Medical Care Research and Review. 2004;61:135–70. doi: 10.1177/1077558704263796. [DOI] [PubMed] [Google Scholar]
- Zhan C, Miller M. Excess Length of Stay, Charges, and Mortality Attributable to Medical Injuries during Hospitalization. Journal of the American Medical Association. 2003;290:1868–74. doi: 10.1001/jama.290.14.1868. [DOI] [PubMed] [Google Scholar]
- Zuckerman S, Hadley J, Iezzoni L. Measuring Hospital Efficiency with Frontier Cost Functions. Journal of Health Economics. 1994;13:255–80. doi: 10.1016/0167-6296(94)90027-2. [DOI] [PubMed] [Google Scholar]
Associated Data
This section collects any data citations, data availability statements, or supplementary materials included in this article.
Supplementary Materials
Author Matrix.
Likelihood ratio tests.
Descriptive statistics.
Spearman correlations.