Abstract
Interstitial cells of Cajal (ICC) isolated from the rabbit urethra exhibit pacemaker activity that results from spontaneous Ca2+ waves. The purpose of this study was to investigate if this activity was influenced by Ca2+ uptake into mitochondria. Spontaneous Ca2+ waves were recorded using a Nipkow spinning disk confocal microscope and spontaneous transient inward currents (STICs) were recorded using the whole-cell patch clamp technique. Disruption of the mitochondrial membrane potential with the electron transport chain inhibitors rotenone (10 μm) and antimycin A (5 μm) abolished Ca2+ waves and increased basal Ca2+ levels. Similar results were achieved when mitochondria membrane potential was collapsed using the protonophores FCCP (0.2 μm) and CCCP (1 μm). Spontaneous Ca2+ waves were not inhibited by the ATP synthase inhibitor oligomycin (1 μm), suggesting that these effects were not attributable to an effect on ATP levels. STICs recorded under voltage clamp at −60 mV were also inhibited by CCCP and antimycin A. Dialysis of cells with the mitochondrial uniporter inhibitor RU360 (10 μm) also inhibited STICS. Stimulation of Ca2+ uptake into mitochondria using the plant flavonoid kaempferol (10 μm) induced a series of propagating Ca2+ waves. The kaempferol-induced activity was inhibited by application of caffeine (10 mm) or removal of extracellular Ca2+, but was not significantly affected by the IP3 receptor blocker 2-APB (100 μm). These data suggest that spontaneous Ca2+ waves in urethral ICC are regulated by buffering of cytoplasmic Ca2+ by mitochondria.
Interstitial cells of Cajal have now been reported in various smooth muscle organs located throughout the body including the gastro-intestinal (GI) tract (Sanders et al. 2006) and the upper and lower urinary tract (Klemm et al. 1999; Sergeant et al. 2000; McCloskey & Gurney, 2002). In the GI tract they are well recognized as specialized pacemaker cells which are responsible for the generation and co-ordination of electrical slow waves that regulate the phasic contractile activity of the gut (Sanders, 1996; Hirst & Ward, 2003; Sanders et al. 2006). ICC in the urethra are also thought to act as putative pacemakers, which regulate spontaneous myogenic tone in a frequency-dependent manner (Sergeant et al. 2000). The frequency of pacemaker activity in urethra ICC is regulated by both excitatory and inhibitory neurotransmitters, thus application of nitric oxide (NO) agonists decreased the frequency of the activity (Sergeant et al. 2006a), whereas noradrenaline increased the frequency (Sergeant et al. 2002). Pacemaker activity in isolated ICC from the rabbit urethra is characterized by spontaneous transient inward currents (STICs) recorded under voltage clamp and spontaneous transient depolarizations (STDs) under current clamp (Sergeant et al. 2000). Simultaneous patch clamp and Ca2+ imaging experiments revealed that spontaneous electrical activity of these cells is associated with global Ca2+ waves (Johnston et al. 2005; Sergeant et al. 2006a,b). The cellular mechanisms responsible for the regulation and generation of Ca2+ waves in these cells has been partly elucidated. For example, it was shown that inhibition of ryanodine receptors (RyRs) abolished the activity, whereas inhibition of inositol trisphosphate (IP3) production or IP3 receptors (IP3Rs) reduced the propagation of Ca2+ waves, unmasking multiple, uncoupled Ca2+ release events. Ca2+ waves were also found to be dependent on Ca2+ influx, thus removal of extracellular Ca2+ was found to inhibit Ca2+ waves by a mechanism that did not involve depletion of Ca2+ from stores (Johnston et al. 2005; Bradley et al. 2005).
It has now been shown in a range of cell types that the temporal and spatial profile of Ca2+ oscillations are regulated by the Ca2+ handling properties of mitochondria, independently from an action involving ATP (Graier et al. 2007). For example, it has been shown that Ca2+ uptake into mitochondria is involved in the regulation of frequency and duration of Ca2+ sparks (Pacher et al. 2002) and can influence the propagation of Ca2+ waves (Jouaville et al. 1995; Boitier et al. 1999; Tinel et al. 1999). There is also evidence that Ca2+ handling by mitochondria is a key regulator of pacemaker activity in ICC in the GI tract (Ward et al. 2000). The aim of the present study was to investigate if spontaneous Ca2+ waves in ICC isolated from the rabbit urethra are also regulated by the Ca2+ handling properties of mitochondria.
Methods
Cell isolation
All procedures were carried out in accordance with current EU legislation and with the approval of Dundalk Institute of Technology Animal Use and Care Committee. Male and female New Zealand white rabbits (16–20 weeks old) were humanely killed with a lethal injection of pentobarbitone (i.v.). The most proximal 1.5 cm of the urethra was removed and placed in Krebs solution and individual ICC were isolated enzymatically as previously described (Bradley et al. 2006).
Calcium imaging
Cells were placed in Hanks solution and allowed to settle in glass-bottomed Petri dishes until they had stuck down. They were then incubated in 0.4 μm fluo-4 AM (Molecular Probes) in Hanks solution containing 100 μm Ca2+ for 6–8 min in the dark at room temperature. Cells were imaged using an iXon 887 EMCCD camera (Andor Technology, Belfast; 512 pixels × 512 pixels, pixel size 16 μm × 16 μm) coupled to a Nipkow spinning disk confocal head (CSU22, Yokogawa, Japan). A krypton–argon laser (Melles Griot UK) at 488 nm was used to excite the fluo-4, and the emitted light was detected at wavelengths > 510 nm. Experiments were performed using a ×60 objective (Olympus) resulting in images of pixel size 0.266 μm × 0.266 μm. Images were acquired at five frames per second. Background fluorescence from the camera, obtained using a null frame, was subtracted from each frame to obtain ‘F’. F0 was determined as the minimum fluorescence measured between oscillations under control conditions. To obtain post hoc line-scan images for display in figures, a 1 pixel thick line was drawn centrally through the entire length of the cell and the ‘reslice’ command in Image J was invoked. A spatial calibration bar representing 40 μm is shown in yellow at the right hand side of each image. Plots of F/F0 were obtained from the post hoc line-scan by drawing a rectangle around the entire area of the line-scan image and plotting the intensity profile in Image J.
Summary data are presented as the mean ±s.e.m., and statistical differences in wave frequency and, where relevant, amplitude were compared using Student's paired t test, taking the P < 0.05 level as significant. ‘Basal Ca2+’ during oscillatory activity was defined as the diastolic Ca2+ levels (in F/F0 units) in the control period just prior to an experimental intervention. In the presence of a drug, basal Ca2+ was also measured as the Ca2+ level between oscillations; however, when oscillations were abolished, basal Ca2+ levels were determined as the mean Ca2+ level for the last 30 s during drug application. ΔF/F0 refers to the measurement of the change in Ca2+ levels from basal to peak. Changes in basal Ca2+ were compared using the Wilcoxin signed rank test for paired data. Throughout, ‘n’ refers to the number of cells in each experimental series. In each case, n was obtained from a minimum of two animals.
Whole-cell patch clamp recordings
Currents were recorded using the ruptured and perforated patch configurations of the whole-cell patch clamp technique (Rae et al. 1991). In the latter experiments the membrane was perforated using the antibiotic amphotericin B (600 μg ml−1). Pipettes were pulled from borosilicate glass capillary tubing (1.5 mm outer diameter, 1.17 mm inner diameter; Clark Medical Instruments) to a tip of diameter approximately 1–1.5 μm and resistance of 2–4 MΩ. Voltage clamp commands were delivered via an Axopatch 1D patch clamp amplifier (Axon Instruments) connected to a Digidata 1322A AD/DA converter (Axon Instruments) interfaced to a computer running pCLAMP software (Axon Instruments).
Solutions and drugs
The solutions used were of the following composition (mm): Hanks: 130 Na+, 5.8 K+, 135 Cl−, 4.16 HCO3−, 0.34 HPO32−, 0.44 H2PO4−, 1.8 Ca2+, 0.9 Mg2+, 0.4 SO42−, 10 dextrose, 2.9 sucrose, 10 Hepes, pH adjusted to 7.4 with NaOH; Ca2+-free Hanks: as Hanks but with Mg2+ (1.8 mm) substituted for Ca2+ and addition of EGTA (5 mm). Perforated patch solution: CsCl (133), MgCl2 (1.0), EGTA (0.5), Hepes (10), pH adjusted to 7.2 with CsOH. Whole-cell patch solution: CsCl (133), MgCl2 (1.0), Hepes (10), Na2ATP (1), NaGTP (0.1), Na2-phosphocreatine (2.5) pH adjusted to 7.2 with CsOH.
Drugs used were: CCCP (Sigma), FCCP (Ascent), rotenone (Sigma), oligomycin (Sigma) antimycin A (Sigma), kaempferol (Sigma), 2-APB (Acros), RU-360 (Calbiochem). During experiments, the dish containing the cells was superfused with Hanks solution. In addition, the cell under study was continuously superfused with Hanks solution by means of a close delivery system consisting of a pipette (tip diameter 200 μm) placed approximately 300 μm away. This could be switched, with a dead space time of around 5 s, to a solution containing a drug. All experiments were carried out at 35–37°C.
Results
Individual ICC isolated from the rabbit urethra displayed regularly occurring Ca2+ waves as previously described by Johnston et al. (2005) and Sergeant et al. (2006a,b). Examples of Ca2+ waves are presented in the ‘post hoc’ line-scans shown in Figs 1–9. The mean frequency and amplitude of these events measured under resting conditions in 32 cells were 6.2 ± 0.69 min−1 and ΔF/F0= 1.71 ± 0.13, respectively.
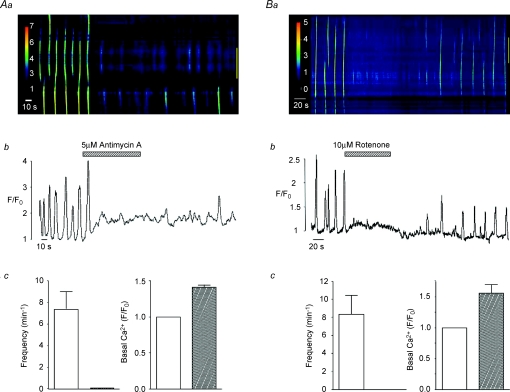
Figure 1. Effect of electron transport chain inhibitors on spontaneous Ca2+ waves in urethra ICC.
Aa shows a pseudo-line-scan image of spontaneous Ca2+ waves from an isolated ICC in the absence and presence of antimycin A (5 μm). Ab shows an intensity profile plot of this activity measured over the entire image. Summary graphs of the effects of antimycin A on mean frequency (min−1) of Ca2+ waves and on basal Ca2+ levels (F/F0) are shown in Ac. Ba–c show that rotenone produces similar effects to antimycin A.
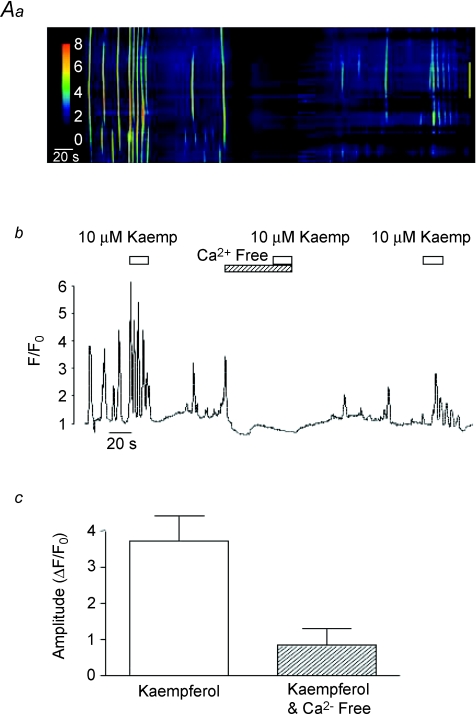
Figure 9. Effect of Ca2+-free media on kaempferol-induced Ca2+ waves.
A typical line-scan image showing the effect of kaempferol before and during exposure to Ca2+-free media is shown in A. An intensity profile plot of this record is plotted in B and a summary plot of the mean amplitude (ΔF/F0) of the initial kaempferol-induced Ca2+ transient in the absence and presence of Ca2+-free media is shown in C.
Effect of ETC inhibitors on spontaneous Ca2+ waves
Mitochondrial Ca2+ uptake is driven by the large negative potential (∼−180 mV) across the inner mitochondrial membrane created by the extrusion of protons along the electron transport chain (ETC; Mitchell, 1961). In order to investigate the relationship between Ca2+ waves and mitochondrial Ca2+ uptake, we examined the effects of the ETC (complex III) inhibitor antimycin A (5 μm) and the complex I inhibitor rotenone (10 μm). These agents have been shown to dissipate the negative mitochondrial membrane potential and thus reduce the ability of mitochondria to take up Ca2+ (Tinel et al. 1999). Figure 1Aa is a post hoc line-scan image showing the effect of antimycin A on spontaneous Ca2+ waves in an isolated ICC and Fig. 1Ab is an intensity profile plot of this experiment obtained by placing a region of interest around the entire line-scan. This cell exhibited spontaneous Ca2+ waves at a frequency of around 5 min−1. Application of 5 μm antimycin A reversibly inhibited Ca2+ waves and this effect was associated with a rise in basal Ca2+. This experiment was performed in a total of five cells where, in each case, the inhibition was complete, while basal Ca2+ significantly increased from F/F0= 1 to 1.4 ± 0.033 (P < 0.05, Fig. 1Ac). Similar effects were obtained using rotenone, as illustrated in Fig. 1B. In eight cells, application of rotenone (10 μm) completely inhibited Ca2+ waves and this was also accompanied by an increase in basal Ca2+ from F/F0= 1 to 1.56 ± 0.14 (P < 0.05, Fig. 1Bc).
Effect of protonophores on spontaneous Ca2+ waves
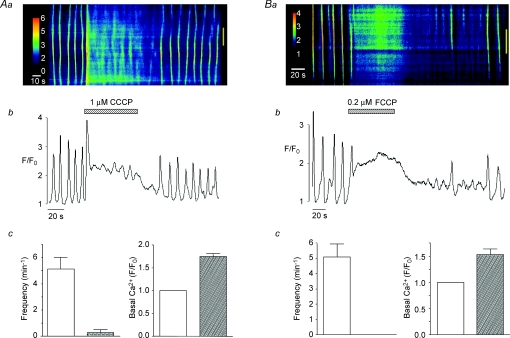
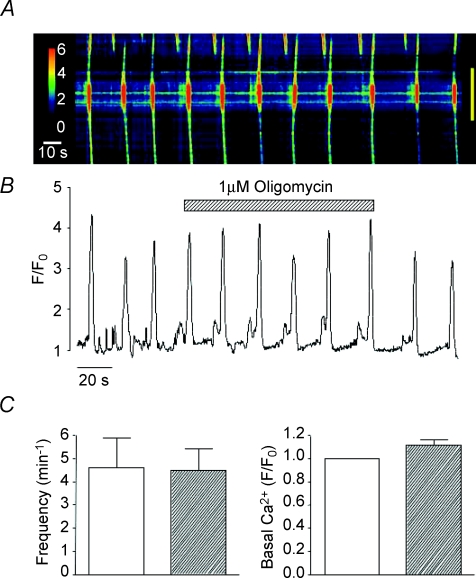
Reduction of mitochondrial Ca2+ uptake can also be induced by the protonophores FCCP and CCCP, which are also known to collapse the mitochondrial membrane potential (Farkas et al. 1989). In eight cells, CCCP (1 μm) raised basal Ca2+ to a mean of 1.75 ± 0.9 F/F0 (P < 0.05) and reduced the frequency of Ca2+ waves from 5.13 ± 0.9 to 0.25 ± 0.25 min−1 (P < 0.05, Fig. 2Ac). Similar results were achieved using FCCP (0.2 μm, Fig. 2B), thus Ca2+ waves were abolished in each cell tested (n= 6) and basal Ca2+ was increased from F/F0= 1 to 1.53 ± 0.11 (P < 0.05, Fig. 2Bc). These findings support the idea that the Ca2+ waves depend on the ability of mitochondria to take up Ca2+. It is unlikely that the effects of the ETC inhibitors and the protonophores were due to depletion of ATP as oligomycin, an ATP synthase inhibitor, failed to inhibit spontaneous Ca2+ waves (Fig. 3A and B). In five cells, the mean frequency and amplitude of Ca2+ waves under control conditions was 4.6 ± 1.3 min−1 and 1.93 ± 0.28 ΔF/F0, respectively, compared to 4.5 ± 0.92 min−1 and 1.65 ± 0.18 ΔF/F0 in the presence of oligomycin (1 μm, P > 0.05, Fig. 3C).
Figure 2. Effect of protonophores on spontaneous Ca2+ waves in urethra ICC.
A line-scan image showing the effect of CCCP (1 μm) on spontaneous Ca2+ waves is shown in Aa. Ab shows an intensity profile plot of this record. Summary bar charts plotting the mean frequency (min−1) of Ca2+ waves and basal Ca2+ levels (F/F0) in the absence and presence of CCCP are shown in Ac. Ba–c shows that FCCP produces similar effects to CCCP.
Figure 3. Effect of oligomycin on spontaneous Ca2+ waves in urethra ICC.
A representative pseudo-line-scan image and corresponding intensity profile plot demonstrating that oligomycin did not inhibit spontaneous Ca2+ waves is shown in A and B. Summary data, plotting the effects of oligomycin on the mean frequency of Ca2+ waves and basal Ca2+ levels, are shown in C.
Effect of mitochondrial inhibitors on caffeine-evoked Ca2+ transients
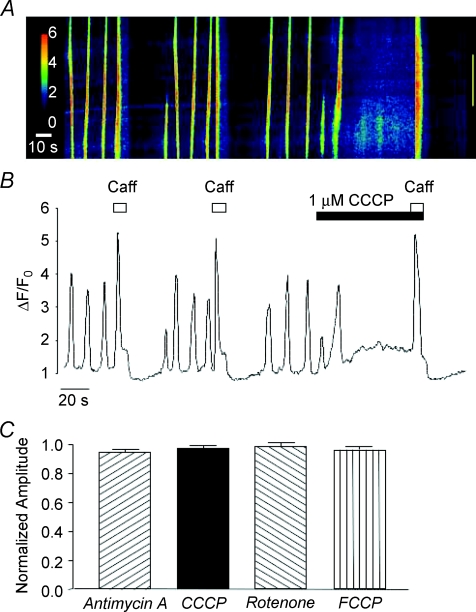
It could be argued that the inhibition of Ca2+ waves produced by the mitochondrial uncouplers and inhibitors was due to depletion of the intracellular Ca2+ stores, therefore experiments were performed to test if caffeine-evoked Ca2+ transients were affected by application of these drugs. Figure 4A and B shows the effect of CCCP on caffeine-evoked Ca2+ transients. When caffeine (10 mm) was applied under control conditions a maximal Ca2+ transient was induced, followed by a period of inhibition of the spontaneous oscillations. This effect was reproducible when caffeine was re-applied after a 70 s interval. The cell was then exposed to CCCP (1 μm) which inhibited the spontaneous activity, as explained above. When caffeine was re-applied during this inhibitory period, a Ca2+ transient of similar amplitude to the control was evoked, suggesting that the stores had not been depleted by CCCP. Similar results were observed using FCCP, rotenone and antimycin A. These data are summarized in Fig. 4C. It is clear that amplitude of the caffeine-evoked Ca2+ transients were not affected by the mitochondrial inhibitors (P > 0.05).
Figure 4. Effect of mitochondrial inhibitors on caffeine-evoked Ca2+ transients.
A and B are a representative pseudo-line-scan image and intensity profile plot showing that caffeine-induced Ca2+ transients are not inhibited by application of CCCP. The bar chart shown in C plots the mean peak amplitude of the caffeine-evoked Ca2+ transient in the presence of antimycin A, CCCP, rotenone and FCCP as a function of that evoked under control conditions before addition of each drug.
Effect of mitochondrial inhibitors on spontaneous transient inward currents
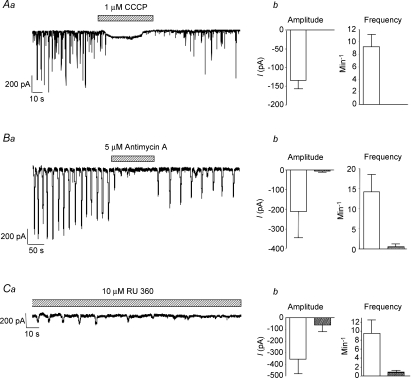
Previous studies have shown that under voltage clamp conditions, spontaneous Ca2+ waves in urethral ICC are associated with the occurrence of STICs (Johnston et al. 2005). Therefore, in order to verify that STICs were regulated by mitochondrial Ca2+ handling we examined the effect of CCCP, antimycin A and the mitochondrial uniporter inhibitor RU360 on isolated urethral ICC voltage clamped at −60 mV. Figure 5A shows the effect of CCCP (1 μm) on STICs recorded using the perforated patch configuration of the whole-cell patch clamp technique. In each cell tested, STICs were abolished by application of CCCP (P < 0.05). A representative recording of this effect is shown in Fig. 5Aa. Summary data plotting the mean frequency and amplitude of STICs measured from seven cells in the absence and presence of the drug are shown in Fig. 5Ab. Figure 5B shows that similar results were achieved using antimycin A (5 μm). These recordings were made using the ruptured patch configuration of the whole-cell patch clamp technique. In 4 out of 5 cells, antimycin A abolished STICs, resulting in a mean amplitude and frequency of −212 ± 131 pA and 14 ± 4 min−1 under control conditions versus−6.6 ± 6.6 pA and 0.6 ± 0.6 min−1 in the presence of the drug (P < 0.05, n= 5).
Figure 5. Effect of mitochondrial inhibitors on STICs.
Aa shows the effect of CCCP (1 μm) on STICs in a cell held at −60 mV. Ab, summary of the effect of CCCP on STICs from 7 cells. Ba shows the effect of antimycin A (5 μm) on STICs in a cell held at −60 mV. Bb, summary of the effect of antimycin A on STICs from 5 cells. Ca shows the effect of dialysis of RU360 (10 μm) on STICs in a cell held at −60 mV. The summary data shown in Cb plot the mean amplitude and frequency of STICs recorded from 7 cells dialysed with RU360 (filled bars) and 9 cells without the drug (open bars).
We next examined if STICs were inhibited by application of the mitochondrial uniporter inhibitor RU360 (10 μm). The mitochondrial uniporter is a Ca2+-selective channel that spans the inner mitochondrial membrane and is responsible for Ca2+ uptake into the mitochondria (Kirichok et al. 2004). These recordings were made under ruptured patch conditions as noted above and RU360 was dialysed into the cell via the pipette solution. RU360 inhibited STICs within 3 min following rupture of the membrane. In 4 out of 7 cells RU360 completely abolished the activity within this time period. This resulted in an overall mean frequency and amplitude of STICs (measured between 2 and 3 min from the beginning of the recording) of 0.86 ± 0.46 min−1 and −65.3 ± 54 pA, respectively. This compared with values of 9.6 ± 3.03 min−1 and −358 ± 124 pA in cells recorded under similar conditions without RU360, in the same time period (n= 9, P < 0.05 unpaired t test). These data are plotted in the summary bar charts in Fig. 5Cb and a representative example is shown in Fig. 5Ca.
Effect of activation of the mitochondrial uniporter on spontaneous Ca2+ waves
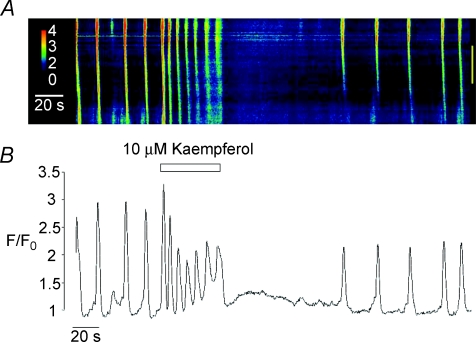
In order to investigate the effect of activation of the mitochondrial uniporter in more detail, we examined the effect of the uniporter opener kaempferol on spontaneous Ca2+ waves. Montero et al. 2004 reported that kaempferol, a naturally occurring plant flavonoid, was a potent activator of the uniporter and could dramatically increase mitochondrial Ca2+ uptake in HeLa cells. Vay et al. (2007) went on to show that stimulation of the uniporter with kaempferol (10 μm) in HeLa cells and in human fibroblasts induced a burst of repetitive Ca2+ oscillations of diminishing amplitude which then ceased. Figure 6 shows that application of 10 μm kaempferol to a spontaneously active ICC induced a burst of Ca2+ oscillations, comprised of an initial Ca2+ transient followed by a series of Ca2+ oscillations with a progressively smaller amplitude. This activity ceased on washout before returning to control levels. In 20 cells, the mean amplitude of the initial Ca2+ transient induced by kaempferol was 2.8 ± 0.32 ΔF/F0. The overall frequency of the kaempferol-induced Ca2+ oscillations (measured by dividing the total amount of oscillations during exposure to kaempferol by the duration of the exposure time) was 9.95 ± 0.96 min−1. The propagation velocity of Ca2+ waves was also significantly enhanced by kaempferol (31.4 ± 2.5 μm s−1 under control conditions compared to 55.9 ± 4 μm s−1 in the presence of the drug). These values were obtained by analysis of 41 Ca2+ waves before and 37 during addition of kaempferol in the same 15 cells. Basal Ca2+ levels did not change significantly during the presence of kaempferol (F/F0= 1 under control conditions and 0.97 ± 0.04 during its presence).
Figure 6. Effect of the mitochondrial uniporter opener kaempferol on Ca2+ waves.
A is a linescan image showing the effect of kaempferol (10 μm) on spontaneous Ca2+ waves in isolated urethra ICC. An intensity profile plot of this record is shown in B.
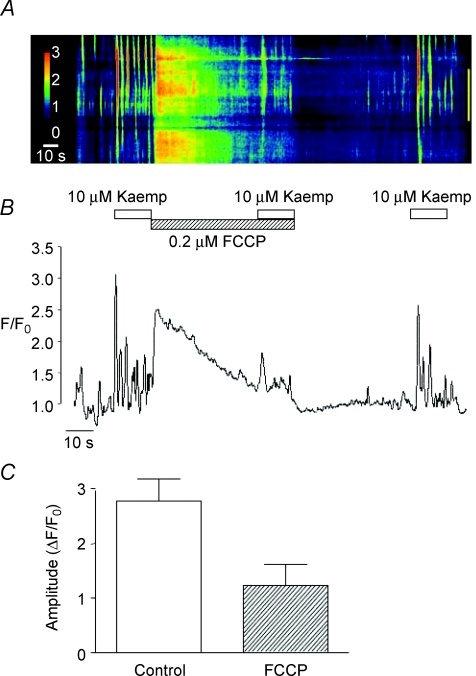
In order to verify that these effects were dependent on the Ca2+ handling properties of mitochondria, we tested if they were affected by pre-treatment with FCCP. Figure 7A and B shows that kaempferol-induced Ca2+ oscillations were greatly attenuated in the presence of FCCP (0.2 μm). Figure 7A also shows that addition of FCCP following the initial application of kaempferol caused a sharp rise in Ca2+. This effect was variable from cell to cell; however, in each instance it was associated with a marked reduction in the amplitude of the kaempferol response. The summary bar chart illustrated in Fig. 7C shows that in six cells the mean amplitude of the initial Ca2+ transient evoked by kaempferol significantly decreased from 2.8 ± 0.4 ΔF/F0 under control conditions to 1.2 ± 0.4 ΔF/F0 in the presence of FCCP (P < 0.05).
Figure 7. Effect of FCCP on kaempferol-induced Ca2+ waves.
A representative line-scan image showing the effect of kaempferol (10 μm) in the absence and presence of FCCP (0.2 μm) is shown in A. An intensity profile plot of this record is shown in B. A summary bar chart plotting the mean amplitude (ΔF/F0) of the initial kaempferol-induced Ca2+ transient in the absence and presence of FCCP is shown in C.
Role of Ca2+ stores in kaempferol-induced Ca2+ oscillations
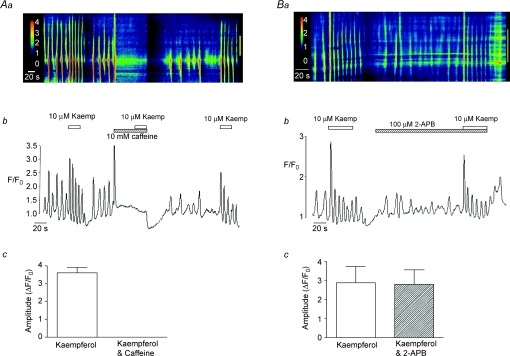
In order to investigate if kaempferol-induced Ca2+ oscillations depended on Ca2+ release from intracellular stores, we examined the effect of kaempferol before and during exposure of cells to caffeine (10 mm), used to deplete intracellular Ca2+ stores. A representative example of such an experiment is shown in Fig. 8Aa and b. In the absence of drugs, application of kaempferol induced a burst of Ca2+ oscillations, as described above. Cells were then treated with 10 mm caffeine. This evoked a large Ca2+ transient and abolished spontaneous activity (as previously described by Johnston et al. 2005). Kaempferol was then re-applied in the continued presence of caffeine, but did not induce any change in Ca2+ levels. The inhibitory effect of caffeine was reversible as kaempferol was able to induce a series of Ca2+ oscillations upon its removal. This effect was observed in five cells, where in each case the kaempferol response was completely abolished (P < 0.05, Fig. 8Ac). These data indicate that kaempferol-induced Ca2+ oscillations are dependent upon Ca2+ release from stores.
Figure 8. Effect of caffeine and 2-APB on kaempferol-induced Ca2+ waves.
Aa is a line-scan image showing the effect of kaempferol before and during exposure to 10 mm caffeine. Ab represents the intensity profile plot of the data shown in Aa. A summary plot of the mean amplitude (ΔF/F0) of the initial kaempferol-induced Ca2+ transient in the absence and presence of caffeine is shown in Ac. Ba is a line-scan image showing the effect of kaempferol before and during exposure to 2-APB (100 μm). Bb represents the intensity profile plot of the data shown in Ba. A summary plot of the mean amplitude (ΔF/F0) of the initial kaempferol-induced Ca2+ transient in the absence and presence of 2-APB is shown in Bc.
The effects produced by kaempferol in the present study were notably similar to those reported by Vay et al. (2007). The authors of this study suggested that the kaempferol effects may result from Ca2+ release from IP3Rs due to changes in their local Ca2+ concentration as a consequence of increased Ca2+ uptake into mitochondria. To investigate if the kaempferol-induced Ca2+ oscillations in the present study were due to Ca2+ release from IP3Rs, we assessed the effects of the IP3R blocker 2-APB. Figure 8Ba and b show that although 2-APB disrupted the pattern of spontaneous Ca2+ oscillations in the absence of kaempferol (as reported previously by Johnston et al. 2005), it had only a minor effect on the kaempferol-induced activity. In the presence of 2-APB (100 μm), kaempferol was still able to induce a burst of repetitive Ca2+ oscillations, though the amplitude of the initial spike was slightly reduced. However, this effect was not significant and in three cells the mean amplitude of the kaempferol-induced Ca2+ transient was 4.5 ± 0.85 ΔF/F0 under control conditions and 3.9 ± 0.77 ΔF/F0 in the presence of 2-APB (P > 0.05, Fig. 8Bc).
Previous studies from our laboratory demonstrated that pacemaker activity in urethral ICC was abolished by removal of extracellular Ca2+ ([Ca2+]o) (Johnston et al. 2005; Sergeant et al. 2006b); therefore we next investigated if kaempferol was able to elicit any Ca2+ oscillations in the absence of [Ca2+]o. A typical example of such an experiment is shown in Fig. 9A and B. Under control conditions, the cell produced regularly occurring Ca2+ waves and kaempferol induced a burst of repetitive Ca2+ oscillations, as described above. However, when Ca2+ was removed from the bath, the spontaneous oscillations ceased and application of kaempferol was without effect. This effect was partially reversible upon washout. The summary bar chart shown in Fig. 9C shows that the mean amplitude of the kaempferol-induced oscillations was reduced from 3.58 ± 0.66 ΔF/F0 under control conditions to 0.83 ± 0.33 ΔF/F0 in the absence of [Ca2+]o (n= 5, P < 0.05). These data demonstrate that the stimulatory effects of kaempferol on Ca2+ waves require [Ca2+]o and suggest kaempferol did not cause a direct release of Ca2+ from stores.
Discussion
The results of the present study show that spontaneous Ca2+ waves and STICs in urethral ICC are inhibited by agents which decrease mitochondrial Ca2+ uptake, such as FCCP, CCCP, antimycin A, rotenone and RU360. Conversely, when mitochondrial Ca2+ uptake was enhanced using the mitochondrial uniporter activator kaempferol, the frequency of Ca2+ oscillations was increased. This effect was inhibited by FCCP, consistent with an action on mitochondria. Application of the ATP synthase inhibitor, oligomycin, did not inhibit Ca2+ oscillations, indicating that the effects observed in this study are directly related to the Ca2+ handling properties of mitochondria and were not due to an indirect effect on ATP levels. Taken together, these results suggest that the occurrence of spontaneous Ca2+ waves in urethral ICC is directly related to the ability of mitochondria to take up Ca2+.
Bursts of Ca2+ oscillations induced by application of kaempferol in this study were inhibited when intracellular stores were depleted by application of 10 mm caffeine, but were not significantly inhibited by 2-APB, suggesting that they were more likely to be dependent on RyRs than IP3Rs. However, spontaneous Ca2+ waves were significantly reduced by 2-APB, demonstrating that IP3Rs are involved in the generation of Ca2+ waves under resting conditions as previously reported by Johnston et al. (2005). The kaempferol-induced activity was also inhibited by removal of [Ca2+]o; therefore it seems unlikely that kaempferol released Ca2+ directly from stores, as under similar experimental conditions caffeine-evoked Ca2+ transients were unaffected by removal of [Ca2+]o (Johnston et al. 2005). The results of Johnston et al. (2005) also suggest that the effects produced by removal of [Ca2+]o in the current study were not attributable to rapid depletion of stores.
The results of the current study imply a functional association between the activity of RyRs and uptake of Ca2+ by mitochondria, and there are many examples of such interactions in the literature (Straub et al. 2000; Nassar & Simpson, 2000; Szalai et al. 2000; Shkryl & Shirokova, 2006; Kopach et al. 2008). It is now well established that the steady state activity of RyRs is governed by cytoplasmic Ca2+ concentration in a classical bell-shaped manner (Fabiato, 1985; Meissner et al. 1997). This represents an effective negative feedback mechanism, resulting in closure of RyRs at high Ca2+ concentrations (Sham et al. 1998; Laver & Lamb, 1998). However, as these studies were performed on lipid bilayers it is difficult to determine the precise concentration required to induce inhibition in situ. The results shown in the present study suggest that Ca2+ waves in urethral ICC could be regulated by opening and closure of RyRs brought about by buffering of cytosolic Ca2+ by mitochondria. Thus, inhibition of mitochondrial Ca2+ uptake may lead to elevations in cytosolic Ca2+ which are sufficient to inhibit the opening of RyRs and prevent the development of spontaneous Ca2+ waves. Consistent with this idea are the recent findings of Kopach et al. 2008 which demonstrate that CICR at RyRs is reduced when mitochondrial Ca2+ uptake is decreased by FCCP. On the other hand, enhanced uptake of Ca2+ into mitochondria would be expected to cause a reduction in cytosolic Ca2+ and remove Ca2+-induced inhibition of RyRs. Jouaville et al. (1995) demonstrated a similar mechanism involving mitochondrial regulation of IP3Rs in Xenopus oocytes, whereby uptake of Ca2+ into mitochondria synchronized Ca2+ release from IP3Rs resulting in an increase in the propagation velocity of Ca2+ waves.
The activity of RyRs is also known to be affected by the Ca2+ concentration in the lumen of the sarcoplasmic reticulum (Burdakov et al. 2005). Indeed, studies by Hoth et al. (1997) and Malli et al. 2003, 2005 demonstrated that mitochondria could affect intraluminal Ca2+ levels in the endoplasmic reticulum (ER) by regulating the refilling pathway. Therefore, if mitochondrial Ca2+ uptake enhanced the refilling of Ca2+ stores in urethral ICC, as noted in the studies above, then we might expect that its inhibition would decrease refilling of stores and lead to a reduction in store Ca2+ levels. However, it seems unlikely that this is the case, as although FCCP, CCCP, rotenone and antimycin A all inhibited spontaneous Ca2+ waves, they did not affect the amplitude of caffeine-evoked Ca2+ transients, suggesting that the Ca2+ content of intracellular stores was unaffected by a reduction in uptake of Ca2+ into mitochondria.
Several studies have reported functional links between mitochondria and IP3Rs; therefore the finding that kaempferol-induced Ca2+ waves were not significantly affected by 2-APB was surprising in the current study. For example, Jouaville et al. (1995) showed that mitochondrial Ca2+ uptake increased the propagation speed of Ca2+ waves in Xenopus oocytes by preventing Ca2+-dependent inhibition of IP3Rs. Vay et al. (2007) also reported that mitochondrial regulation of IP3Rs led to an increase in the frequency of spontaneous Ca2+ waves in Hela cells and fibroblasts. Some studies have suggested that 2-APB is a poor blocker of IP3Rs, but is an effective blocker of capacitative Ca2+ entry (CCE; Bootman et al. 2002); therefore it is possible that the results of the present study could be due to the lack of efficacy of 2-APB as an IP3R inhibitor. However, several lines of evidence suggest that this is not the case in urethral ICC. For example, Sergeant et al. (2001) demonstrated that 2-APB (100 μm) blocked noradrenaline-induced Ca2+-activated Cl− currents, but not those evoked by caffeine. This study also showed that 2-APB failed to inhibit spontaneous transient outward currents (STOCs). These data suggest that 2-APB does block IP3Rs but does not affect release or uptake of Ca2+ from caffeine-sensitive stores, nor does it affect Ca2+-activated Cl− channels or Ca2+-activated K+ (BK) channels in urethral ICC.
Mitochondrial Ca2+ handling has also been shown to be involved in the regulation of pacemaker activity in ICC of the murine small intestine (Ward et al. 2000). However, in these cells it is thought that the pacemaker channels are directly modulated by mitochondrial Ca2+ uptake. The pacemaker current in intestinal ICC is mediated by activation of non-selective cation channels (NSCC; Koh et al. 1998). Activation of pacemaker channels in these cells is stimulated by reductions in cytoplasmic Ca2+ (Koh et al. 2002) and it is thought that uptake of Ca2+ into mitochondria is an essential prerequisite for activation of pacemaker currents. It seems unlikely that a similar process could regulate STICs in urethral ICC, as in these cells STICs arise from activation of Ca2+-activated Cl− (ClCa) channels (Sergeant et al. 2000). Unlike the pacemaker NSCC channels in the gut, ClCa channels open in response to elevations of cytoplasmic Ca2+, therefore mitochondrial Ca2+ uptake would be unlikely to stimulate these channels directly. In summary, we suggest that uptake of Ca2+ into mitochondria influences spontaneous Ca2+ waves, which underlie the pacemaker activity in urethral ICC, via a process which may involve regulation of RyRs.
Acknowledgments
This study was supported by grant number RO1 DK68565 from NIH, and G.P.S. is in receipt of a Research Fellowship awarded by the Health Research Board, Ireland (PD/2005/4).
References
- Boitier E, Rea R, Duchen MR. Mitochondria exert a negative feedback on the propagation of intracellular Ca2+ waves in rat cortical astrocytes. J Cell Biol. 1999;145:795–808. doi: 10.1083/jcb.145.4.795. [DOI] [PMC free article] [PubMed] [Google Scholar]
- Bootman MD, Collins TJ, Mackenzie L, Roderick HL, Berridge MJ, Peppiatt CM. 2-Aminoethoxydiphenyl borate (2-APB) is a reliable blocker of store-operated Ca2+ entry but an inconsistent inhibitor of InsP3-induced Ca2+ release (Review) FASEB J. 2002;16:1145–1150. doi: 10.1096/fj.02-0037rev. [DOI] [PubMed] [Google Scholar]
- Bradley E, Hollywood MA, Johnston L, Large RJ, Matsuda T, Baba A, McHale NG, Thornbury KD, Sergeant GP. Contribution of reverse Na+–Ca2+ exchange to spontaneous activity in interstitial cells of Cajal in the rabbit urethra. J Physiol. 2006;574:651–661. doi: 10.1113/jphysiol.2006.110932. [DOI] [PMC free article] [PubMed] [Google Scholar]
- Bradley E, Hollywood MA, McHale NG, Thornbury KD, Sergeant GP. Pacemaker activity in urethral interstitial cells is not dependent on capacitative calcium entry. Am J Physiol Cell Physiol. 2005;289:C625–C632. doi: 10.1152/ajpcell.00090.2005. [DOI] [PubMed] [Google Scholar]
- Burdakov D, Petersen OH, Verkhratsky A. Intraluminal calcium as a primary regulator of endoplasmic reticulum function. Cell Calcium. 2005;38:303–310. doi: 10.1016/j.ceca.2005.06.010. [DOI] [PubMed] [Google Scholar]
- Fabiato A. Time and calcium dependence of activation and inactivation of calcium-induced release of calcium from the sarcoplasmic reticulum of a skinned canine cardiac Purkinje cell. J Gen Physiol. 1985;85:247–289. doi: 10.1085/jgp.85.2.247. [DOI] [PMC free article] [PubMed] [Google Scholar]
- Farkas DL, Wei MD, Febbroriello P, Carson JH, Loew LM. Simultaneous imaging of cell and mitochondrial membrane potentials. Biophys J. 1989;56:1053–1069. doi: 10.1016/S0006-3495(89)82754-7. December. [DOI] [PMC free article] [PubMed] [Google Scholar]
- Graier WF, Frieden M, Malli R. Mitochondria and Ca2+ signaling: old guests, new functions. Pflugers Arch. 2007;455:375–396. doi: 10.1007/s00424-007-0296-1. [DOI] [PMC free article] [PubMed] [Google Scholar]
- Hirst GD, Ward SM. Interstitial cells: involvement in rhythmicity and neural control of gut smooth muscle (Review) J Physiol. 2003;550:337–346. doi: 10.1113/jphysiol.2003.043299. [DOI] [PMC free article] [PubMed] [Google Scholar]
- Hoth M, Fanger CM, Lewis RS. Mitochondrial regulation of store-operated calcium signaling in T lymphocytes. J Cell Biol. 1997;137:633–648. doi: 10.1083/jcb.137.3.633. [DOI] [PMC free article] [PubMed] [Google Scholar]
- Johnston L, Sergeant GP, Hollywood MA, Thornbury KD, McHale NG. Calcium oscillations in interstitial cells of the rabbit urethra. J Physiol. 2005;565:449–461. doi: 10.1113/jphysiol.2004.078097. [DOI] [PMC free article] [PubMed] [Google Scholar]
- Jouaville LS, Ichas F, Holmuhamedov EL, Camacho P, Lechleiter JD. Synchronization of calcium waves by mitochondrial substrates in Xenopus laevis oocytes. Nature. 1995;377:438–441. doi: 10.1038/377438a0. [DOI] [PubMed] [Google Scholar]
- Kirichok Y, Krapivinsky G, Clapham D. The mitochondrial calcium uniporter is a highly selective ion channel. Nature. 2004;427:360–364. doi: 10.1038/nature02246. [DOI] [PubMed] [Google Scholar]
- Klemm MF, Exintaris B, Lang RJ. Identification of the cells underlying pacemaker activity in the guinea-pig upper urinary tract. J Physiol. 1999;519:867–884. doi: 10.1111/j.1469-7793.1999.0867n.x. [DOI] [PMC free article] [PubMed] [Google Scholar]
- Koh SD, Jun JY, Kim TW, Sanders KM. A Ca2+-inhibited non-selective cation conductance contributes to pacemaker currents in mouse interstitial cell of Cajal. J Physiol. 2002;540:803–814. doi: 10.1113/jphysiol.2001.014639. [DOI] [PMC free article] [PubMed] [Google Scholar]
- Koh SD, Sanders KM, Ward SM. Spontaneous electrical rhythmicity in cultured interstitial cells of cajal from the murine small intestine. J Physiol. 1998;513:203–213. doi: 10.1111/j.1469-7793.1998.203by.x. [DOI] [PMC free article] [PubMed] [Google Scholar]
- Kopach O, Kruglikov I, Pivneva T, Voitenko N, Fedirko N. Functional coupling between ryanodine receptors, mitochondria and Ca2+ ATPases in rat submandibular acinar cells. Cell Calcium. 2008;43:469–481. doi: 10.1016/j.ceca.2007.08.001. [DOI] [PubMed] [Google Scholar]
- Laver DR, Lamb GD. Inactivation of Ca2+ release channels (ryanodine receptors RyR1 and RyR2) with rapid steps in [Ca2+] and voltage. J Biophys. 1998;74:2352–2364. doi: 10.1016/S0006-3495(98)77944-5. [DOI] [PMC free article] [PubMed] [Google Scholar]
- McCloskey KD, Gurney AM. Kit positive cells in the guinea pig bladder. J Urol. 2002;168:832–836. [PubMed] [Google Scholar]
- Malli R, Frieden M, Osibow K, Graier WF. Mitochondria efficiently buffer subplasmalemmal Ca2+ elevation during agonist stimulation. J Biol Chem. 2003;278:10807–10815. doi: 10.1074/jbc.M212971200. [DOI] [PubMed] [Google Scholar]
- Malli R, Frieden M, Trenker M, Graier WF. The role of mitochondria for Ca2+ refilling of the endoplasmic reticulum. J Biol Chem. 2005;280:12114–12122. doi: 10.1074/jbc.M409353200. [DOI] [PubMed] [Google Scholar]
- Meissner G, Rios E, Tripathy A, Pasek DA. Regulation of skeletal muscle Ca2+ release channel (ryanodine receptor) by Ca2+ and monovalent cations and anions. J Biol Chem. 1997;272:1628–1638. doi: 10.1074/jbc.272.3.1628. [DOI] [PubMed] [Google Scholar]
- Mitchell P. Coupling of phosphorylation to electron and hydrogen transfer by a chemi-osmotic type of mechanism. Nature. 1961;191:144–148. doi: 10.1038/191144a0. [DOI] [PubMed] [Google Scholar]
- Montero M, Lobatón CD, Hernández-Sanmiguel E, Santodomingo J, Vay L, Moreno A, Alvarez J. Direct activation of the mitochondrial calcium uniporter by natural plant flavonoids. Biochem J. 2004;384:19–24. doi: 10.1042/BJ20040990. [DOI] [PMC free article] [PubMed] [Google Scholar]
- Nassar A, Simpson AW. Elevation of mitochondrial calcium by ryanodine-sensitive calcium-induced calcium release. J Biol Chem. 2000;275:23661–23665. doi: 10.1074/jbc.M000457200. [DOI] [PubMed] [Google Scholar]
- Pacher P, Thomas AP, Hajnóczky G. Ca2+ marks: miniature calcium signals in single mitochondria driven by ryanodine receptors. Proc Natl Acad Sci U S A. 2002;99:2380–2385. doi: 10.1073/pnas.032423699. [DOI] [PMC free article] [PubMed] [Google Scholar]
- Rae J, Cooper K, Gates P, Watsky M. Low access resistance perforated patch recordings using amphotericin B. J Neurosci Methods. 1991;37:15–26. doi: 10.1016/0165-0270(91)90017-t. [DOI] [PubMed] [Google Scholar]
- Sanders KM. A case for interstitial cells of Cajal as pacemakers and mediators of neurotransmission in the gastrointestinal tract (Review) Gastroenterology. 1996;111:492–515. doi: 10.1053/gast.1996.v111.pm8690216. [DOI] [PubMed] [Google Scholar]
- Sanders KM, Koh SD, Ward SM. Interstitial cells of cajal as pacemakers in the gastrointestinal tract (Review) Annu Rev Physiol. 2006;68:307–343. doi: 10.1146/annurev.physiol.68.040504.094718. [DOI] [PubMed] [Google Scholar]
- Sergeant GP, Hollywood MA, McCloskey KD, McHale NG, Thornbury KD. Role of IP3 in modulation of spontaneous activity in pacemaker cells of rabbit urethra. Am J Physiol Cell Physiol. 2001;280:C1349–C1356. doi: 10.1152/ajpcell.2001.280.5.C1349. [DOI] [PubMed] [Google Scholar]
- Sergeant GP, Hollywood MA, McCloskey KD, Thornbury KD, McHale NG. Specialised pacemaking cells in the rabbit urethra. J Physiol. 2000;526:359–366. doi: 10.1111/j.1469-7793.2000.t01-2-00359.x. [DOI] [PMC free article] [PubMed] [Google Scholar]
- Sergeant GP, Johnston L, McHale NG, Thornbury KD, Hollywood MA. Activation of the cGMP/PKG pathway inhibits electrical activity in rabbit urethral interstitial cells of Cajal by reducing the spatial spread of Ca2+ waves. J Physiol. 2006a;574:167–181. doi: 10.1113/jphysiol.2006.108621. [DOI] [PMC free article] [PubMed] [Google Scholar]
- Sergeant GP, Thornbury KD, McHale NG, Hollywood MA. Interstitial cells of Cajal in the urethra (Review) J Cell Mol Med. 2006b;10:280–291. doi: 10.1111/j.1582-4934.2006.tb00399.x. [DOI] [PMC free article] [PubMed] [Google Scholar]
- Sergeant GP, Thornbury KD, McHale NG, Hollywood MA. Characterization of norepinephrine-evoked inward currents in interstitial cells isolated from the rabbit urethra. Am J Physiol Cell Physiol. 2002;283:C885–C894. doi: 10.1152/ajpcell.00085.2002. [DOI] [PubMed] [Google Scholar]
- Sham JS, Song LS, Chen Y, Deng LH, Stern MD, Lakatta EG, Cheng H. Termination of Ca2+ release by a local inactivation of ryanodine receptors in cardiac myocytes. Proc Natl Acad Sci U S A. 1998;95:15096–15101. doi: 10.1073/pnas.95.25.15096. [DOI] [PMC free article] [PubMed] [Google Scholar]
- Shkryl VM, Shirokova N. Transfer and tunneling of Ca2+ from sarcoplasmic reticulum to mitochondria in skeletal muscle. J Biol Chem. 2006;281:1547–1554. doi: 10.1074/jbc.M505024200. [DOI] [PubMed] [Google Scholar]
- Straub SV, Giovannucci DR, Yule DI. Calcium wave propagation in pancreatic acinar cells: functional interaction of inositol 1,4,5-trisphosphate receptors, ryanodine receptors, and mitochondria. J Gen Physiol. 2000;116:547–560. doi: 10.1085/jgp.116.4.547. [DOI] [PMC free article] [PubMed] [Google Scholar]
- Szalai G, Csordás G, Hantash BM, Thomas AP, Hajnóczky G. Calcium signal transmission between ryanodine receptors and mitochondria. J Biol Chem. 2000;275:15305–15313. doi: 10.1074/jbc.275.20.15305. [DOI] [PubMed] [Google Scholar]
- Tinel H, Cancela JM, Mogami H, Gerasimenko JV, Gerasimenko OV, Tepikin AV, Petersen OH. Active mitochondria surrounding the pancreatic acinar granule region prevent spreading of inositol trisphosphate-evoked local cytosolic Ca2+ signals. EMBO J. 1999;18:4999–5008. doi: 10.1093/emboj/18.18.4999. [DOI] [PMC free article] [PubMed] [Google Scholar]
- Vay L, Hernández-Sanmiguel E, Santo-Domingo J, Lobatón CD, Moreno A, Montero M, Alvarez J. Modulation of Ca2+ release and Ca2+ oscillations in HeLa cells and fibroblasts by mitochondrial Ca2+ uniporter stimulation. J Physiol. 2007;580:39–49. doi: 10.1113/jphysiol.2006.126391. [DOI] [PMC free article] [PubMed] [Google Scholar]
- Ward SM, Ordog T, Koh SD, Baker SA, Jun JY, Amberg G, Monaghan K, Sanders KM. Pacemaking in interstitial cells of Cajal depends upon calcium handling by endoplasmic reticulum and mitochondria. J Physiol. 2000;525:355–361. doi: 10.1111/j.1469-7793.2000.t01-1-00355.x. [DOI] [PMC free article] [PubMed] [Google Scholar]


