

Abstract
Variants in the Omi/HtrA2 gene have been nominated as a cause of Parkinson’s disease. This sequencing study of Omi/HtrA2 in 95 probands with apparent autosomal dominant inheritance of Parkinson’s disease did not identify any pathogenic mutations. In addition, there was no association between common variations in the Omi/HtrA2 gene and susceptibility to Parkinson’s disease in any of our four patient-control series (n=2373). Taken together our results do not support a role for Omi/HtrA2 variants in the pathogenesis of Parkinson’s disease.
Keywords: PARK13, PD, HtrA2, mitochondria, neurodegeneration
Introduction
Mutations in the Omi/HtrA2 gene were recently designated a novel autosomal dominant Parkinson’s disease (PD) locus (PARK13) [1]. A heterozygous (p.G399S; ss102660599) substitution resulting in a loss of protein function was identified in four sporadic PD patients indicating reduced penetrance. A second substitution (p.A141S; ss102660598) was associated with PD susceptibility [1].
Omi/HtrA2 knockout and mutant mice present a neurodegenerative phenotype with parkinsonian symptoms or with motor neuron degeneration respectively [2,3]. The HtrA2 protein is a serine protease which is targeted to the mitochondria, plays a role in apoptosis, and the mutants are reported to increase in vitro cell-death during stress conditions [1]. Evidence is also reported that the HtrA2 protein is found in Lewy bodies [1]. The confirmation for the role of Omi/HtrA2 variants in PD will further support the role of mitochondrial dysfunction in disease and provide a novel target for functional studies, and the development of translational therapeutics [4]. Herein we investigate the frequency of Omi/HtrA2 mutations in autosomal dominant parkinsonism and the associated risk of common variants with sporadic PD.
Patients and methods
DNA sequencing of familial PD probands
To estimate the frequency of Omi/HtrA2 mutations in autosomal dominant parkinsonism and identify novel variants, we have sequenced 95 affected probands with a family history of parkinsonism. The average age of onset was 54±11 years (range 30–77 years, 59 men/36 women). Families were referred from movement disorders clinics throughout Europe, North America, North Africa, and Asia (90% Caucasians and 10% Asians). For each kindred, DNA was available from at least two affected family members (74% of the families had 2–5 known affected members, 16% had 6–10, and 10% had more than 10 affected members). Parkinsonism in each pedigree was consistent with an autosomal dominant pattern of inheritance and known mutations in SNCA and LRRK2 were excluded. Each patient was assessed by neurologists specialized in movement disorders. The examination included a full medical history, including family history, and a standard neurological assessment. The Folstein Mini-Mental State Examination (MMSE) was used to assess cognitive function. A clinical diagnosis of PD required the presence of at least two of three cardinal signs (resting tremor, bradykinesia, and rigidity), improvement from adequate dopaminergic therapy, and the absence of atypical features or other causes of parkinsonism [5]. Appropriate institutional review and informed consent was obtained for clinicogenetic research.
Genomic DNA was extracted from peripheral blood lymphocytes using standard protocols. Primer pairs for all Omi/HtrA2 exons (NM_012347) were designed with Gene Runner version 3.05 software, and were used to amplify all 8 exons by polymerase chain reaction (PCR) (primer sequences available on request). PCR products were purified from unincorporated nucleotides using a Millipore PCR purification plate. A total volume of 6 μl, containing 20–50 ng of the clean product and 1.6 pM of one of the primers (forward or reverse), was used for sequencing. Electropherograms were analyzed with SeqScape v2.1.1 (ABI, Applied Biosystems, Foster City, CA, USA). If a putative pathogenic variant was observed segregation analysis was performed in the family by testing all available DNA from affected and unaffected family members.
Genetic Association study with PD
Four independent Caucasian PD patient-controls series from the US, Ireland, Norway and Poland were examined. The demographics for each series are displayed in Table 1. All patients were examined and observed longitudinally by a movement disorders neurologist with a PD diagnosis based on published criteria [5]. In the Irish and US series each patient was individually matched based on age (+/- 4 years), gender, and ethnicity to an unrelated control without evidence of neurological disease. The Norwegian and Polish controls are matched only for ethnicity. The ethical review boards at each institution involved approved the study, and all participants provided informed consent.
Table 1. PD patient-control series demographics.
The sample mean ± SD (minimum, maximum) is given for age and age at onset. Total sample sizes given for each series do not account for genotyping failure, which occurred in <5% of samples.
| Series | PD patients | Controls |
|---|---|---|
| US | n=224 | n=224 |
| Age | 73 ± 10 (38 – 90) | 73 ± 10 (38 – 90) |
| Age at onset | 62 ± 12 (26 – 82) | N/A |
| Familial PD (%) | 155 (37) | N/A |
| Gender (Male) | 115 (51%) | 115 (51%) |
| Ireland | n=174 | n=174 |
| Age | 61 ± 12 (33 – 90) | 61 ± 12 (33 – 90) |
| Age at onset | 49 ± 11 (18 – 77) | N/A |
| Familial PD (%) | 28 (16) | N/A |
| Gender (Male) | 68 (39%) | 68 (39%) |
| Norway | n=391 | n=958 |
| Age | 72 ± 11 (30 – 99) | 73 ± 11 (43 – 106) |
| Age at onset | 59 ± 11 (25 – 88) | N/A |
| Familial PD (%) | 120 (23) | N/A |
| Gender (Male) | 325 (60%) | 538 (47%) |
| Poland | n=101 | n=123 |
| Age | 75 ± 7 (56 – 86) | 70 ± 11 (34 – 89) |
| Age at onset | 64 ± 7 (38 – 76) | N/A |
| Familial PD (%) | 13 (13) | N/A |
| Gender (Male) | 40 (40%) | 48 (39%) |
From our sequencing analysis and reported SNP frequencies we selected four variants (rs10779958, rs1183739, rs2231250 and rs2241028) with a minor allele frequency >5% and the two previously reported mutations (A141S and G399S) to examine in our patient-control series [7]. Genotyping was performed on a Sequenom MassArray iPLEX platform (San Diego, CA); all primer sequences are available on request. Numerical variables were summarized with the sample mean, standard deviation (SD), and range. For the US and Irish matched series, associations between PD and Omi/HtrA2 SNPs were measured by odds ratio (OR) and corresponding 95% confidence interval (CI) obtained from single variable conditional logistic regression models. For the Norwegian and Polish series, associations with PD were measured by OR and 95% CI obtained from logistic regression models adjusted for age, sex, and series (combined series only). Haplotype analysis was performed using S-Plus score tests for association [6], with adjustments made for age and gender; P-values were obtained from the asymptotic distribution of the score statistic. In PD cases, linear regression models adjusted for sex were used to examine associations between age-at-onset and Omi/HtrA2 SNPs. Additive models were considered in all single marker analysis. Genotype and allele frequencies were in Hardy-Weinberg equilibrium for all SNPs and inter-marker linkage disequilibrium in study controls was measured by pairwise r-squared values (Figure 1). For each family of statistical tests, a Bonferroni adjustment for multiple testing was made in order to control the family-wise error rate at 5%; P-values ≤ 0.01 are considered statistically significant after this adjustment.
Figure 1. DNA variants identified through sequencing of Omi/HtrA2 gene and linkage disequilibrium (r2) between association markers.
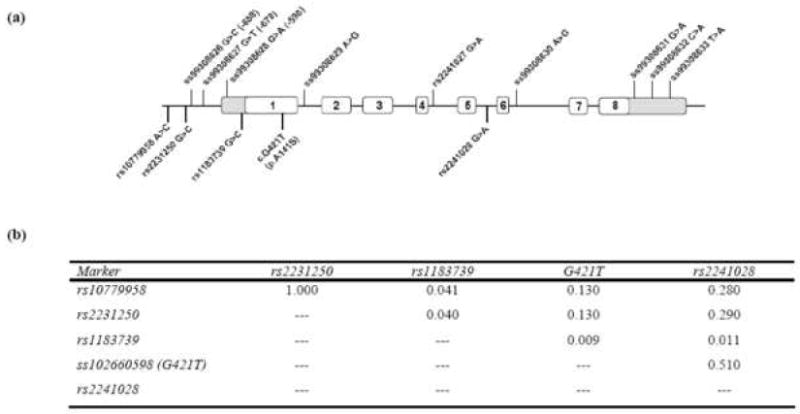
Ideogram of the Omi/HtrA2 gene highlighting the variants identified through sequencing of the 95 probands above the gene. Below the diagram are the five variants used to assess the association of common Omi/HtrA2 gene variation with PD risk. These variants were chosen based on minor allele frequency (>5%) and traverse the gene (5’ region to intron5) (b) A presentation of the linkage disequilibrium (r2) measure between the five common variants in our US control sample chosen to assess association with disease (all four control samples displayed similar r2 values between the SNPs examined).
Results
Sequencing of Omi/HtrA2 gene in 95 PD probands revealed a number of known SNPs and non-coding variants, however no putatively pathogenic substitutions were observed. A number of rare non-coding variants were observed including two intronic and four in the 5’ and 3’ UTRs of Omi/HtrA2 (Figure 1). These variants were not observed to segregate with disease in the families although one (5’UTR c.-598 G>A) has been demonstrated to influence gene expression in vitro and others are predicted in silico to functionally effect the Omi/HtrA2 locus (Figure 2).
Figure 2. Rare non-coding variants observed in sequencing of Omi/HtrA2.
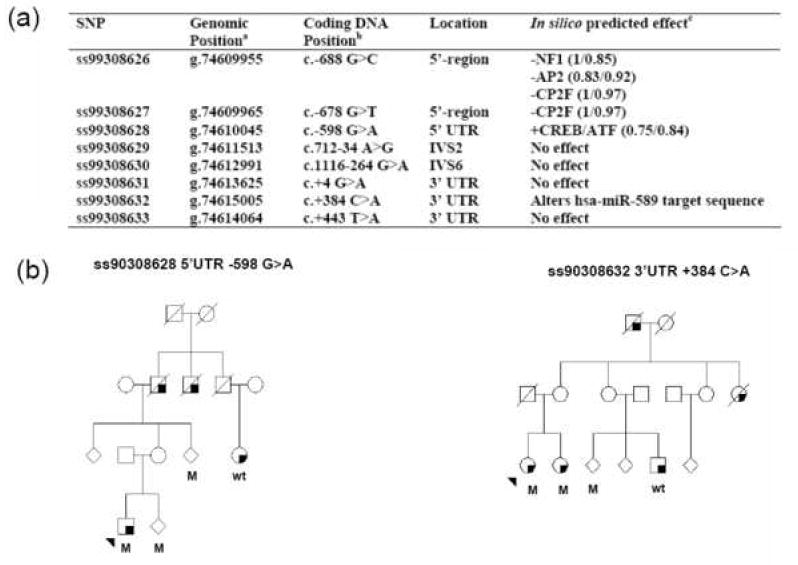
The rare variants observed through sequencing in 95 probands with apparent autosomal dominant inheritance of PD. (a)a The genomic positions of the of each SNP are generated from the UCSC Genome Browser dbSNP build based on the Human Mar. 2006 Human Genome Assembly. b Coding DNA position relative to reference sequence NM_013247 and beginning at the ATG codon (IVS=intronic variable sequence and UTR=untranslated region). c In silico prediction of transcription factor binding site was performed using MatInspector analysis (Core/Matrix similarity), splicing Alternative Splice Site Predictor (ASSP), and microRNA (miRNA) binding sites by complementarity to the miRNA sequences listed in miRBase. No segregation within our families were observed for these variants, (b) represents the two US pedigrees harboring the UTR variants predicted to alter the functionality of the Omi/HtrA2 locus. Squares represent males, circles represent females and to protect confidentiality some individuals gender is masked using a diamond. A diagonal line through the icon shows an individual is deceased. The proband is arrowed and a shaded lower right-hand quadrant represents an individual affected by PD. M= mutation carrier and wt= wild-type non-carrier of the mutant allele.
The sequencing of probands did not identify the previously reported pathogenic substitution p.G399S. However this putative pathogenic variant was observed in our patient-control series, this mutation was identified in twelve (<1%) control individuals (1 US, 2 Polish, and 9 Norwegian) and four (<1%) PD patients (3 US and 1 Norwegian). These findings refute the proposed role of ss102660599 (p.G399S) as a pathogenic mutation.
An association study was performed on four independent PD patient-control series examining the frequency of five SNPs in the Omi/HtrA2 gene (rs10779958, rs1183739, rs2231250, rs2241028 and ss102660598 (c.G421T; p.A141S)). There was a trend toward an association between PD susceptibility and rs1183739 in the Irish series (OR: 1.70, P=0.020), but this trend was not observed in any of the other series and was not statistically significant after adjusting for multiple testing. There was no evidence of any other associations between the five SNPs considered and susceptibility to PD (Table 2). There was no significant association with AAO or between haplotypes and disease (data not shown).
Table 2. Association results for variants in Omi/HtrA2 gene and PD.
For the matched US and Irish series, estimated odds ratios and P-values result from single variable conditional logistic regression models. For the Norwegian and Polish series, estimated odds ratios and P-values result from logistic regression models adjusted for age and gender. Estimated odds ratios correspond to an increase of one minor allele. P-values ≤ 0.01 are considered statistically significant after a Bonferroni adjustment for multiple testing.
| Series/ SNP | US | Ireland | Norway | Poland | ||||
|---|---|---|---|---|---|---|---|---|
| Patient n (%) | Control n (%) | Patient n (%) | Control n (%) | Patient n (%) | Control n (%) | Patient n (%) | Control n (%) | |
| rs10779958 | ||||||||
| AA | 162 | 150 | 137 | 126 | 283 | 672 | 78 | 96 |
| AC | 58 | 69 | 42 | 54 | 101 | 270 | 20 | 24 |
| CC | 6 | 4 | 5 | 5 | 6 | 16 | 3 | 2 |
| A | 364 | 353 | 316 | 306 | 667 | 1614 | 176 | 216 |
| C | 64 (15) | 75 (18) | 52 (14) | 64 (17) | 113 (14) | 302 (16) | 26 (13) | 28 (11) |
| OR (95% CI) | 0.84 (0.59, 1.19) | 0.80 (0.55, 1.17) | 0.93 (0.73, 1.19) | 1.29 (0.72, 2.32) | ||||
| P-value | 0.33 | 0.25 | 0.56 | 0.39 | ||||
|
| ||||||||
| rs2231250 | ||||||||
| GG | 159 | 150 | 137 | 125 | 284 | 671 | 78 | 96 |
| GC | 56 | 67 | 43 | 54 | 95 | 266 | 20 | 24 |
| CC | 6 | 4 | 5 | 5 | 6 | 17 | 3 | 2 |
| G | 356 | 351 | 317 | 304 | 663 | 1608 | 176 | 216 |
| C | 62 (15) | 73 (17) | 53 (14) | 64 (17) | 107 (14) | 300 (16) | 26 (13) | 28 (11) |
| OR (95% CI) | 0.82 (0.57, 1.17) | 0.82 (0.56, 1.19) | 0.88 (0.69, 1.13) | 1.29 (0.72, 2.32) | ||||
| P-value | 0.28 | 0.29 | 0.32 | 0.39 | ||||
|
| ||||||||
| rs1183739 | ||||||||
| GG | 124 | 153 | 109 | 132 | 266 | 625 | 70 | 75 |
| GC | 56 | 56 | 62 | 42 | 97 | 245 | 25 | 38 |
| CC | 5 | 6 | 6 | 5 | 9 | 24 | 1 | 3 |
| G | 287 | 346 | 280 | 306 | 629 | 1233 | 165 | 188 |
| C | 63 (18) | 66 (16) | 74 (21) | 52 (15) | 115 (15) | 293 (19) | 27 (14) | 44 (19) |
| OR (95% CI) | 1.14 (0.76, 1.71) | 1.70 (1.09, 2.65) | 0.95 (0.75, 1.20) | 0.68 (0.39, 1.20) | ||||
| P-value | 0.54 | 0.02 | 0.65 | 0.18 | ||||
|
| ||||||||
| ss102660598 (G421T) | ||||||||
| GG | 199 | 204 | 166 | 169 | 344 | 842 | 91 | 110 |
| GT | 25 | 19 | 18 | 15 | 28 | 102 | 8 | 11 |
| TT | 1 | 0 | 0 | 0 | 0 | 4 | 0 | 0 |
| G | 402 | 409 | 350 | 353 | 716 | 1786 | 190 | 231 |
| T | 24 (6) | 19 (4) | 18 (5) | 15 (4) | 28 (4) | 110 (6) | 8 (4) | 11 (5) |
| OR (95% CI) | 1.31 (0.69, 2.52) | 1.20 (0.61, 2.38) | 0.67 (0.43, 1.02) | 1.00 (0.37, 2.72) | ||||
| P-value | 0.41 | 0.6 | 0.06 | 0.99 | ||||
|
| ||||||||
| rs2241028 | ||||||||
| GG | 200 | 198 | 161 | 155 | 351 | 827 | 91 | 111 |
| GA | 23 | 23 | 25 | 30 | 36 | 120 | 10 | 12 |
| AA | 1 | 1 | 0 | 0 | 1 | 4 | 0 | 0 |
| G | 403 | 402 | 347 | 340 | 738 | 1774 | 192 | 234 |
| A | 21 (5) | 24 (6) | 25 (7) | 30 (8) | 38 (5) | 128 (7) | 10 (5) | 12 (5) |
| OR (95% CI) | 0.83 (0.46, 1.51) | 0.83 (0.48, 1.42) | 0.74 (0.50, 1.07) | 1.15 (0.46, 2.90) | ||||
| P-value | 0.55 | 0.49 | 0.11 | 0.76 | ||||
Discussion
Genetic forms of parkinsonism have had a major influence on the field, however the nomination of each new loci and pathogenic mutation must be greeted with caution. The first step for all putative pathogenic mutations or genetic associations must be independent confirmation. Mutation of Omi/HtrA2 was nominated as a novel cause of sporadic PD and a non-synonymous SNP was associated with increased risk of disease. The pathogenicity of Omi/HtrA2 was supported by the recent identification of a mutation (p.R404W) in one sporadic PD patient [7] and a functional link between the regulation of HtrA2 activity and Pink1, a known cause of recessive forms of PD [8].
The present study set out to investigate the frequency of Omi/HtrA2 mutations in autosomal dominant forms of PD and the association of common variants with sporadic PD. No pathogenic substitutions were observed within our familial probands. A number of rare non-coding variants were observed including SNP ss99308628 (c.-598 G>A) in the 5’UTR which has previously been predicted to alter stress-related transcription factor binding sites and shown to affect transcription in vitro [7].
We observed no significant associations in our PD patient-control series, including the nominated risk factor p.A141S. In addition the previously reported pathogenic mutation p.G399S was observed in both patients and control individuals at a similar frequency (<1%). These findings support the report of Simon-Sanchez and Singleton (2008) who performed a comprehensive sequencing study in 644 PD patients and 828 control samples from the Neurogenetics repository housed at the Coriell Institute for Research and did not identify any pathogenic variants [9]. Taken together these studies do not support a role for the Omi/HtrA2 gene in PD.
The designation of the PARK13 locus for Omi/HtrA2 variants warrants reconsideration. Over the coming years the number of putatively pathogenic genes and variants will increase. This is typified by the recent nomination of GIGYF2 variants accounting for the PARK11 locus [10] and also the high number of putatively pathogenic LRRK2 mutations [11]. Co-segregation in large kindreds or independent consistent replication of significant association with disease susceptibility remain the gold-standards for confirmation of disease loci.
Acknowledgments
We would like to thank all those who have contributed to our research, particularly all the neurologists who have collaborated and provided clinical expertise and samples for our genetic studies. Mayo Clinic Florida has submitted samples from this study to the Coriell Repository at NIH. OAR, and the presented studies are funded, by a Rapid Response Innovation Award from the Michael J. Fox Foundation, and in part, by a Morris K. Udall Parkinson’s Disease Research Center of Excellence (NINDS P50 #NS40256).
Footnotes
Publisher's Disclaimer: This is a PDF file of an unedited manuscript that has been accepted for publication. As a service to our customers we are providing this early version of the manuscript. The manuscript will undergo copyediting, typesetting, and review of the resulting proof before it is published in its final citable form. Please note that during the production process errors may be discovered which could affect the content, and all legal disclaimers that apply to the journal pertain.
References
- 1.Strauss KM, Martins LM, Plun-Favreau H, Marx FP, Kautzmann S, Berg D, et al. Loss of function mutations in the gene encoding Omi/HtrA2 in Parkinson’s disease. Hum Mol Genet. 2005;14:2099–2111. doi: 10.1093/hmg/ddi215. [DOI] [PubMed] [Google Scholar]
- 2.Jones JM, Datta P, Srinivasula SM, Ji W, Gupta S, Zhang Z, et al. Loss of Omi mitochondrial protease activity causes the neuromuscular disorder of mnd2 mutant mice. Nature. 2003;425:721–727. doi: 10.1038/nature02052. [DOI] [PubMed] [Google Scholar]
- 3.Martins LM, Morrison A, Klupsch K, Fedele V, Moisoi N, Teismann P, et al. Neuroprotective role of the Reaper-related serine protease HtrA2/Omi revealed by targeted deletion in mice. Mol Cell Biol. 2004;24:9848–9862. doi: 10.1128/MCB.24.22.9848-9862.2004. [DOI] [PMC free article] [PubMed] [Google Scholar]
- 4.Abou-Sleiman PM, Muqit MM, Wood NW. Expanding insights of mitochondrial dysfunction in Parkinson’s disease. Nat Rev Neurosci. 2006;7:207–219. doi: 10.1038/nrn1868. [DOI] [PubMed] [Google Scholar]
- 5.Gelb DJ, Oliver E, Gilman S. Diagnostic criteria for Parkinson disease. Arch Neurol. 1999;56:33–39. doi: 10.1001/archneur.56.1.33. [DOI] [PubMed] [Google Scholar]
- 6.Schaid DJ, Rowland CM, Tines DE, Jacobson RM, Poland GA. Score tests for association between traits and haplotypes when linkage phase is ambiguous. Am J Hum Genet. 2002;70:425–434. doi: 10.1086/338688. [DOI] [PMC free article] [PubMed] [Google Scholar]
- 7.Bogaerts V, Nuytemans K, Reumers J, Pals P, Engelborghs S, Pickut B, et al. Genetic variability in the mitochondrial serine protease HTRA2 contributes to risk for Parkinson disease. Hum Mutat. 2008;29:832–40. doi: 10.1002/humu.20713. [DOI] [PubMed] [Google Scholar]
- 8.Plun-Favreau H, Klupsch K, Moisoi N, Gandhi S, Kjaer S, Frith D, et al. The mitochondrial protease HtrA2 is regulated by Parkinson’s disease-associated kinase PINK1. Nat Cell Biol. 2007;9:1243–1252. doi: 10.1038/ncb1644. [DOI] [PubMed] [Google Scholar]
- 9.Simon-Sanchez J, Singleton AB. Sequencing analysis of OMI/HTRA2 shows previously reported pathogenic mutations in neurologically normal controls. Hum Mol Genet. 2008;17:1988–1993. doi: 10.1093/hmg/ddn096. [DOI] [PMC free article] [PubMed] [Google Scholar]
- 10.Lautier C, Goldwurm S, Durr A, Giovannone B, Tsiaras WG, Pezzoli G, et al. Smith Mutations in the GIGYF2 (TNRC15) gene at the PARK11 locus in familial Parkinson disease. Am J Hum Genet. 2008;82:822–833. doi: 10.1016/j.ajhg.2008.01.015. [DOI] [PMC free article] [PubMed] [Google Scholar]
- 11.Farrer M, Ross OA, Stone J. LRRK2-Related Parkinson Disease. GeneReviews at GeneTests: Medical Genetics Information Resource. 2006 database online. Copyright, University of Washington, Seattle, 1997-2006., Available at http://www.genetests.org.