

Abstract
Accurate estimates of the probability of HIV transmission during various stages of infection are needed to inform epidemiological models. Very limited information is available about the probability of transmission during acute HIV infection. We conducted a secondary analysis of published data from the Rakai, Uganda seroconversion study. Mathematical and computer-based models were used to quantify the per-act and per-partnership transmission probabilities during acute and chronic HIV infection, and to estimate how many of the transmission events reported in the Rakai study were due to acute-phase HIV transmission. The average per-act transmission probability during acute infection equaled 0.03604 vs. 0.00084 for chronic HIV infection. Overall, HIV was transmitted during acute infection in 46.5% of 23 “incident index partner couples.” Acute-phase transmission accounted for 89.1% of all transmission events in the first 20 months of follow-up. These results highlight the substantial risk of transmission during acute HIV infection.
Keywords: HIV, Acute infection, Transmission, Modeling
Introduction
HIV viral load is substantially elevated during the acute-phase of HIV infection, which is the brief period of intense viral replication that begins shortly after viral acquisition and lasts until the viral load set point is established (Busch and Satten 1997; Kahn and Walker 1998). Acutely infected persons may be much more likely to transmit HIV to sex partners than are persons in later stages of infection (Pilcher et al. 2004). Mathematical models of the explosive growth of HIV infection at the start of the U.S. epidemic suggest that HIV transmission during the acute-phase of infection could have played a significant role in fueling the initial epidemic among gay men in urban epicenters (Jacquez et al. 1994; Koopman et al. 1997).
A recent study by Wawer et al. (2005) of HIV transmission within heterosexual couples in the Rakai district of Uganda provides empirical evidence of the greatly heightened risk of HIV transmission in the period just following HIV acquisition. In 10 of 23 initially uninfected couples included in this study, both partners seroconverted within the same 10-month follow-up period. Taking into account the frequency of intercourse within the 23 couples during the study period, Wawer et al. calculated a “per-act transmission rate” of 0.0082 for this “early transmission” group by dividing the total number of transmission events by the total number of sex acts reported by the 23 couples. A much smaller transmission rate was obtained for couples that were serodiscordant at enrollment.
Transmission rates provide valuable information about the relative likelihood of HIV transmission, but should not be confused with transmission probabilities. Although transmission rates are reasonable approximations to transmission probabilities when the true transmission probability is small and consequently the likelihood of transmission is essentially a linear function of the number of sex acts, they are much less accurate when the transmission probability is relatively high, as it is during the acute-phase of HIV infection.
Accurate estimates of per-act and per-partnership transmission probabilities are needed to inform mathematical models of HIV transmission during acute infection, and more generally, for use in infection-stage dependent models. Relatively few such estimates have been published to date. Leynaert et al. (1998) calculated on average per-act transmission probability of 0.0008 for male-to-female transmission during a 3-month period of “primary” infection, based on data collected in the European Study of Heterosexual Transmission of HIV. Utilizing empirical data from a small cohort of recently infected men and mathematical modeling techniques, Pilcher et al. (2004) estimated the median per-partnership risk of male-to-female transmission during a 54-day period acute infection at between 0.016 and 0.062, with a peak per-act transmission probability of 0.0047. Rapatski et al. (2005) modeled male-to-male transmission in the early epidemic in San Francisco and derived an average per-act probability estimate of 0.024 for insertive anal intercourse during a 6-month period of primary infection. We are not aware of any acute (or primary) infection transmission probability estimates for sub-Saharan Africa.
The present study used mathematical and computer-based modeling techniques to generate transmission probability estimates suitable for use in HIV transmission modeling analyses based on the published Rakai data (Wawer et al. 2005), including an estimate of the average probability of HIV transmission during the acute-phase of infection. We then used this probability value to estimate the proportion of the HIV transmission events in the Rakai cohort that were due to acute-phase HIV transmission. To support our conclusions, we demonstrate that the average per-act transmission probability during acute infection (a period during which viral load and infectiousness vary greatly) can be utilized in transmission models without substantial loss of accuracy. The implications of our findings for the potential role of acute-phase transmission in the Ugandan and U.S. epidemics are discussed.
Overview of Rakai Seroconversion Study
The HIV transmission data reported by Wawer et al. (1998, 1999) were derived from a large STD control intervention study that enrolled 15,127 adults from the Rakai district of Uganda. Study participants were followed at 10-month intervals for up to 40 months between 1994 and 1999. A retrospective analysis following completion of the trial identified 23 couples in which both partners were sero-negative at baseline and at least one (the “index partner”) seroconverted during the follow-up period. In 10 of these 23 “incident index partner” couples, both partners seroconverted in the same 10-month period (“early transmission couples”); in 2 of the remaining 13, the non-index partner seroconverted in the 10-month period following the one in which the index partner seroconverted (“middle transmission couples”); and in 1 of the remaining 7 (some couples were lost to follow-up) the non-index partner seroconverted during the second or third period after the index partner seroconverted (“late transmission couples”). The Rakai study also included 161 “prevalent index partner” couples in which the index partner was already HIV-positive at baseline assessment.
At each 10-month follow-up assessment couples reported their average monthly frequency of intercourse, with no distinction between unprotected and condom-protected intercourse. Only 19.6% of study couples reported any condom use and no couple reported consistent condom use (Wawer et al. 2005). Moreover, the per-act transmission rates did not differ significantly between couples that used condoms and those that did not. Still, the per-act transmission rates reported by Wawer et al. and the transmission probabilities calculated here likely underestimate the corresponding values for unprotected intercourse.
Table 1 summarizes selected findings from the Rakai seroconversion study, including the per-act transmission rates for the “early,” “middle,” and “late” transmission groups (0.00819, 0.00152, and 0.00097, respectively). For each of these groups we calculated a corresponding per-act transmission probability, α, using the equation: α = 1 - (1 - NHIV/N)1/n, where N is the number of couples, NHIV is the number of transmission events during the 10-month follow-up period, and n is the average number of sex acts per couple during this period (see Table 1). The per-act transmission probabilities (0.01069 for “early transmission couples,” 0.00165 for “middle transmission couples,” and 0.00104 for “late transmission couples”) were 30.5, 8.6, and 7.2% larger than the corresponding transmission rates. For the “prevalent index partner” cohort, the weighted-average transmission rate equaled 0.00077 and the transmission probability equaled 0.00081 (data not shown).
Table 1.
Rakai “Incident Index Partner” cohort
| Early group | Middle group | Late group | |
|---|---|---|---|
| Number of couples | 23 | 13 | 7 |
| Total sex acts (10 months) | 2,442 | 1.313 | 1,035 |
| Sex acts per couple (10 months) | 106.2 | 101.0 | 147.9 |
| Sex acts per couple per day | 0.35 | 0.34 | 0.25 |
| Transmission events | 10 (43.5%) | 2 (15.4%) | 1 (14.3%) |
| Per-act transmission ratea,c | 0.00819 | 0.00152 | 0.00097 |
| Per-act transmission probabilityb,c | 0.01069 | 0.00165 | 0.00104 |
Per-act transmission rate = (transmission events) / (total sex acts). See footnote c
Per-act transmission probability = 1 - (1 - NHIV/N)1/n, where N is the number of couples, NHIV is the number of transmission events, and n is the average number of sex acts per couple. See footnote c
For the “early transmission” group, Wawer et al. (2005) assumed that the index partner seroconverted midway through the 10-month period between his or her last negative HIV antibody test and his or her first positive test. Consequently, both the per-act transmission rate and the corresponding per-act transmission probability were calculated using one-half of the total number of sex acts in the first 10-month follow-up period
Probability of Acute-phase HIV Transmission
The transmission probabilities calculated in the preceding section can be refined by carefully distinguishing between acute-phase HIV transmission and chronic-phase transmission. The potential impact of acute-phase transmission is evident not only in the “early transmission” group, but also in the “middle transmission” group, whose transmission probability (0.00165) is considerably higher than that of the “prevalent index partner” cohort (0.00081). The elevated probability for the “middle transmission” group is consistent with the possibility that some index partners acquired HIV late in the first follow-up period, and while acutely infected, transmitted the virus to their partners, who did not seroconvert until the next follow-up period (hence were counted as “middle transmission” couples); this is illustrated in Fig. 1.
Fig. 1.
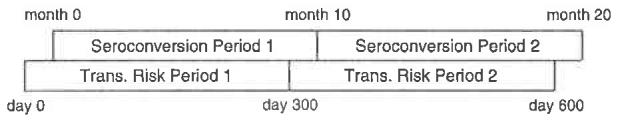
“Early” and “middle” transmission groups. Both partners were HIV-negative at month 0 and the index partner tested HIV-positive at month 10. In 10 of 23 couples, the non-index partner also tested positive at month 10 (“early transmission couples”) and in 2 of the remaining 13, the non-infected partner tested positive at month 20 (“middle transmission couples”). Each seroconversion period corresponds to a transmission risk period that began S days where S is the number of days between HIV acquisition and seroconversion. Notice that transmission events that occurred within the overlap of seroconversion period 1 and transmission risk period 2 would be recorded as seroconversion events in period 2. Some of these transmission events could be due to acuti-phase HIV transmission
We developed a computer-based model to calculate the expected number of infections (and the proportion of these infections that resulted from transmission, while the index partner was acutely infected) in each of the first two 10-month (300-day) follow-up periods, for any specified pairing of values for the chronic-stage transmission probability (αC) and the average acute-phase transmission probability (αA; the use of “average” acute-phase transmission probabilities is discussed below). We then fit the model to the Rakai data by determining the combination of values of αC and αA that minimized the error term:
,where I1 and I2 are the predicted numbers of transmission events in the first and second follow-up periods, 10 and 2 are the corresponding number of transmission events observed in the Rakai study, and Abs(•) denotes the absolute value function. This error term gives equal weight to deviations from the expected number of transmission events in the first and second follow-up periods, and twice this weight to deviations in the total number of transmission events.
The model assumed that the index partner acquired HIV on day H of the first 300-day transmission risk period (see Fig. l), with all values between H = 0 and 299 considered equally likely. Following a “latency” period of L days, during which the index partner was assumed non-infectious, he or she entered the acute-stage of infection, which lasted A days (day H + L + A marked the beginning of the chronic-phase of infection). For each value of H between 0 and 299 the model calculated the number of transmission events in the first and second follow-up periods (I1,(H) and I2(H), respectively) and then calculated the following averages, again assuming that each value of H was equally likely: I1 = ∑I1(H)/300 and I2 = ∑I2(H)/300. These average values were used to determine the overall error in the fit of the model to the Rakai data, as described above.
TO determine I1(H) and I2(H), the number of transmission events that occurred on any given day, from day H + L (the first day of infectiousness) to day 599 (the last day of the second transmission risk period), was calculated by multiplying together: (a) the number of couples in which the non-index partner was susceptible; (b) the daily sex act frequency, psex, for the corresponding 10-month (300-day) period (psex = 0.35 for the first period and 0.34 for the second; see Table 1); and (c) the appropriate per-act transmission probability (αA or αC, depending on whether the index partner was acutely or chronically infected). Thus, On day T, psex * N(T) couples engaged in intercourse, resulting in α * psex * N(T) transmission events (here, N(T) is the number of susceptible couples at the beginning of day T). Conceptually, the number of sex acts per couple in each period followed a binomial distribution with mean equal to D * psex and variance D * psex * (1 - psex), where D is the number of days of infectiousness (D = 300 - (H + L)) for the first period and D = 300 for the second period). Notably, the model did not assume that the number of sex acts was the same for all couples, only that the mean number of sex acts per couple matched the Rakai data.
In the base-case analysis, the duration of the non-infectious “latency” period was estimated at L = 9 days and the duration of the acute-phase of infection at A = 49 days; these values are consistent with published estimates (Busch and Satten 1997; Kahn and Walker 1998; Lindbäck et al. 2000; Pilcher et al. 2004). Additional values of L and A were examined in the sensitivity analyses.
For the base-case values of L and A, the best fit to the Rakai data was obtained when αC = 0.00084 and αA = 0.03604. With these per-act transmission probability values, 10 transmission events would be expected in the first follow-up period and 2 would be expected in the second follow-up period, matching the Rakai findings. Of the 12 transmission events in the “early” and “middle” groups, 10.7 (89.1%) were due to acute-phase transmission, including 96.5% of the 10 transmission events in the “early” group and 52.3% of the 2 transmission events in the “middle” group. Overall, HIV was transmitted during acute infection in 46.5% of the 23 “incident index partner” couples.
The duration of the non-infectious latency period (L) and the acute-phase of infection (A) were independently varied from L = 4 to 14 days and from A = 42 to 56 days in the sensitivity analyses (Busch and Satten 1997; Kahn and Walker 1998; Lindbäck et al. 2000; Pilcher et al. 2004). Table 2 summarizes the results of these analyses. For each combination of L and A values, the expected numbers of transmission events equaled 10 in the first follow-up period and 2 in the second period. Although the best-fitting per-act acute-phase transmission probability varied considerably, from αA = 0.03118 to 0.04260, both the per-partner transmission probability (equivalently, the proportion of “incident index partner” couples in which acute-phase transmission occurred) and the percentage of transmission events due to acute-phase transmission were quite stable. HIV was transmitted during acute infection in 44.4–48.7% of couples, and acute-phase transmission accounted for 85.2–93.2% of incident infections in the “early” and “middle” transmission groups. These results differed by less than 5% from the corresponding base-case results.
Table 2.
Sensitivity analyses: best-fitting per-act transmission probabilities as a function of the duration of the latency and acute-infection periods
| Acute period (days) |
Latent period (days) |
Chronic transmission probability |
Acute transmission probability |
Acute infectionsa | Overall acute trans. riskb |
Bernoullian probabilityc |
|---|---|---|---|---|---|---|
| 56 | 4 | 0.00090 | 0.03118 | 10.60 (88.4%) | 0.46107 | 0.03086 |
| 9 | 0.00073 | 0.03240 | 10.90 (90.8%) | 0.47374 | 0.03206 | |
| 14 | 0.00055 | 0.03366 | 11.19 (93.2%) | 0.48651 | 0.03329 | |
| 49 | 4 | 0.00100 | 0.03470 | 10.41 (86.8%) | 0.45266 | 0.03431 |
| 9d | 0.00084 | 0.03604 | 10.70 (89.1%) | 0.46505 | 0.03562 | |
| 14 | 0.00067 | 0.03744 | 10.99 (91.6%) | 0.47770 | 0.03698 | |
| 42 | 4 | 0.00109 | 0.03943 | 10.22 (85.2%) | 0.44448 | 0.03893 |
| 9 | 0.00094 | 0.04094 | 10.50 (87.5%) | 0.45665 | 0.04040 | |
| 14 | 0.00077 | 0.04260 | 10.80 (90.0%) | 0.46975 | 0.04201 |
Number and percentage of transmission events in first or second follow-up period that occurred while the index partner was acutely infected. (The total number of chronic- and acute-transmission events equaled 12, including 10 in the first follow-up period and 2 in the second.)
Per-partnership risk of HIV transmission during acute infection, βA. This value also indicates the proportion of “incident index partner” couples in which HIV was transmitted to the non-index partner while the index partner was acutely infected
Per-act transmission probability estimate assuming all couples engaged in the same number of sex acts (Bernoullian estimate): αA* = 1 - (1 - βA)1/n, where βA = per-partnership risk of transmission during acute HIV infection and n is the average number of sex acts during acute infection
Base-case results
Bernoullian HIV Transmission Models
As discussed previously, the computer-based model of the Rakai cohort implicitly assumed a binomial distribution for the number of sex acts per couple. The transmission probabilities derived from this model are appropriate for use in stochastic simulation models that likewise assume a binomial distribution for sex acts (e.g., Gray et al. 2007; Orroth et al. 2006; Robinson et al. 1999). Bernoullian and some other deterministic models, in contrast, typically assume that the number of sex acts is equal for all couples (Pinkerton et al. 1998). We derived acute-phase transmission probability estimates suitable for use in such models by translating each “binomially distributed sex acts” estimate, αA, into an equivalent “equal number of sex acts” estimate, αA*, using the equation: αA* = 1 - (1 - βA)1/n, where βA is the per-partnership probability of transmission during acute infection and n is the average number of sex acts during acute infection. In the Rakai cohort, each index partner engaged in an average of 17.25 sex acts while acutely infected (this estimate assumes a latency period of 9 days and a 49-day duration of acute infection) and the per-partnership transmission probability was βA = 0.46505. The above equation yields an “equal number of sex acts” per-act transmission probability of αA* = 0.03562 that corresponds to the base-case “binomially distributed sex acts” estimate, αA = 0.03604. Table 2 presents “equal number of sex acts” transmission probability estimates for various values of the latency and acute-phase duration parameters.
Variable Acute-phase HIV Transmission Probabilities
The preceding analyses utilized a constant, average per-act transmission probability during acute HIV infection. In actuality, the per-act transmission probability likely follows a time course similar to that exhibited by viral load levels in recently infected persons, with a brief period of rapid increase up to a peak level, followed by a somewhat slower descent to the set-point level (Lindbäck et al. 2000; Pilcher et al. 2004). A greatly simplified schematic illustration of this time course is presented in Fig. 2. In light of the substantial variability in the per-act transmission probability over the course of acute infection, one may question whether it is reasonable to use average per-act transmission probabilities, such as those calculated above, in models of acute-phase HIV transmission. We conducted a simulation study of the per-partnership risk of HIV transmission during acute infection to address this question.
Fig. 2.
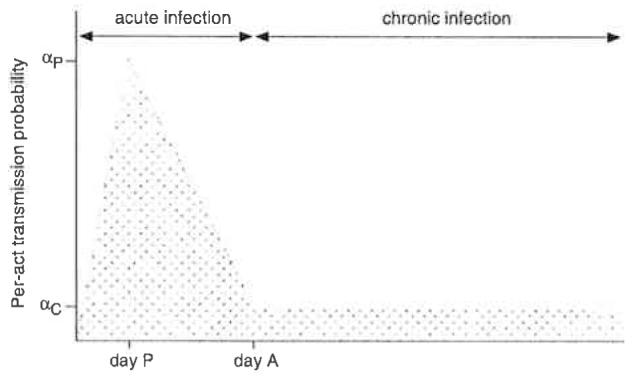
Schematic illustration of variability in the per-act transmission probability during the course of acute HIV infection, which begins on day 0 and ends just prior to day A, which marks the beginning of the chronic-phase of infection. The probability of HIV transmission peaks on day P. The peak per-act HIV transmission probability is denoted αP, whereas αC represents the chronic-phase transmission probability. For the simulation model described in the text. A = 49, P = 14, αC = 0.00084, and αP = 0.07148
Let α(d) denote the per-act transmission probability on day d of the acute-phase of infection. The overall risk of HIV transmission to a particular partner during acute HIV infection is γ = 1 - (1 - α(dl)) (1 - α(d2))...(l - α(dn)), where n is the total number of unprotected sex acts during the acute-phase of infection and α(dk) denotes the per-act transmission probability associated with the kth sex act, which occurs on day dk.
This per-partnership transmission risk value can be approximated by γA = 1 - (1 - αA)n, where αA = (α(d1) + α(d2)+ ... + α(dn))/n is the corresponding average per-act transmission probability. It can be shown analytically that the average per-act transmission probability-based approximation underestimates the true per-partnership transmission risk (i.e., γA ≤ γ; see appendix). However, the error in this approximation, which equals (γ - γA) / γ, generally is quite small.
To illustrate this, we conducted a computer simulation that used the per-act transmission probability function shown in Fig. 2 to estimate the per-partnership risk of HIV transmission for n = 17 sex acts spaced randomly throughout a 49-day period of acute infection. The per-act transmission model (Fig. 2) was parameterized such that the average per-act transmission probability equaled 0.03604. On each simulation run, the average per-act transmission probability, αavg = (α(d1) + α(d2) + ... + α(d17))/n, and the per-partnership risk, γ = 1 - (1 - α(d 1)) (1 - α(d2))...(1 - α(d17)), were calculated. The simulation was run until the mean of the per-act transmission probabilities across runs was within 0.000001 of the target value, 0.03604 (this required 461 runs). The mean value of γ over the 461 simulation runs was 0.4643, whereas the average transmission probability-based estimate, γA = 1 - (1 - 0.03604)17, equaled 0.4642. The relative error in approximating γ by γA was less than 0.02%. Thus, although the per-act transmission probability varies greatly during acute infection, the overall risk of transmission can be estimated by γA = 1 - (1 - αA)n with acceptable accuracy.
Discussion
Accurate transmission probability estimates are critical for ensuring the validity of HIV transmission modeling studies that utilize these estimates. The present analyses demonstrate that the per-act transmission rates reported by Wawer et al. (2005) underestimate the corresponding transmission probabilities during early infection by as much as 30%. At least two recent modeling studies have mistakenly utilized Wawer et al.’s transmission rate estimates in place of true transmission probabilities (Gray et al. 2007; Pearson et al. 2007).
Distinguishing between acute and chronic HIV infection allowed us to precisely calculate the average per-act transmission probability during acute infection, which was approximately 43 times larger than the transmission probability during chronic infection (0.03604 vs. 0.00084, respectively). Based on this estimate of the acute-phase transmission probability, we determined that acute-phase HIV transmission accounted for 89.1% of the 12 incident infections observed in Rakai’s “early” and “middle transmission” groups, and that HIV was transmitted during acute infection in 46.5% of Rakai’s 23 “incident index partner” couples.
Importantly, this finding does not imply that 40–50% of all incident infections in Uganda are due to acute-phase transmission, as some commentators have inferred (Association of State and Territorial Health Officials 2006; Pettifor et al. 2006). This interpretation initially appears plausible: If transmission eventually occurred in 100% of the “incident index partner” couples, 40–50% of these infections would be due to acute-phase transmission; an even larger percentage of incident infections would be attributable to acute-phase transmission if transmission eventually occurred in less than 100% of these couples. However, the proportion of infections due to acute-phase transmission depends not only on the number of infections transmitted by acutely infected persons but also on the number transmitted by chronically infected persons, and on partnership formation and dissolution patterns, including partnership concurrency (Hayes and White 2006; Wawer et al. 2006). In an advanced epidemic chronically infected persons vastly outnumber acutely infected persons and therefore account for a much larger proportion of incident infections than is suggested by the relative transmission rates for acutely infected and chronically infected individuals (Hayes and White 2006; Pinkerton 2007).
For example, in the U.S., the number of persons living with chronic HIV infection exceeds the number of acutely infected persons by a factor of about 150 on any given day. In a recent article, Pinkerton (2007) estimated that approximately 8.6% of the 32,000 sexually transmitted HIV infections acquired each year in the U.S. are due to acute-phase transmission. Similarly, Xiridou et al. (2004) estimated that 11% of incident HIV infections among gay men in Amsterdam could be attributed to acute-phase HIV transmission. An unpublished mathematical modeling analysis based on Wawer et al.’s data suggests that although infectiousness is greatly increased during acute infection, in an established epidemic “only” 11% of incident infections are transmitted during the acute-phase of infection (Hollingsworth et al. 2006). These estimates of the proportion of incident infections that are due to acute-phase transmission are best regarded as tentative in light of the considerable uncertainty that remains with regard to acute-phase HIV transmission dynamics (Pinkerton 2007).
Biological differences in the strains of HIV prevalent in Uganda and the U.S., as well as the higher prevalence of ulcerative STIs in Uganda and other HIV transmission co-factors, likely contribute to greater infectiousness during acute infection in Uganda as compared to the U.S. (Cohen and Pilcher 2005; Pilcher et al. 2004; Wawer et al. 2006). To assess the risk of HIV transmission during the acute-phase of infection in the U.S., Pilcher et al. (2004) combined empirical data from a viral load study of recently infected men with a mathematical model of the relationship between plasma viral load and male-to-female sexual transmission. Their results suggest that between 1.6 and 6.2% of the female partners of acutely infected men would acquire the virus, assuming that the couple engaged in 4–16 acts of sex per month, respectively, during a 54-day period of acute infection. The contrast between these findings and the estimated 46.5% rate for the Rakai cohort is striking. Pilcher et al.’s data imply an average per-act transmission probability of approximately 0.0020 during acute infection for U.S. couples versus an estimated 0.03604 transmission probability for the Rakai cohort. The corresponding transmission probabilities during chronic infection are 0.00055 (Pilcher et al. 2004) and 0.00084 (derived from Wawer et al.’s (2005) data). Thus, the estimated per-act transmission probability for chronic infection is approximately 1.5 times greater in Uganda than in the U.S., whereas the transmission probability for acute infection is about 18 times larger. These findings suggest that substantively different HIV transmission dynamics prevail in Uganda and the U.S.
Limitations of the present analysis include reliance on a published summary of the Rakai data (Wawer et al. 2005) and the very small number (n = 23) of “incident index partner” couples included in this analysis. Because we did not have access to primary data on the correspondence between the numbers of acts reported by each couple and whether or not transmission occurred, we could not use maximum likelihood estimation techniques (Brookmeyer and Gail 1994; Jewell and Shiboski 1990) to estimate average per-act transmission probabilities. Instead, we utilized a computer-based model in which the number of sex acts per couple was binomially distributed to simulate the effect of variability in the number of sex acts. We also calculated corresponding per-act transmission probabilities under the assumption that each couple engaged in the same number of sex acts.
An additional limitation concerns uncertainty in the duration of the non-infectious latency period following HIV acquisition and the length of the acute-phase of infection. In the sensitivity analyses, the average acute-phase transmission probability ranged from 0.03118 to 0.04260 when the duration of the latency period and the length of the acute-phase of infection, respectively, varied from 4 to 14 days and from 42 to 56 days. However, all of the acute- and chronic-phase transmission probability pairs listed in Table 2 fit the Rakai cohort data with minimal error and generated per-partnership risk estimates within 5% of the base-case value. The choice of which pair is most appropriate for use in a particular modeling study depends on the corresponding assumptions regarding the duration of the latency and acute infection periods.
Finally, because the probability of transmission varies greatly during acute infection, one may question the validity of using average acute-phase transmission probabilities in mathematical models of HIV transmission. Although not definitive, we presented illustrative results that suggest that relatively little error is introduced into per-partnership risk estimates through the use of average acute-phase per-act transmission probabilities. This finding suggests that average acute-phase transmission probabilities can be used in epidemiological models without substantial loss of accuracy, obviating the need for complex computer simulations based on uncertain assumptions about temporal variations in the probability of transmission during the course of acute infection.
Very limited information presently is available about the risk of acute-phase HIV transmission. The transmission probabilities calculated here should prove useful in subsequent modeling studies, despite the limitations acknowledged above. Additional research is needed to more accurately estimate the likelihood of transmission during the acute-phase of HIV infection and the epidemiological impact of acute-phase transmission.
Acknowledgments
This research was supported by Grants R01-MH077511 and P30-MH52776 from the National Institute of Mental Health. The author thanks Harrell Chesson, Ph.D, and the anonymous reviewers for their thoughtful comments on the manuscript, Andrew Petroll, M.D. for helpful discussions, and Leah Przedwiecki for assisting with manuscript preparation.
Appendix
As in the main text, let α(d) denote the per-act transmission probability on day d of the acute-phase of infection. The overall risk of HIV transmission from an acutely infected person to his or her sex partner is then γ = l - (1 - α(d1)) (1 - α(d2)). . .(1 - α(dn)), where n is the total number of unprotected sex acts during the acute-phase of infection and α(dk) denotes the per-act transmission probability associated with the kth sex act, which occurs on day dk. This per-partnership transmission risk value can be approximated by γA = 1 - ( 1 - αA)n, where αA =(α(d1) + α(d2) + . . . + α(dn))/n is the corresponding average per-act transmission probability.
Claim The average per-act transmission probability-based approximation, γA, never overestimates the true per-partnership transmission risk, γ (i.e., γA, ≤ γ).
Proof First we will establish the following lemma: if x1, x2,..., xn, are positive real numbers, then x1 * x2 * . . . *xn ≤ ((x1 + x2 + . . . + xn)/n)n. The proof is by induction on n. The claim is trivial for n = 1. Assume the claim holds for some n ≥ 1. Then x1 * x2 * . . . * xn, * xn+1 ≤ xn+1 * ((x1 + x2 + . . . + xn)/n)n. To prove that xl * x2 * . . . * xn * xn+1* ((xl + x2 + . . . + xn + xn+l)/(n + 1))n+1 it sufficesto show that xn+l * ((xl + x2 + . . . + xn)/n)n ≤ ((xl + x2 +. . . + xn + xn+l)/ (n + 1))n+1 , or equivalently, that f(y) =(x + y)n+1 - ((n+ 1)n+1 /nn)xny ≥ 0 (here, x = xl + x2 +. . + xn and y = xn+l). It is easily established through differential calculus that the minimum value of f(y) equals 0 (this occurs when y = x/n) and therefore f(y) ≥ 0 whenever x, y ≥ 0.
To show that γA ≤ γ, let xk = 1 - α(dk) for k = 1, 2 ,...,n and notice that αA = (α(dl) + α(d2) + . . . + α(dn))/n = 1 - (x1 + x2+ . . . + xn)/n. Then, γA ≤ γ, if and only if (1 - α(dl)) * (1 - α(d2)) * . . . * (1 - α(dn))≤( 1 - αA)n, or equivalently, xl * x2 * . . . * xn ≤ ((xl + x2 + . . . + xn)/n)n, which is true by the lemma.
References
- Association of State and Territorial Health Officials Acute HIV infection—an opportunity to enhance primary prevention. ASTHO Bulletin. 2006;(March):1–16. [Google Scholar]
- Brookmeyer R, Gail MH. AIDS epidemiology: A quantitative approach. Oxford University Press; New York: 1994. [Google Scholar]
- Busch MP, Satten GA. Time course of viremia and antibody seroconversion following human immunodeficiency virus exposure. American Journal of Medicine. 1997;102:117–126. doi: 10.1016/s0002-9343(97)00077-6. [DOI] [PubMed] [Google Scholar]
- Cohen MS, Pilcher CD. Amplified HIV transmission and new approaches to HIV prevention. Journal of Infectious Diseases. 2005;191:1391–1393. doi: 10.1086/429414. [DOI] [PubMed] [Google Scholar]
- Gray RH, Li X, Kigozi G, Serwadda D, Nalugoda F, Watya S, Reynolds SJ, Wawer M. The impact of male circumcision on HIV incidence and cost per infection prevented: A stochastic simulation model from Rakai, Uganda. AIDS. 2007;21:845–850. doi: 10.1097/QAD.0b013e3280187544. [DOI] [PubMed] [Google Scholar]
- Hayes RJ, White RG. Amplified HIV transmission during early-stage infection. Journal of Infectious Diseases. 2006;193:604–605. doi: 10.1086/499606. [DOI] [PubMed] [Google Scholar]
- Hollingsworth TD, Anderson RM, Fraser C.Has the role of primary HIV been overstated? 2006Presented at 13th Conference on Retroviruses and Opportunistic Infections[Abstract 913],Denver COFeb.5–8, 2006 [Google Scholar]
- Jacquez JA, Koopman JS, Simon CP, Longini IM. Role of the primary infection in epidemic of HIV infection in gay cohorts. Journal of Acquired Immune Deficiency Syndromes. 1994;7:1169–1184. [PubMed] [Google Scholar]
- Jewell NP, Shiboski SC. Statistical analysis of HIV infectivity based on partner studies. Biometrics. 1990;46:1133–1150. [PubMed] [Google Scholar]
- Kahn JO, Walker BD. Acute human immunodeficiency virus type 1 infection. New England Journal of Medicine. 1998;339:33–39. doi: 10.1056/NEJM199807023390107. [DOI] [PubMed] [Google Scholar]
- Koopman JS, Jacquez JA, Welch GW, Simon CP, Foxman B, Pollock SM, Barth-Jones D, Adams AL, Lange K. The role of early HIV infection in the spread of HIV through populations. Journal of Acquired Immune Deficiency Syndromes and Human Retrovirology. 1997;14:249–258. doi: 10.1097/00042560-199703010-00009. [DOI] [PubMed] [Google Scholar]
- Leynaert B, Downs AM, de Vincenzi I. Heterosexual transmission of human immunodeficiency virus. American Journal of Epidemiology. 1998;148:88–96. doi: 10.1093/oxfordjournals.aje.a009564. [DOI] [PubMed] [Google Scholar]
- Lindbäck S, Karlsson AC, Mittler J, Blaxhult A, Carlsson M, Briheim G, Sönnerborg A, Gaines H. Viral dynamics in primary HIV-1 infection. AIDS. 2000;14:2283–2291. doi: 10.1097/00002030-200010200-00009. [DOI] [PubMed] [Google Scholar]
- Orroth KK, White RG, Korenromp EL, Bakker R, Changalucha J, Habbema DF, Hayes RJ. Empirical observations underestimate the proportion of human immunodeficiency virus infections attributed to sexually transmitted diseases in the Mwanza and Rakai sexually transmitted disease treatment trials: Simulation results. Sexually Transmitted Diseases. 2006;33:536–544. doi: 10.1097/01.olq.0000204667.11192.71. [DOI] [PubMed] [Google Scholar]
- Pearson CR, Kurth AE, Cassels DP, Martin DP, Simoni JM, Hoff P, Matediana E, Gloyd S. Modeling HIV transmission risk among Mozambicans prior to their initiating highly active antiretroviral therapy. AIDS Care. 2007;19:594–604. doi: 10.1080/09540120701203337. [DOI] [PMC free article] [PubMed] [Google Scholar]
- Pettifor AE, Hudgens MG, Levandowski BA, Rees HV, Cohen MS. Response to letters from Jewkes, Parker and Colvin, and Potterat et al. AIDS. 2006;20:956–958. [Google Scholar]
- Pilcher CD, Tien HC, Eron JJ, Jr., Vemazza PL, Leu SY, Stewart PW, Goh LE, Cohen MS. Brief but efficient: Acute HIV infection and the sexual transmission of HIV. Journal of Infectious Diseases. 2004;189:1785–1792. doi: 10.1086/386333. [DOI] [PubMed] [Google Scholar]
- Pinkerton SD. How many sexually-acquired HIV infections in the US are due to acute-phase HIV transmission? AIDS. 2007;21:1625–1629. doi: 10.1097/QAD.0b013e32826fb6a6. [DOI] [PMC free article] [PubMed] [Google Scholar]
- Pinkerton SD, Chesson HW, Crosby RA, Layde PM. Linearity and non-linearity in HIV/STI transmission dynamics: Implications for the evaluation of sexual risk reduction interventions. [DOI] [PMC free article] [PubMed]
- Pinkerton SD, Holtgrave DR, Leviton LC, Wagstaff DA, Abramson PR. Model-based evaluation of HIV prevention interventions. Evaluation Review. 1998;22:155–174. doi: 10.1177/0193841X9802200201. [DOI] [PubMed] [Google Scholar]
- Rapatski BL, Suppe F, Yorke JA. HIV epidemic driven by late disease stage transmission. Journal of Acquired Immune Defciency Syndromes. 2005;38:241–253. [PubMed] [Google Scholar]
- Robinson NJ, Mnlder D, Auvert B, Whitworth J, Hayes R. Type of partnership and heterosexual spread of HIV infection in rural Uganda: Results from simulation modelling. International Journal of STD & AIDS. 1999;10:718–725. doi: 10.1258/0956462991913394. [DOI] [PubMed] [Google Scholar]
- Wawer MJ, Gray RH, Sewankambo NK, Serwadda D, Li X, Laeyendecker 0, Kiwanuka N, Kigozi G, Kiddugavu M, Lutalo T, Nalugoda F, Wabwire-Mangen F, Meehan MP, Quinn TC. Rates of HIV-1 transmission per coital act, by stage of HIV-1 infection, in Rakai, Uganda. Journal of Infectious Diseases. 2005;191:1403–1409. doi: 10.1086/429411. [DOI] [PubMed] [Google Scholar]
- Wawer MJ, Gray RH, Sewankambo NK, Serwadda D, Paxton L, Berkley S, McNairn D, Wabwire-Mangen F, Li C, Nalugoda F, Kiwanuka N, Lutalo T, Brookmeyer R, Kelly R, Quinn TC. A randomized, community trial of intensive sexually transmitted disease control for AIDS prevention, Rakai, Uganda. AIDS. 1998;12:1211–1225. doi: 10.1097/00002030-199810000-00014. [DOI] [PubMed] [Google Scholar]
- Wawer MJ, Serwadda D, Quinn TC, Sewankambo N, Kiwanuka N, Li X, Gray RH. Reply to Gisselquist and Potterat. Journal of Infectious Diseases. 2006;192:1499–1500. [Google Scholar]
- Wawer MJ, Sewankambo NK, Serwadda D, Quinn TC, Paxton LA, Kiwanuka N, Wabwire-Manger F, Li C, Lutalo C, Nalugoda F, Gaydos CA, Moulton LH, Meehan MO, Ahmed S. Control of sexually transmitted diseases for AIDS prevention in Uganda: A randomised community trial. Lancet. 1999;353:525–535. doi: 10.1016/s0140-6736(98)06439-3. [DOI] [PubMed] [Google Scholar]
- Xiridou M, Geskus R, de Wit J, Coutinho R, Kretzschmar M. Primary HIV infection as source of HIV transmission within steady and casual partnerships among homosexual men. AIDS. 2004;18:1311–1320. doi: 10.1097/00002030-200406180-00010. [DOI] [PubMed] [Google Scholar]