Abstract
The Idd3 genetic interval confers protection against multiple autoimmune diseases, including type 1 diabetes and experimental autoimmune encephalomyelitis (EAE). The favored candidate gene in this interval is Il2, which is polymorphic between susceptible and resistant strains of mice. IL-2 regulates the growth/death of effector T cells as well as the generation/maintenance of regulatory T cells (Tregs) and recent studies have shown that NOD.Idd3 Tregs are more suppressive than their NOD counterparts. We have further dissected the mechanisms underlying the differential suppression by NOD and NOD.Idd3 Tregs and find that it is determined by CD11b+ CD11c− antigen presenting cells (APC). Thus, contrary to what might be expected, our data suggest that the differential suppressive activity of NOD and NOD.Idd3 Tregs is not due to an effect of the Idd3 genetic interval on T cells but rather is due to differences in the antigen presenting cell compartment.
Keywords: T cells, Suppression, Autoimmunity
Introduction
While the etiology of most autoimmune diseases is unclear, it is clear that they all have a significant genetic component. Indeed, genome-wide scanning for loci that influence disease has led to the identification of multiple loci in both humans and in animal models of autoimmunity. Interestingly, many of the loci identified in these studies overlap (1-4), giving rise to the concept that there are ‘common autoimmune genes’ affecting susceptibility to multiple autoimmune diseases. One such locus that appears to influence susceptibility to multiple autoimmune diseases is the diabetes susceptibility locus, Idd3 (1) (2) (5).
The Idd3 locus is located on mouse chromosome 3 and has been identified as a susceptibility locus for several autoimmune diseases including type 1 diabetes (5), experimental autoimmune encephalomyelitis (EAE) (1) and autoimmune ovarian dysgenesis (AOD) (2). When the C57BL/6-derived Idd3 interval is introgressed onto the NOD background, diabetes incidence is reduced by 75% (5). Similarly, we have found that NOD.Idd3 mice are protected against EAE (1).
The Idd3 genetic interval has been reduced to 0.15 cM (5) and contains five known genes: Tenr, Il2, Il21, Cetn4 and Fgf2, and two predicted genes of unknown function. Among these, Il2 is an obvious candidate gene because of its established role in regulating T cell growth (6), death (7) (8) and the generation/maintenance of CD4+CD25+FoxP3+ regulatory T cells (Tregs) (9). The fact that there are Il2 gene polymorphisms that are shared among autoimmune susceptible strains (10) and the recent identification of IL-2Ralpha (CD25) as a susceptibility gene for multiple human autoimmune diseases (11) (12) (13) support the hypothesis that Il2 is an important determinant of autoimmune disease susceptibility.
While the functional role of polymorphic variants of Il2 in suppressing autoimmunity has not been discerned (14), a recent study has suggested that an approximately two-fold difference in IL-2 production underlies the superior regulatory T cell function of NOD.Idd3 Tregs relative to NOD Tregs (15). We have furthered addressed the mechanisms responsible for the differential suppressive activity of NOD and NOD.Idd3 Tregs and find that it is determined by the antigen presenting cells (APCs) in NOD and NOD.Idd3 mice. We further identify CD11b+CD11c− APC as the cell type mediating this effect.
Materials and Methods
Animals
Female NOD and NOD.B6Idd3 mice (6−7 weeks) were purchased from Taconic (Germantown, NJ). All mice were screened for diabetes prior to use. Mice were housed in accordance with the guidelines established by the animal care and use committee at Harvard Medical School.
Flow cytometry
Single cell suspensions from the thymus, spleen, and lymph nodes were stained with antibodies against CD4, CD25 (BD Biosciences) and FoxP3 (Ebioscience). All data were collected on a BDFACSCalibur (BD Biosciences).
In vitro proliferation assays
Suppression assay
We isolated CD4+CD25− and CD4+CD25+ cells by sorting (BD FACSAria, BD Biosciences). CD4+25+ (2.5×10⁴/well) and CD4+CD25− (2.5×10⁴/well) were cultured in triplicate in the presence of soluble anti-CD3 (1 μg/ml) and irradiated splenic APCs (1.25×10⁵/well). After 48 hrs, plates were pulsed with 1 μCi/well of 3H-thymidine and harvested 16 hours later. 3H-thymidine incorporation was measured in a β scintillation counter (Wallac). Data are shown as mean of triplicate wells. For APC experiments, CD3+ and CD11c+, CD11b+CD11c− or CD19+ cells were depleted from spleen cells by cell sorting. Post-sort purity in every experiment was 100%. Percent suppression = 100- the mean CPM of wells with the indicated ratios of Effector:Tregs/ mean CPM of wells with CD4+CD25− effectors alone.
Results and Discussion
Regulatory T cells in NOD and NOD.Idd3 mice
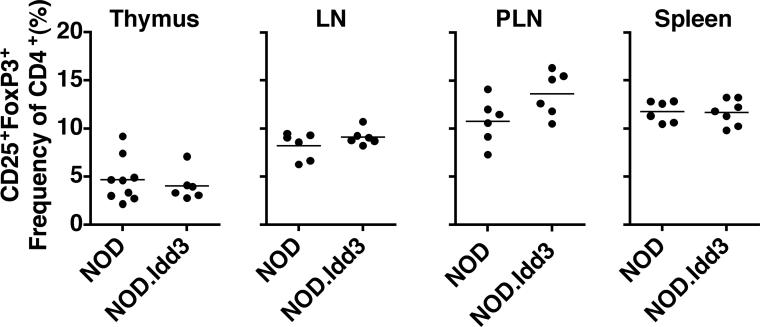
IL-2 is known to be essential for the generation and maintenance/survival of naturally occurring regulatory T cells (Tregs) (9). A recent study reported a higher frequency of naturally occurring CD4+CD25+FoxP3+ Tregs in NOD.Idd3 mice (15) while another study reported no effect of Idd3 on thymic generation of Tregs in fetal thymic organ cultures (16). To resolve whether Idd3 affects thymic generation of Tregs and/or Treg numbers in the periphery, we examined the frequency of naturally occurring CD4+CD25+FoxP3+ Tregs in the thymus and periphery of NOD and NOD.Idd3 mice. We found no difference in the frequency or absolute number of Tregs generated in the thymus of NOD and NOD.Idd3 mice (Figure 1 and data not shown). Similarly, the frequency and absolute number of CD4+CD25+FoxP3+ Tregs in the spleen, lymph nodes, and pancreatic lymph nodes is not different between NOD and NOD.Idd3 (Figure 1 and data not shown). We concluded from these data that the generation and maintenance of Tregs is not different between NOD and NOD.Idd3 mice.
Figure 1. Regulatory T cell frequency in NOD vs NOD.Idd3 mice.
Frequency of CD25+FoxP3+ thymocytes in the CD4 single positive gate and frequency of CD25+FoxP3+ cells in the CD4+ gate from axillary lymph nodes (LN), pancreatic lymph nodes (PLN), and spleen.
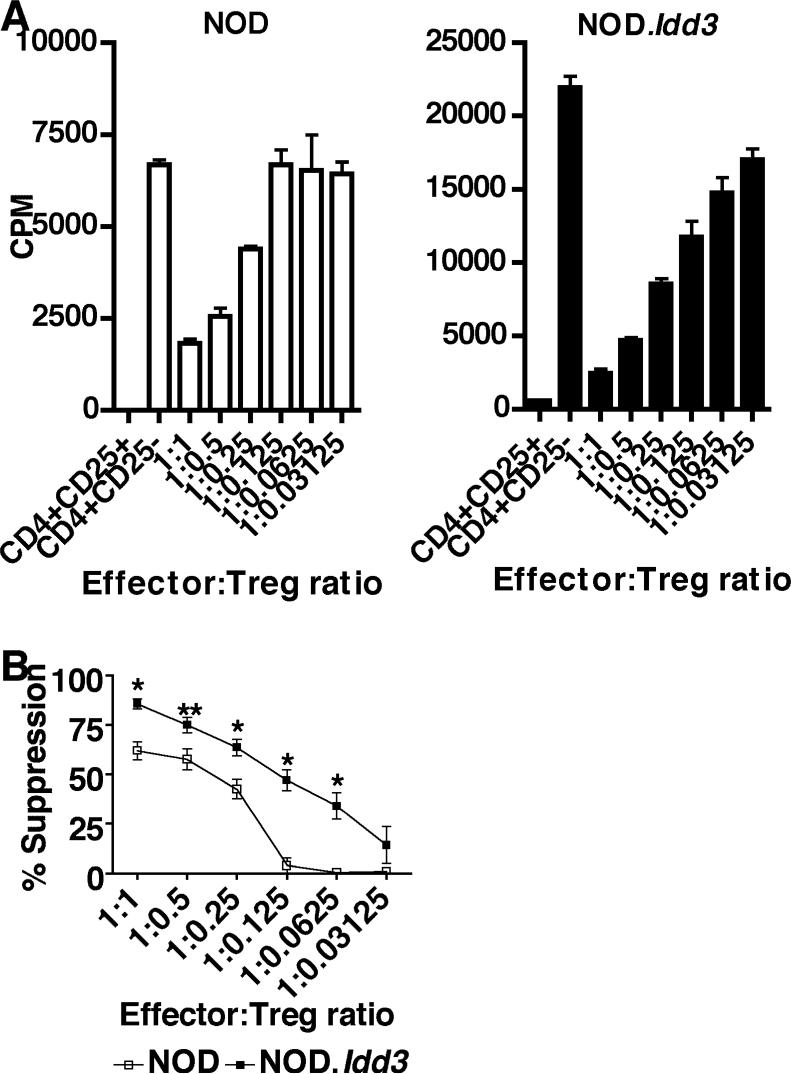
However, it was still possible that NOD and NOD.Idd3 Tregs differed in their suppressive activity. Indeed, a recent study suggests that NOD.Idd3 Tregs have superior regulatory T cell function relative to NOD (15). We have further examined to what extent the regulatory capacity of NOD and NOD.Idd3 Tregs differs by performing an extensive titration of Tregs in in vitro suppression assays. It was clear from these assays that NOD.Idd3 effector T cells (CD4+CD25−) proliferate more than NOD-derived effector T cells (Figure 2 and data not shown). In spite of these differences, we found that on a per cell basis NOD.Idd3 Tregs were significantly more suppressive than NOD Tregs in that they exhibited more suppressive activity at all effector:Treg ratios tested and continued to exhibit suppressive activity even when present at a ratio of 1:0.0625 effector:Treg (16 effectors for one Treg) (Figure 2). In contrast, we observed an almost complete loss of suppressive activity in NOD Tregs when cultured at a ratio of 1:0.125 effector:Treg (8 effectors for one Treg). Thus, NOD.Idd3 Tregs are more suppressive than NOD Tregs and this difference in suppressive activity is apparent in spite of the higher proliferative capacity of NOD.Idd3 effector T cells.
Figure 2. NOD.Idd3 Tregs are more suppressive.
A) CD4+CD25+ Tregs and CD4+CD25− effectors from NOD (left panel) or NOD.Idd3 (right panel) were cultured with irradiated syngeneic APC and soluble anti-CD3. Similar results were obtained in 5 independent experiments. B) Percent suppression of NOD and NOD.Idd3 Tregs. The mean of five independent experiments is shown. *p<0.0159; **p<0.03.
NOD vs NOD. Idd3 APCs determine Treg suppressor function
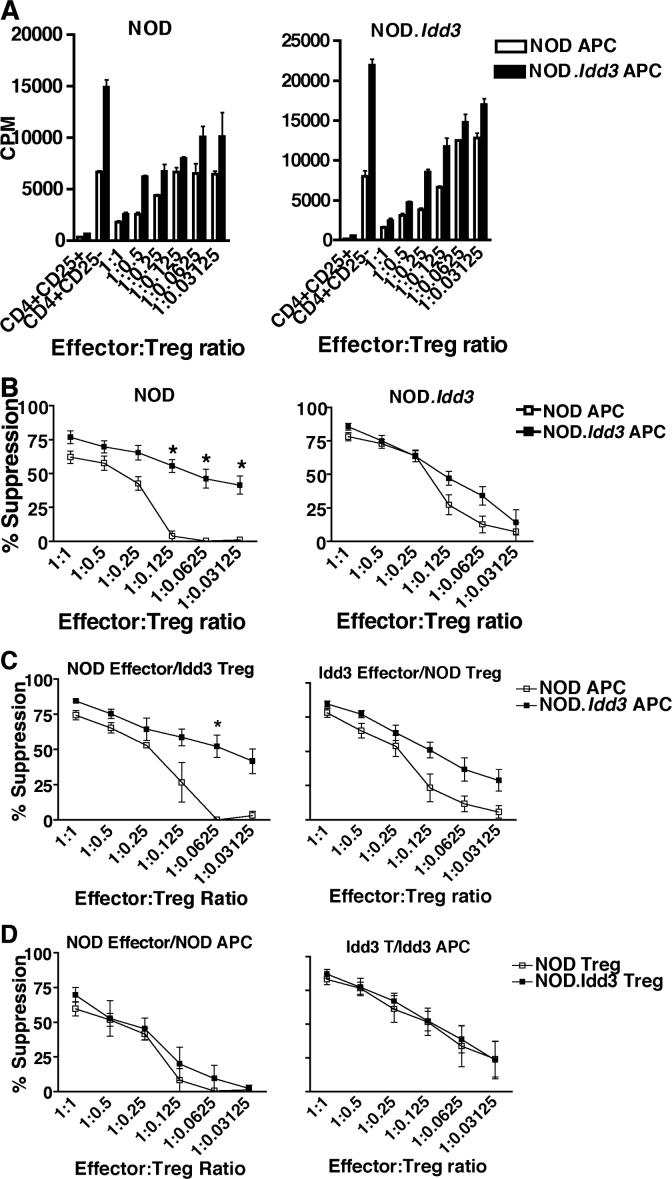
Recent data have shown that Tregs form lasting and stable contacts with dendritic cells (DCs), suggesting that DC-mediated activation of Tregs is critical for suppressive activity and/or Tregs mediate their suppressor function indirectly by inactivating DCs (17). In addition, DCs can produce IL-2 and both DCs and macrophages can express CD25 (18). While the functional role of CD25 on APCs has not been extensively studied, there are data that suggest that stimulation of macrophages with IL-2 induces anti-microbial activity (19) and that IL-2 synergizes with other activating signals to induce IFN in DCs (20). Given the connection of DCs with Treg function and that IL-2 can be produced by and may exert effects on APCs, we investigated whether the differential suppressive activity of NOD.Idd3 Tregs was intrinsic to the Tregs themselves or whether APCs were playing an important role. We therefore cultured effectors and Tregs from NOD and NOD.Idd3 mice with either NOD or NOD.Idd3-derived APCs. Surprisingly, we found that NOD Tregs cultured with NOD.Idd3-derived APC were able to suppress NOD effector cells even when cultured at a ratio of 1:0.03125 effector:Treg (32 effectors for one Treg), whereas NOD Tregs cultured with NOD APC lost most of their suppressive activity when cultured at a ratio of 1:0.125 effector:Treg (8 effectors for one Treg) (Figure 3A and B). Thus, NOD Tregs are not intrinsically defective as NOD.Idd3 APCs can elicit potent suppressive activity from NOD Tregs. This is in spite of the increase in proliferation of NOD effectors cultured with NOD.Idd3 APCs. In contrast, NOD.Idd3 Tregs suppressed NOD.Idd3 effectors equally well regardless of the source of APCs (Figure 3A and B), suggesting that the ability of NOD.Idd3 Tregs to suppress NOD.Idd3 effectors is fixed most likely as a result of their co-evolution.
Figure 3. NOD.Idd3-derived antigen presenting cells drive enhanced suppression.
A) CD4+CD25+ Tregs and CD4+CD25− effectors from NOD (left panel) and NOD.Idd3 (right panel) were cultured with soluble anti-CD3 and irradiated APC from either NOD (open bars) or NOD.Idd3 (closed bars). Similar results were obtained in 5 independent experiments. B) Percent suppression of NOD (left panel) and NOD.Idd3 (right panel) Tregs cultured with NOD (open squares) and NOD.Idd3 (closed squares) APC. The mean of five independent experiments is shown. *p=0.0079. C) Percent suppression of NOD effectors by NOD.Idd3 Tregs (left panel) and of NOD.Idd3 effectors by NOD Tregs (right panel) cultured with NOD (open squares) or NOD.Idd3 (closed squares) APC. The mean of three (left panel) and 5 (right panel) independent experiments is shown. *p=0.02. D) Percent suppression by NOD (open squares) versus NOD.Idd3 (closed squares) Tregs of either NOD effectors cultured with NOD APC (left panel) or NOD.Idd3 effectors cultured with NOD.Idd3 APC (right panel). The mean of 4 (left panel) and 3 (right panel) experiments is shown.
To further examine to what extent NOD versus NOD.Idd3 APCs determine Treg function and to address the possibility of intrinsic differences in the Tregs themselves, we performed additional comparisons. First, we compared the ability of NOD.Idd3 Tregs to suppress NOD effectors in the presence of NOD versus NOD.Idd3 APC and of NOD Treg to suppress NOD.Idd3 effectors in the presence of NOD versus NOD.Idd3 APC. We found that NOD.Idd3 Tregs suppress NOD effectors even when cultured at a ratio of 1:0.03125 effector:Treg (32 effectors for one Treg) when NOD.Idd3 APCs are present while NOD.Idd3 Tregs lose the ability to suppress NOD effectors completely when cultured at a ratio of 1:0.0625 effector:Treg (16 effectors for one Treg) when NOD APCs are present (Figure 3C). We observed a similar trend with NOD Tregs in that NOD Tregs show a small but consistent increase in the ability to suppress NOD.Idd3 effectors when NOD.Idd3 APCs are present. To address the possibility of intrinsic differences in the Tregs themselves, we compared the ability of NOD Tregs versus NOD.Idd3 Tregs to suppress NOD effectors in the presence of NOD APC and NOD.Idd3 effectors in the presence of NOD.Idd3 APC (Figure 3D). We found that NOD Tregs and NOD.Idd3 Tregs were equivalent at suppressing NOD effectors in the presence of NOD APC. Similarly, NOD and NOD.Idd3 Tregs were equivalent at suppressing NOD.Idd3 effectors in the presence of NOD.Idd3 APC. Thus, if the source of APCs and effector cells is kept constant, NOD and NOD.Idd3 Tregs suppress equally well. Collectively, all of our data suggest that the source of APCs is the most important determinant of Treg suppressor function..
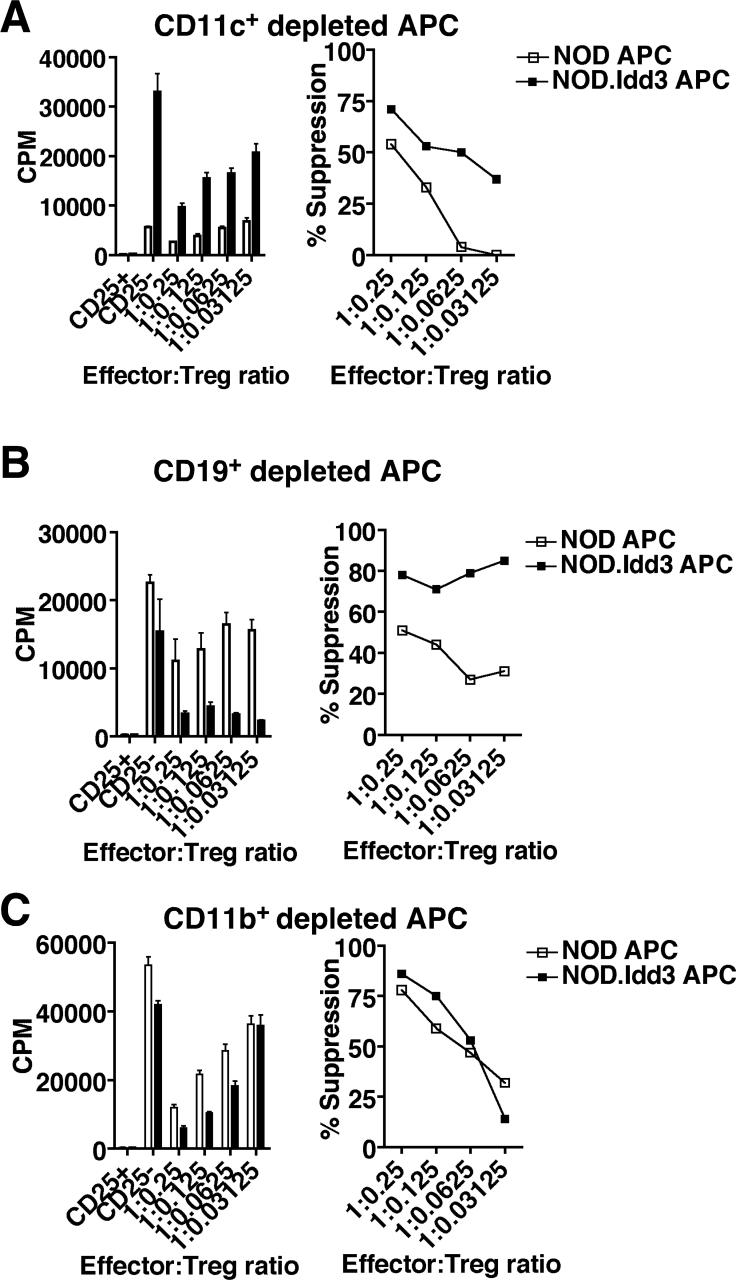
In order to identify the APC population responsible for determining Treg suppressor function, we depleted CD11c+, CD11b+CD11c−, or CD19+ cells from NOD and NOD.Idd3 splenocytes and used the depleted fraction as APC in a suppression assay with NOD effectors and NOD Tregs. We found that NOD Tregs still exhibited poor suppression in cultures with either CD11c+ or CD19+ depleted NOD APC relative to cultures with CD11c+ or CD19+ depleted NOD.Idd3 APC (Figure 4 A and B). However, when CD11b+CD11c− cells were depleted, the suppressive capacity of NOD Tregs in cultures with NOD APC was almost identical to that in cultures with NOD.Idd3 APC (Figure 4C). Interestingly, the suppression by NOD Tregs in cultures with CD11b+CD11c− depleted NOD.Idd3 APC was similar to that observed with whole splenic NOD.Idd3 APC (Figure 3B). Taken together, these data suggest that it is the CD11b+CD11c− APC in NOD mice that impair the ability of NOD Tregs to suppress either directly by inhibiting the suppressor function of Treg and/or rendering effector T cells resistant to suppression or indirectly by affecting the ability of other APC to activate Treg function. Direct comparison of the ability of NOD versus NOD.Idd3 CD11b+CD11c− APC to activate Treg function shows that CD11b+CD11c− APC from NOD are poor at stimulating both effector T cell proliferation and Treg suppression relative to CD11b+CD11c− APC from NOD.Idd3 (Supplementary Figure 1). These data support the possibility that the CD11b+CD11c− APC in NOD determine Treg function by acting directly on T cells; however, we cannot distinguish between the possibilities that NOD-derived CD11b+CD11c− APC inhibit the function of Treg or protect effector cells from Treg-mediated inhibition.
Figure 4. CD11b+CD11c− cells determine regulatory T cell function.
NOD CD4+CD25− effectors (7.5×10⁴/well) were stimulated in the presence of soluble anti-CD3 with NOD or NOD.Idd3 splenic APC depleted of CD3+ cells and either A) CD11c+ cells (2.25×10⁵/well), B) CD19+ (7.5×10⁴/well), or C) CD11b+CD11c− cells (2.25×10⁵/well). NOD APC (open bars/squares) and NOD.Idd3 APC (closed bars/squares). Representative data of 2−3 independent assays is shown.
Previous work has shown that NOD APCs are defective in eliciting suppression from NOD effectors compared to B6 APCs (21). Our studies further narrow this effect to the B6-derived Idd3 interval and isolate the effect to CD11b+CD11c− APC. While our data do not prove or disprove that Il2 is responsible for the protective effect of Idd3, they do ascribe the protective effect of Idd3 primarily to APCs and only indirectly to T cells. It is possible that differences in IL-2 direct the functional responses of effector T cells, Tregs, and possibly APCs. Further investigation of the mechanisms and genes responsible for alterations in APC function will provide insight into the potent protective effect of this genetic interval.
Supplementary Material
Acknowledgements
We wish to thank Deneen Kozoriz for assistance with cell sorting.
This work was supported by National Institute of Health grants NS054096 (ACA) and AI044880 and NS038037(VKK). Vijay K. Kuchroo is a recipient of the Javits Neuroscience Investigator Award from National Institutes of Health (NS30843).
Abreviations used in this paper
- Treg
regulatory T cells
- APC
antigen presenting cell
Footnotes
Publisher's Disclaimer: This is an author-produced version of a manuscript accepted for publication in The Journal of Immunology (The JI). The American Association of Immunologists, Inc. (AAI), publisher of The JI, holds the copyright to this manuscript. This manuscript has not yet been copyedited or subjected to editorial proofreading by The JI; hence it may differ from the final version published in The JI (online and in print). AAI (The JI) is not liable for errors or omissions in this author-produced version of the manuscript or in any version derived from it by the United States National Institutes of Health or any other third party. The final, citable version of record can be found at www.jimmunol.org.
Disclosures
The authors have no financial conflicts of interest.
References
- 1.Encinas JA, Wicker LS, Peterson LB, Mukasa A, Teuscher C, Sobel R, Weiner HL, Seidman CE, Seidman JG, Kuchroo VK. QTL influencing autoimmune diabetes and encephalomyelitis map to a 0.15-cM region containing IL2. Nat. Genet. 1999;21:158–160. doi: 10.1038/5941. [DOI] [PubMed] [Google Scholar]
- 2.Teuscher C, Wardell BB, Luncerford JK, Michael SD, Tung KSK. Aod2, the locus controlling development of atrophy in neonatal thymectomy-induced autoimmune ovarian dysgenesis, co-localizes with IL2, Fgfb and Idd3. J. Exp. Med. 1996;183:631–637. doi: 10.1084/jem.183.2.631. [DOI] [PMC free article] [PubMed] [Google Scholar]
- 3.Vyse TJ, Todd JA. Genetic analysis of autoimmune disease. Cell. 1996;85:311–318. doi: 10.1016/s0092-8674(00)81110-1. [DOI] [PubMed] [Google Scholar]
- 4.Becher B, Durell BG, Noelle RJ. IL-23 produced by CNS-resident cells controls T cell encephalitogenicity during the effector phase of experimental autoimmune encephalomyelitis. J. Clin. Invest. 2003;112:1186–1191. doi: 10.1172/JCI19079. [DOI] [PMC free article] [PubMed] [Google Scholar]
- 5.Lyons PA, Armitage N, Argentina F, Denny P, Hill NJ, Lord CJ, Wilusz MB, Peterson LB, Wicker LS, Todd JA. Congenic mapping of the type 1 diabetes locus, Idd3, to a 780-kb region of mouse chromosome 3: identification of a candidate segment of ancestral DNA by haplotype mapping. Genome. Res. 2000;10:446–453. doi: 10.1101/gr.10.4.446. [DOI] [PMC free article] [PubMed] [Google Scholar]
- 6.Smith KA. T-cell growth factor. Immunol. Rev. 1980;51:337–357. doi: 10.1111/j.1600-065x.1980.tb00327.x. [DOI] [PubMed] [Google Scholar]
- 7.Lenardo MJ. Interleukin-2 programs mouse alpha beta T lymphocytes for apoptosis. Nature. 1991;353:858–861. doi: 10.1038/353858a0. [DOI] [PubMed] [Google Scholar]
- 8.Refaeli Y, Abbas AK. Role of cytokines in autoimmunity. Eur. Cytokine. Netw. 1998;9:81–82. [PubMed] [Google Scholar]
- 9.Malek TR, Bayer AL. Tolerance, not immunity crucially depends on IL-2. Nat. Rev. Immunol. 2004;4:665–674. doi: 10.1038/nri1435. [DOI] [PubMed] [Google Scholar]
- 10.Encinas JA, Kuchroo VK. Genetics of experimental autoimmune encephalomyelitis. In: Theofilopoulos AN, editor. Genes and Genetics of Autoimmunity. Vol. 1. Karger; Basel: 1999. pp. 247–272. [DOI] [PubMed] [Google Scholar]
- 11.Vella A, Cooper JD, Lowe CE, Walker N, Nutland S, Widmer B, Jones R, Ring SM, McArdle W, Pembrey ME, Strachan DP, Dunger DB, Twells RC, Clayton DG, Todd JA. Localization of a type 1 diabetes locus in the IL2RA/CD25 region by use of tag single-nucleotide polymorphisms. Am. J. Hum. Genet. 2007;76:773–779. doi: 10.1086/429843. [DOI] [PMC free article] [PubMed] [Google Scholar]
- 12.International Multiple Sclerosis Genetics Consortium. Hafler DA, Compston A, Sawcer S, Lander ES, Daly MJ, De Jager PL, de Bakker PI, Gabriel SB, Mirel DB, Ivinson AJ, Pericak-Vance MA, Gregory SG, Rioux JD, McCauley JL, Haines JL, Barcellos LF, Cree B, Oksenberg JR, Hauser SL. Risk alleles for multiple sclerosis identified by a genomewide study. N. Engl. J. Med. 2007;357:851–862. doi: 10.1056/NEJMoa073493. [DOI] [PubMed] [Google Scholar]
- 13.Brand OJ, Lowe CE, Heward JM, Franklyn JA, Cooper JD, Todd JA, Gough SC. Association of the interleukin-2 receptor alpha (IL-2Ralpha)/CD25 gene region with Grave's disease using a multilocus test and tag SNPs. Clin. Endocrinol. 2007;66:508–512. doi: 10.1111/j.1365-2265.2007.02762.x. [DOI] [PubMed] [Google Scholar]
- 14.Podolin PL, Wilusz MB, Cubbon RM, Pajvani U, Lord CJ, Todd JA, Peterson LB, Wicker LS, Lyons PA. Differential glycosylation of interleukin 2, the molecular basis for the NOD Idd3 type I diabetes? Cytokine. 2000;12:477–482. doi: 10.1006/cyto.1999.0609. [DOI] [PubMed] [Google Scholar]
- 15.Yamanouchi J, Rainbow D, Serra P, Howlett S, Hunter K, Garner VES, Gonzalez-Munoz A, Clark J, Veijola R, Cubbon R, Show-Ling C, Rosa R, Cumiskey AM, Serreze D, Gregory S, Rogers J, Lyons PA, Healy B, Smink LJ, Todd JA, Peterson LB, Wicker LS, Santamaria P. Interleukin-2 gene variation impairs regulatory T cell function and causes autoimmunity. Nat. Genet. 2007;39:329–337. doi: 10.1038/ng1958. [DOI] [PMC free article] [PubMed] [Google Scholar]
- 16.Feuerer M, Jiang W, Holler PD, Satpathy A, Campbell C, Bogue M, Mathis D, Benoist C. Enhanced thymic selection of FoxP3+ regulatory T cells in the NOD mouse model of autoimmune diabetes. Proc. Natl. Acad. Sci. USA. 2007;104:18181–18186. doi: 10.1073/pnas.0708899104. [DOI] [PMC free article] [PubMed] [Google Scholar]
- 17.Tang Q, Adams JY, Tooley AJ, Bi M, Fife BT, Serra P, Santamaria P, Locksley RM, Krummel MF, Bluestone JA. Visualizing regulatory T cell control of autoimmune responses in nonobese diabetic mice. Nat. Immunol. 2006;7:83–92. doi: 10.1038/ni1289. [DOI] [PMC free article] [PubMed] [Google Scholar]
- 18.Granucci F, Feau S, Angeli V, Trottein F, Ricciardi-Castagnoli P. Early IL-2 production by mouse dendritic cells is the result of microbial-induced priming. J. Immunol. 2003;170:5075–5081. doi: 10.4049/jimmunol.170.10.5075. [DOI] [PubMed] [Google Scholar]
- 19.Belosevic M, Finbloom DS, Meltzer MS, Nacy CA. IL-2. A cofactor for induction of activated macrophage resistance to infection. J. Immunol. 1990;145:831–839. [PubMed] [Google Scholar]
- 20.Fukao T, Koyasu S. Expression of functional IL-2 receptors on mature splenic dendritic cells. Eur. J. Immunol. 2000;30:1453–1457. doi: 10.1002/(SICI)1521-4141(200005)30:5<1453::AID-IMMU1453>3.0.CO;2-W. [DOI] [PubMed] [Google Scholar]
- 21.Alard P, Manirarora JN, Parnell SA, Hudkins JL, Clark SL, Kosiewicz MM. Deficiency in NOD antigen-presenting cell function may be responsible for suboptimal CD4+CD25+ T-cell-mediated regulation and Type1 diabetes development in NOD mice. Diabetes. 2006;55:2098–2105. doi: 10.2337/db05-0810. [DOI] [PubMed] [Google Scholar]
Associated Data
This section collects any data citations, data availability statements, or supplementary materials included in this article.


