Abstract
Several studies have demonstrated significant nonlinearity in the blood-oxygenation-level-dependent (BOLD) signal. The source of BOLD nonlinearity observed in these studies can originate from vascular and/or neuronal responses (Birn and Bandettini, 2005). These nonlinear effects in the BOLD signal can be a potential problem in rapid event-related (ER) fMRI design. In attempt to examine and solve this problem, and also with the aim at understanding the nature of BOLD signal, it is essential to study the source of BOLD nonlinearity because the obscurity in this issue not only impedes accurate modeling of BOLD nonlinearity, but also limits generalization of the conclusions regarding BOLD nonlinearity. In the present study, we employed a paired-stimulus paradigm composed of two ultra-short visual stimuli separated by a variable inter-stimulus interval (ISI). ISIs were chosen (1, 2, 4, 6 and 8 seconds) to ensure neuronal activity is invariant to all stimuli. This is validated by a previous study demonstrating that the refractory period of visual response to ultra-short flashing stimulation is not longer than ~600–800ms (Zhang et al., 2007). Under this circumstance, we have found that the BOLD response to the second of paired stimuli is significantly reduced when ISI is relatively short, whereas this reduction gradually disappears when ISI becomes longer. These results verify significant nonlinearity in the BOLD signal and suggest that this nonlinear behavior results entirely from nonlinearity in the vascular response. Furthermore, we selected a subgroup from all activated pixels which not likely contains large vessels. We found BOLD nonlinearity becomes much less significant in this subgroup. This observation suggests that a very large component, if not all, of the source of BOLD nonlinearity is from large-vessel hemodynamic response.
Keywords: fMRI, BOLD, linear model, paired-stimulus paradigm, visual cortex, large vessel
Introduction
Functional Magnetic Resonance Imaging (fMRI) has been widely used to map cortical activity in a large field of view (Bandettini et al., 1992; Kwong et al., 1992; Ogawa et al., 1992). This technique relies on hemodynamic and metabolic changes spatially accompanied with local neuronal activity. These perfusion-related changes underlying the signal source of fMRI result from several cascaded processes including neuronal processing to external input, neurovascular coupling and vascular response. Therefore, quantitative relationships among these neurophysiologic processes are extremely important in interpreting results from fMRI as well as other neuroimaging modalities such as positron emission tomography, single photon emission computed tomography, optical imaging and near infrared spectroscopy. For instance, increasing stimulation duration may not proportionally increase the corresponding neuronal activity and hemodynamic response due to the mechanism of neuronal adaptation or neuronal interaction. Similarly, the neurovascular coupling relationship may not be strictly linear (Devor et al., 2003; Sheth et al., 2004; Zhang et al., 2007) so that quantitatively inferring neuronal activity from the accompanied fMRI signal sometimes needs to be cautious.
In addition to the relationships between evoked neuronal activity and external stimulation and its coupling to hemodynamic change, the linearity of vascular response is also of critical importance. This is because a large number of fMRI studies in the research field of cognitive neuroscience employ the rapid event-related (ER) design, in which individual trials occur every few seconds before the blood-oxygenation-level-dependent (BOLD) signal returns to the baseline. The advantage of rapid ER fMRI design includes time efficiency and the ability of randomizing trial types and sorting data based on behavioral responses. At the same time, the rapid ER fMRI design needs to assume a linear BOLD signal, that is, vascular response to two identical events shifted with a time delay is the same as the superposition of two replicated responses shifted with the same delay, and every of the two replicated responses should be identical in shape and amplitude to the response to the single event. If BOLD linearity holds, the inference from BOLD signal to neuronal activity can simply be characterized by a hemodynamic impulse-response function. Any deviation from the linear assumption may lower detection sensitivity of rapid ER fMRI experiments.
Unfortunately, a number of studies have demonstrated that significant nonlinearity exists in the BOLD signal (Birn and Bandettini, 2005; Birn et al., 2001; Boynton et al., 1996; Cannestra et al., 1998; Dale and Buckner, 1997; Friston et al., 1998; Friston et al., 2000; Glover, 1999; Huettel and McCarthy, 2000; Inan et al., 2004; Janz et al., 2001; Pfeuffer et al., 2003; Robson et al., 1998; Soon et al., 2003; Wager et al., 2005, Buxton, 1998 #18, Vazquez, 1998 #19). When subtracting the BOLD response to a single stimulus from the response to two identical sequential stimuli, the magnitude of the subtracted response is smaller compared to the single-stimulus response and the degree of this BOLD reduction depends on the delay between two sequential stimuli and stimulation duration (Boynton et al., 1996; Huettel and McCarthy, 2000; Inan et al., 2004; Pfeuffer et al., 2003; Robson et al., 1998; Wager et al., 2005). In addition, the onset latency of the BOLD response to the subsequent stimulus is longer compared to the single-stimulus BOLD response and this latency difference also depends on the delay between two sequential stimuli with longer latencies observed for shorter delays (Huettel and McCarthy, 2000; Pfeuffer et al., 2003).
These nonlinear effects observed in the BOLD signal potentially can be a problem in rapid ER fMRI designs. In attempt to solve this problem and improve the detection sensitivity using rapid ER fMRI designs, several models have been developed to account for the nonlinearity in fMRI data (Friston et al., 1998; Friston et al., 2000; Wager et al., 2005, Vazquez, 1998 #19, Glover, 1999 #10). For instance, Friston et al characterized both linear and nonlinear aspects of hemodynamic response by specifying first-order and second-order Volterra kernels based on fMRI time course (Friston et al., 1998; Friston et al., 2000). Given their flexibility, these models have played important roles in fMRI applications. Hence, validation of these models is of particular interest. To achieve this goal, and also with the aim at understanding the nature of BOLD signal (Buxton et al., 1998), detailed investigation of the origin of BOLD nonlinearity is essential.
Revealing the source of BOLD nonlinearity needs to answer two questions. First, does BOLD nonlinearity result from nonlinear vascular activity caused by viscoelastic properties of blood vessel (Buxton et al., 1998; Vazquez and Noll, 1998) or from nonlinearity of neuronal activity? Birn and Bandettini have suggested that potential contributors to the BOLD nonlinearity observed in previous studies include components that are attributed to neuronal origin and components that are of vascular origin (Birn and Bandettini, 2005). The obscurity in the origin of BOLD nonlinearity not only impedes accurate modeling of BOLD nonlinearity, but also limits generalization of the conclusions regarding BOLD nonlinearity. Therefore, it is necessary and important to design an experiment that can separate nonlinear effects from neuronal and vascular activities. For example, under that circumstance of invariable neuronal activity, the nonlinear effect in the BOLD signal, if observed, can be ascribed to vascular origin.
In the present study, we have employed a paired-stimulus paradigm composed of two ultra-short (10 ms duration) visual stimuli with a variable inter-stimulus interval (ISI) between them (Ogawa et al., 2000; Zhang and Chen, 2006; Zhang et al., 2007; Zhang et al., 2005). We have demonstrated that when visual stimulation duration is as short as tens of milliseconds, neuronal activities elicited in the visual cortex in response to the first and second visual stimuli are identical at ISI longer than 600~800ms (Zhang et al., 2007). Based on this fact, we chose five different ISIs (1, 2, 4, 6 and 8 seconds) to ensure invariant neuronal activity and measured the corresponding BOLD responses to the single stimulus and paired stimuli. We also allowed sufficiently long inter-trial interval (ITI) to avoid any interference in vascular responses between consecutive stimulation pairs. This design allows us to individuate the BOLD response to the second of paired stimuli by subtracting the BOLD response to the single stimulus from that to paired stimuli at each ISI. If there is a vascular nonlinearity, the amplitude of the BOLD response to the second stimulus should be a function of ISI. Alternatively, if BOLD nonlinearity is of neuronal origin, the BOLD response to the second stimulus should be independent of ISI and the same as the single-stimulus response.
The second question regarding the source of BOLD nonlinearity is that if the BOLD nonlinearity is of vascular origin, which component(s) inside the vascular tree (capillary or venous vessel) should be dominantly attributed to. To answer this question, we selected a subgroup from all activated pixels in the fMRI map. In this subgroup, pixels are less likely to contain large vessels compared to the pixels outside of the subgroup. An index υ is defined by the ratio of the standard deviation divided by the mean of MR signal intensity obtained from a series of fMRI images at the resting condition. Since MR signal intensity at large vessel is relatively low and variation is high, a pixel located at large vessels tends to have a larger υ value while a pixel only containing microvasculature tends to have a smaller υ value. It has been demonstrated that large vessel contamination in fMRI maps can be successfully eliminated using this υ index (Chen et al., 1999; Glover, 1999). Hence, in the present study we used the υ index to segregate the activated pixels biased by large vessels and pixels primarily containing microvasculature. We set several thresholds on the υ index and examined whether BOLD nonlinearity would demonstrate different characteristics in these subgroups of pixels.
Materials and Methods
Subjects
Eight healthy subjects (six males, two females, 21–54 years old) participated in this study. The subjects provided informed consent which was approved by the Institutional Review Board of the University of Minnesota.
Visual Stimuli
Visual stimulation presented as ultra-short flashing light (10 ms duration per flash) was generated by a pair of red LED goggles (Grass Instruments, Quincy, MA). Visual stimuli were displayed in the full visual field either singly or in pair separated by an ISI of 1, 2, 4, 6 or 8 seconds. The light was in 100% contrast. The same visual stimulation has been shown to elicit consistent hemodynamic response in the human primary visual cortex (Zhang and Chen, 2006; Zhang et al., 2007; Zhang et al., 2005). Successive trials of single or paired stimuli were separated by an ITI of 25 seconds to allow the hemodynamic response to return to the baseline. During the baseline condition, subjects were in uniform darkness.
Experiment procedure and data acquisition
All experiments were performed on a 4T/90 cm bore magnet (Oxford, UK) system interfaced with the Varian INOVA console (Varian Inc., Palo Alto, CA). A single-loop radiofrequency (RF) surface coil (10-cm diameter) was used to optimize MRI sensitivity at the occipital lobe. Head motion was limited with a foam-padded holder. At the beginning of experiment, axial, sagittal and coronal anatomic images were acquired using a conventional T1-weighted TurboFLASH method (Haase, 1990). On the basis of anatomic images, six coronal slices covering most of the calcarine fissure were selected for acquiring fMRI data using the gradient-echo planar images (GE EPIs) with the parameters of FOV = 18×18 cm2, 64×64 in-plane matrix size, echo time (TE) = 31 ms, repetition time (TR) = 415 ms, slice thickness = 5 mm, in-plane resolution = 2.8×2.8 mm2.
The fMRI experiment was conducted using an ER design. All stimuli were time locked to TR. For each single or paired stimulation task, 15–17 trials were repeated in one run and two runs were repeated in each experiment. A total of twelve fMRI runs corresponding to six tasks (1 single and 5 paired tasks) were acquired in a pseudo-randomized order in each experiment. Subject’s attention was controlled in the way that the number of flashes captured was required to be counted and reported by subject after the end of each run. This procedure was to ensure no flash was missed, considering the visual stimulus was extremely short. The number of trials varied slightly across runs so that subjects could not predict the number of flashes they would see in each run. The total trial number for each task across two runs was maintained approximately the same (n = 31). Another run of 40 time points was acquired when subject was at the baseline condition to generate the mask for segregating pixels with different vessel sizes. Data from two subjects were excluded from further processing due to significant gross head movement.
Data analysis
All the fMRI data analysis was performed using the STIMULATE software package (Stimulate, Center for Magnetic Resonance Research, University of Minnesota) (Strupp, 1996) and Matlab (The Mathworks Inc., Natick, MA, USA). All time series were segmented from 10 time points before and 60 time points after the onset of stimulation. Epochs identified were selectively averaged for each task, resulting in six averaged time series for single- and paired-flash tasks.
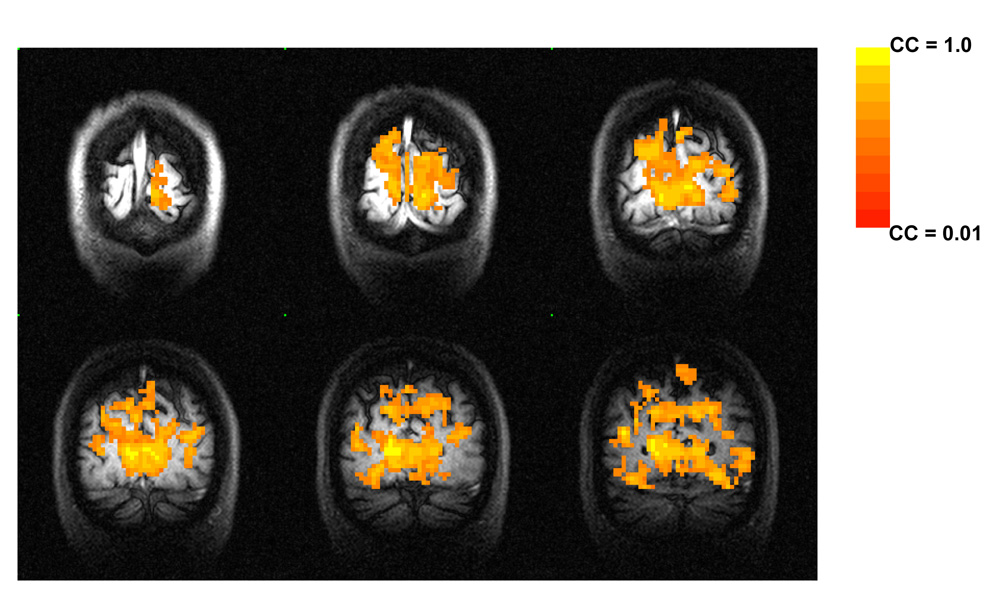
Activation maps were generated using a time-shifted cross-correlation (CC) method (Bandettini et al., 1993, Xiong, 1995 #27). Pixels activated in the single-flash task were identified by correlating the averaged single-flash time course with a trapezoidal function (a modified box-car function accounting for hemodynamic delays). A relatively high threshold was chosen (CC > 0.5, p <0.0001) to suppress false positive level. We also used gamma function as the reference function and generated very similar maps at the threshold chosen. Since the trapezoidal function used in our experiment is model free and can generate typical activation map in the visual cortex as shown in Figure 1, we continued to use the activation maps generated by this procedure for further processing. A region of interest (ROI) was defined by all activated pixels at the proximity of the calcarine fissure for each subject. This ROI was later used for all tasks. For each activated pixel within the ROI, an index υ was calculated based on the time series acquired at the baseline condition. The index υ is defined as:
This index was used to categorize vessel size in that pixel.
Figure 1.
A typical functional activation map in the human visual cortex in response to a single-flash task generated using the time-shifted cross-correlation method with a trapezoidal function as the reference (CC > 0.5).
Both ROI based and pixel-by-pixel based analyses were used to quantify BOLD nonlinearity. In the ROI-based analysis, time courses were averaged across all activated ROI pixels for each task. The averaged time course was then calculated as percentage change relative to the baseline condition. The time courses at paired-flash conditions in percentage change were subsequently normalized to the single-flash condition. This normalization method allows inter-subject averaging without the need of accounting for different BOLD amplitudes across subjects. After normalization, the time course at the single-flash condition was subtracted from the time course at each paired-flash condition, resulting in the BOLD response to the second stimulus for each ISI. BOLD nonlinearity at each paired-flash condition was quantified by the ratio of BOLD integrals between the BOLD response to the second stimulus and the response to the single stimulus.
In the pixel-by-pixel based analysis, the time course for each activated ROI pixel was first calculated as percentage change relative to the baseline condition for each task. The time course of the single-stimulus task in percentage change was then subtracted from the time course of each paired-stimulus condition at the corresponding pixel. In that way, the BOLD response to the second stimulus at each paired-stimulus condition could be obtained for each individual activated pixel. Finally, the ratio of BOLD integrals between the response to the second stimulus at each ISI and the response to the single stimulus was calculated to quantify BOLD nonlinearity at each activated pixel.
No temporal or spatial filter was applied in either ROI based or pixel-by-pixel based analysis to avoid any type of bias.
Results
BOLD nonlinearity
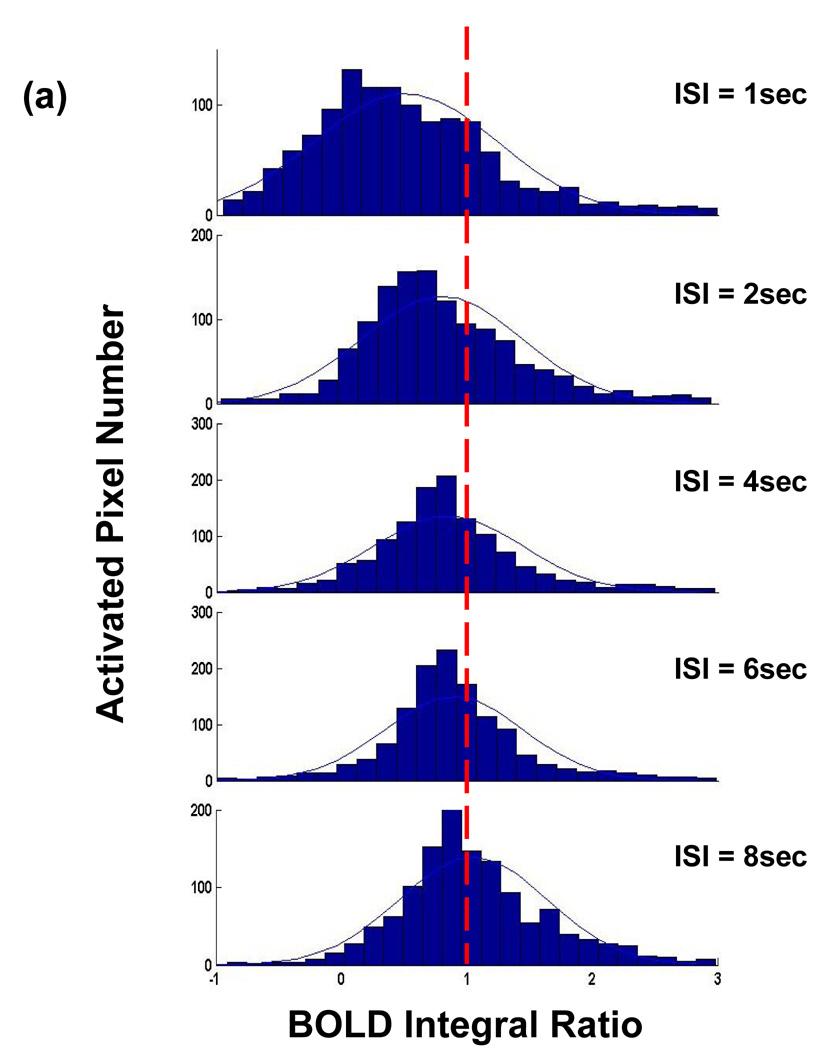
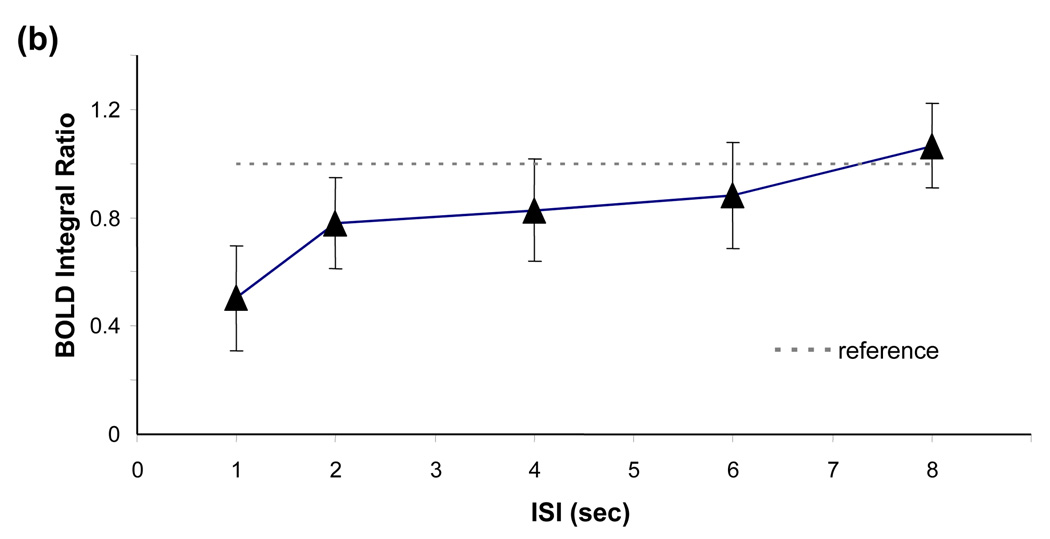
Figure 2 demonstrates a typical relationship of BOLD integral ratio between the response to the second stimulus and the response to the single stimulus as a function of ISI analyzed on a pixel-by-pixel basis (Figures. 2a and 2b) and ROI basis (Figure. 2c) from all subjects. Fig. 2a shows the histograms of BOLD integral ratio of all activated ROI pixels for all paired-stimulus conditions. At long ISIs, the distribution of BOLD integral ratio is symmetric and concentrated around the value of 1, indicating the amplitude of the BOLD response to the second stimulus is the same as that to the single stimulus. Yet, when ISI gets shorter, the distribution becomes skewed with the majority of BOLD integral ratios smaller than 1, indicating the vascular response is in a refractory period (i.e. the BOLD signal to the second stimulus is smaller than that to the single stimulus). Fitting the distributions with a Gaussian function provides the mean value of BOLD integral ratio at each ISI. As shown in Fig. 2b, the mean value of BOLD integral ratio monotonically increases and asymptotically approaches to 1 as ISI gets longer. Comparing to the reference (=1) using a paired t-test gives the p values of 0.002, 0.027, 0.097, 0.18 and 0.39 for ISIs of 1, 2, 4, 6 and 8 secs, respectively. The dependency of BOLD integral ratio on ISI quantitatively agrees well with the literature results (Birn and Bandettini, 2005; Huettel and McCarthy, 2000) and is in accordance with the behavior of refractoriness. Since the neuronal responses to the single, first and second stimulus are identical (Zhang et al., 2007), the nonlinearity in BOLD signal observed herein is entirely ascribed to vascular origin.
Figure 2.
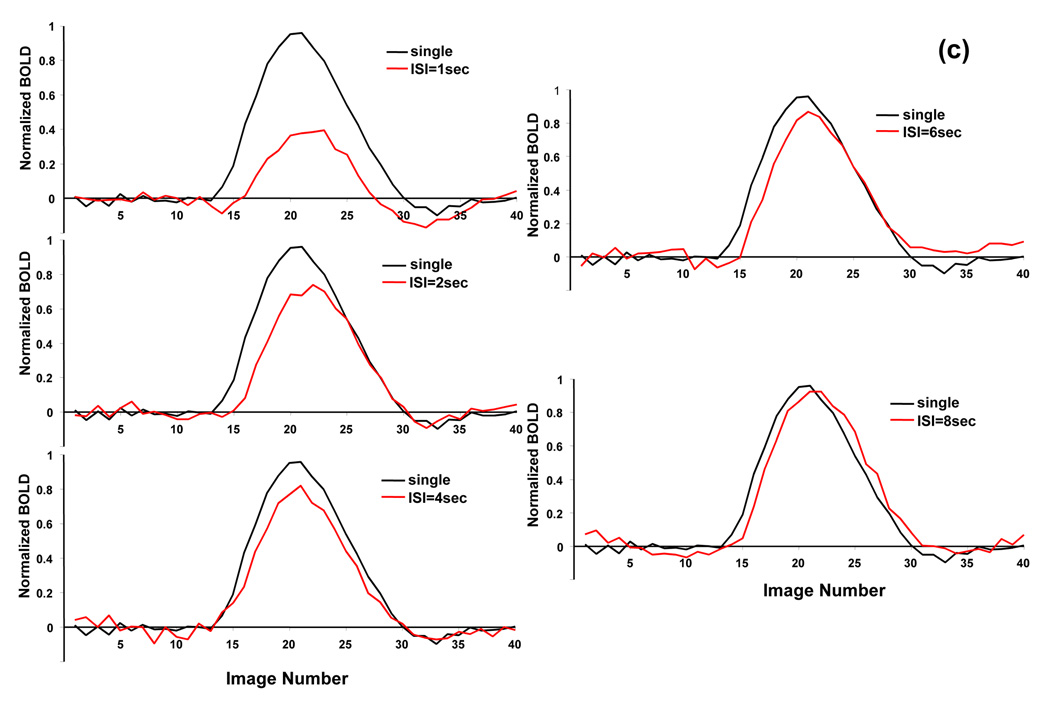
BOLD nonlinearity with invariant neuronal activity. (a) Histograms of BOLD integral ratio at different ISIs from all subjects. The distributions are fitted to a Gaussian function as indicated by blue curves. (b) Mean values of Gaussian distributions of BOLD integral ratio as a function of ISI. The mean values are obtained from the fitting results in (a). The reference (dash line) indicates the level when the BOLD response to the second stimulus is the same as that to the single stimulus. Bars are one time standard deviation across subjects. (c) Averaged BOLD time courses at the single stimulus and at the second stimulus shifted by the amount of ISI to align the stimulus onset.
The same conclusion can be drawn from the ROI based analysis. Fig. 2c compares, for each ISI, the averaged BOLD time course at the single stimulus to that at the second stimulus shifted by the amount of ISI to align the stimulus onset. Clearly, the BOLD response to the second stimulus at short ISI is significantly reduced due to vascular refractoriness. This BOLD reduction gradually becomes smaller, eventually disappearing, when ISIs get longer. Quantitative analysis on a ROI basis gives almost the identical dependency of BOLD integral ratio on ISI as that obtained on a pixel-by-pixel basis.
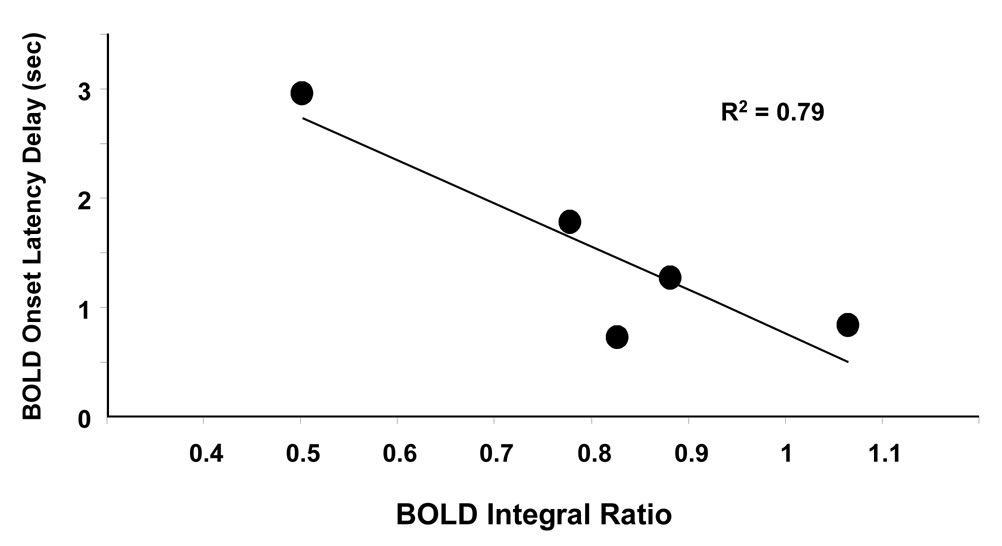
In addition to variations in BOLD amplitude as ISI changes, the onset time of BOLD response to the second stimulus always delays compared to the response to the single stimulus. The delay appears to be longer when the BOLD refractoriness effect is more significant. To further validate this view, all BOLD time courses in Fig. 2c are fitted to two Gamma functions used to account for the positive BOLD signal and undershoot, respectively. The onset time was recorded at the time when BOLD signal is larger than one time standard deviation of the pre-stimulus baseline at the single-stimulus condition. Figure 3 plots the delay of BOLD onset latencies between the responses to the second stimuli and that to the single stimulus against BOLD integral ratio. Consistent with the literature finding (Huettel and McCarthy, 2000), a strong negative correlation (R2=0.79) is observed between them. Given the observed relationship between BOLD refractoriness and ISI, we hypothesize that onset latency also provides a measure of BOLD nonlinearity originated from vascular response.
Figure 3.
Dependency of BOLD onset latency delay on BOLD integral ratio. The delay is relative to the BOLD onset latency of the single stimulus. There is a strong correlation between BOLD onset latency delay and BOLD refractoriness (R2=0.79)
Taken together, these data verify significant nonlinearity in the BOLD signal and suggest that these nonlinear behaviors entirely result from the nonlinearity in vascular response. Since BOLD nonlinearity can be completely from vascular origin when a relatively long ISI is applied to eliminate nonlinearity from neuronal activity, we continue to investigate the relationship between BOLD nonlinearity and vessel size.
Relationship between the index υ and vessel size
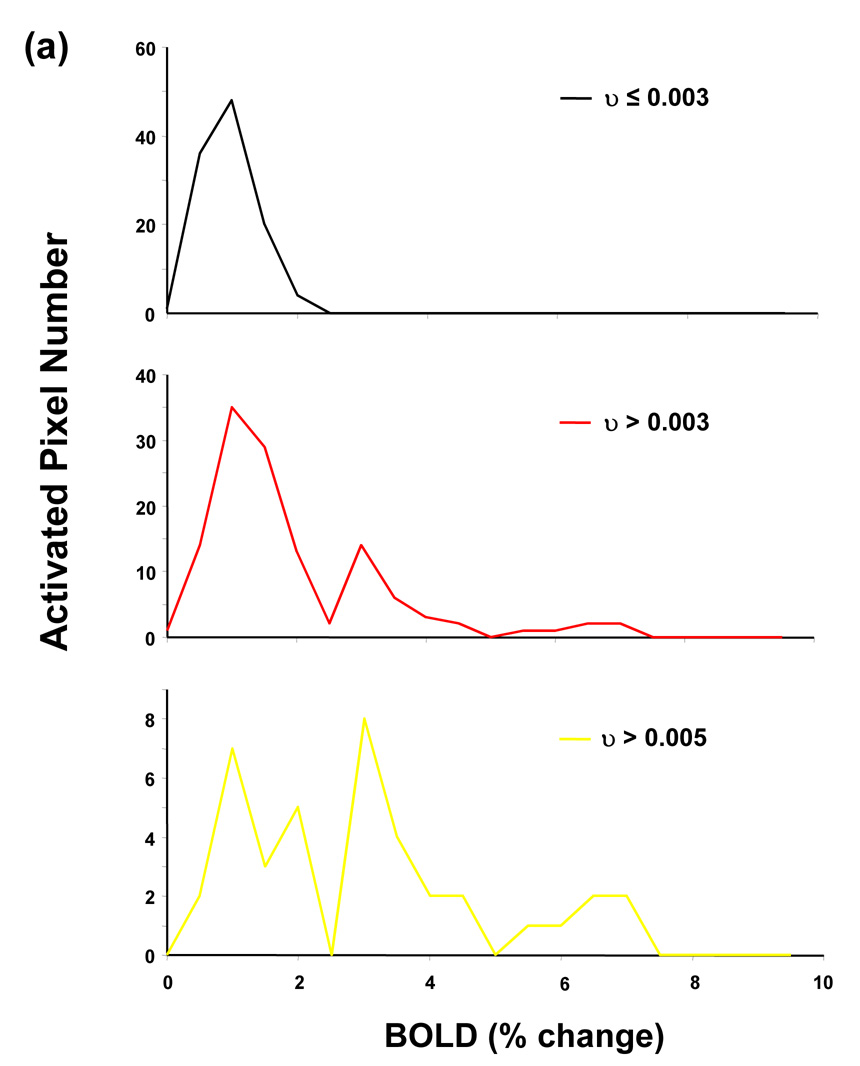
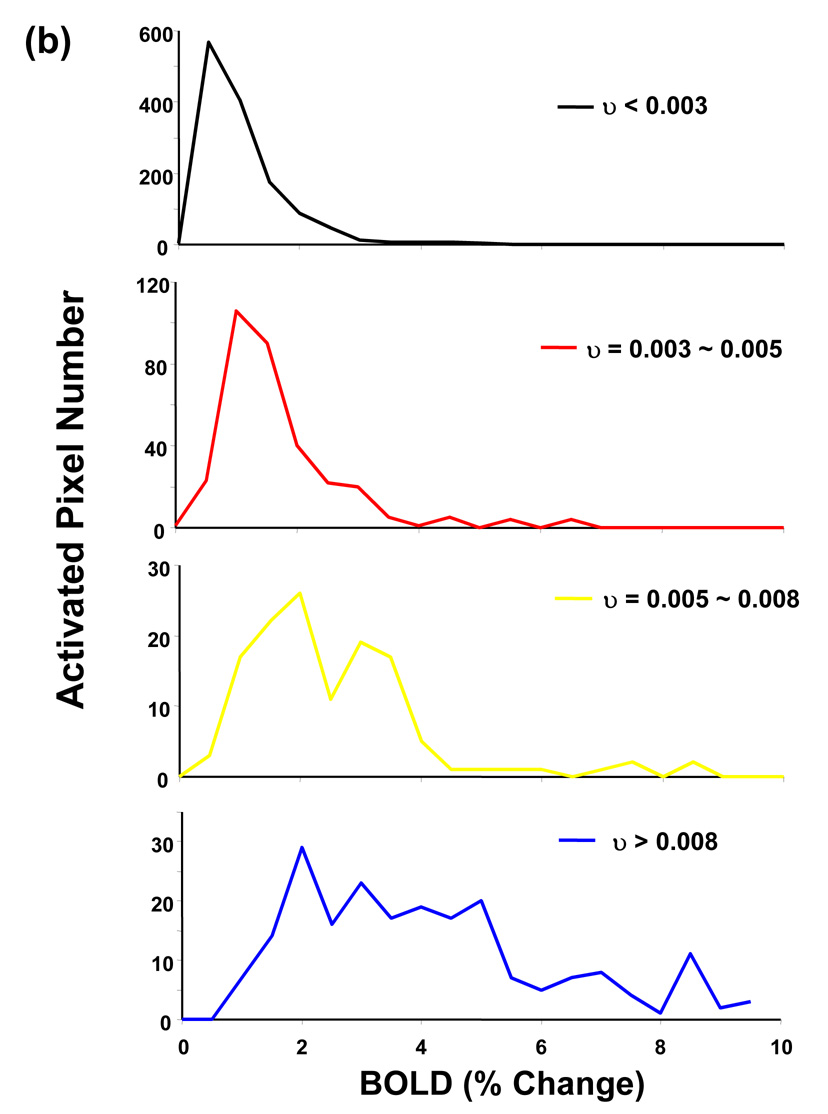
Figure 4a demonstrates distributions of BOLD amplitude (i.e., percentage change) in different ranges of υ value from all activated ROI pixels at the single stimulus condition from one representative subject. In the range of υ < 0.003, BOLD percentage change tends to be small and has a narrow distribution. In contrast, in ranges of larger υ values, BOLD amplitude is characterized by broader distributions with multiple components, and components of large amplitude become more prominent as υ moves to larger values. The same pattern can be observed from distributions of BOLD amplitude in different υ ranges from all subjects (Figure 4b). This pattern results from the fact that BOLD signal at pixels with small υ values only contains effect from microvasculature whereas BOLD signal at pixels with large υ values contains much broader range of blood vessel sizes, going from post-capillary venules to draining veins. Given the well-known fact that BOLD amplitude at large vessel is much larger than that at microvasculature, pixels with larger υ values tend to have larger BOLD amplitudes (Ogawa et al., 1993). This BOLD amplitude versus vessel size relationship closely resembles the observation that BOLD change obtained with the Hahn spin-echo MRI sequence, which is only sensitive to the BOLD signal at the capillary, is narrowly distributed and small in amplitude, whereas BOLD change acquired with a gradient-echo MRI sequence, which is sensitive to BOLD signal from all types of blood vessels, spans a large range of distribution with significant large BOLD amplitude components (Yacoub et al., 2005). These findings further validate the criterion adopted in our study to segregate pixels with different vessel-size components.
Figure 4.
BOLD amplitude in different υ ranges from all activated ROI pixels at the single-stimulus condition from (a) one representative subject and (b) all subjects.
Relationship between BOLD nonlinearity and vessel size
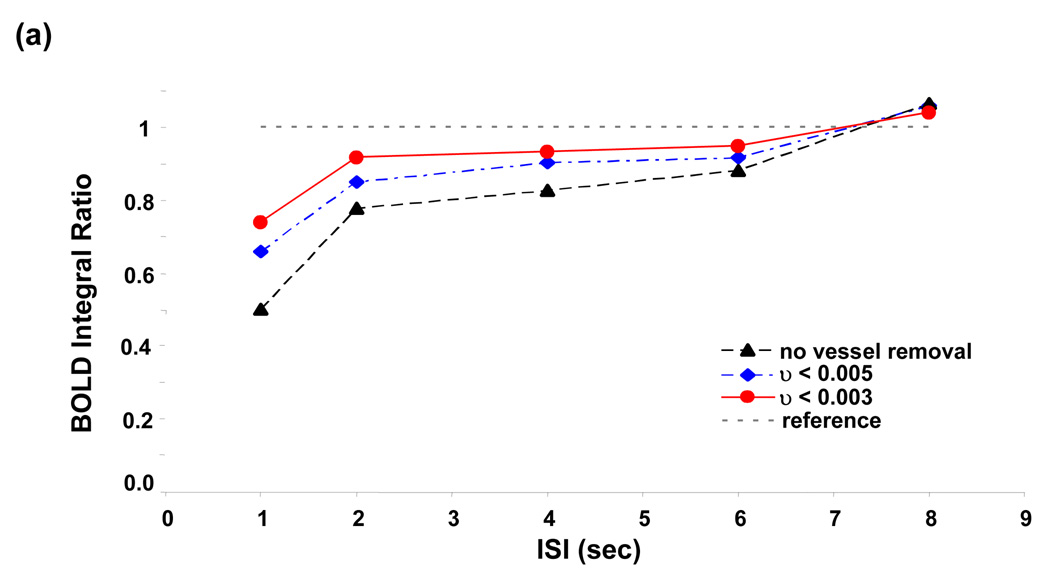
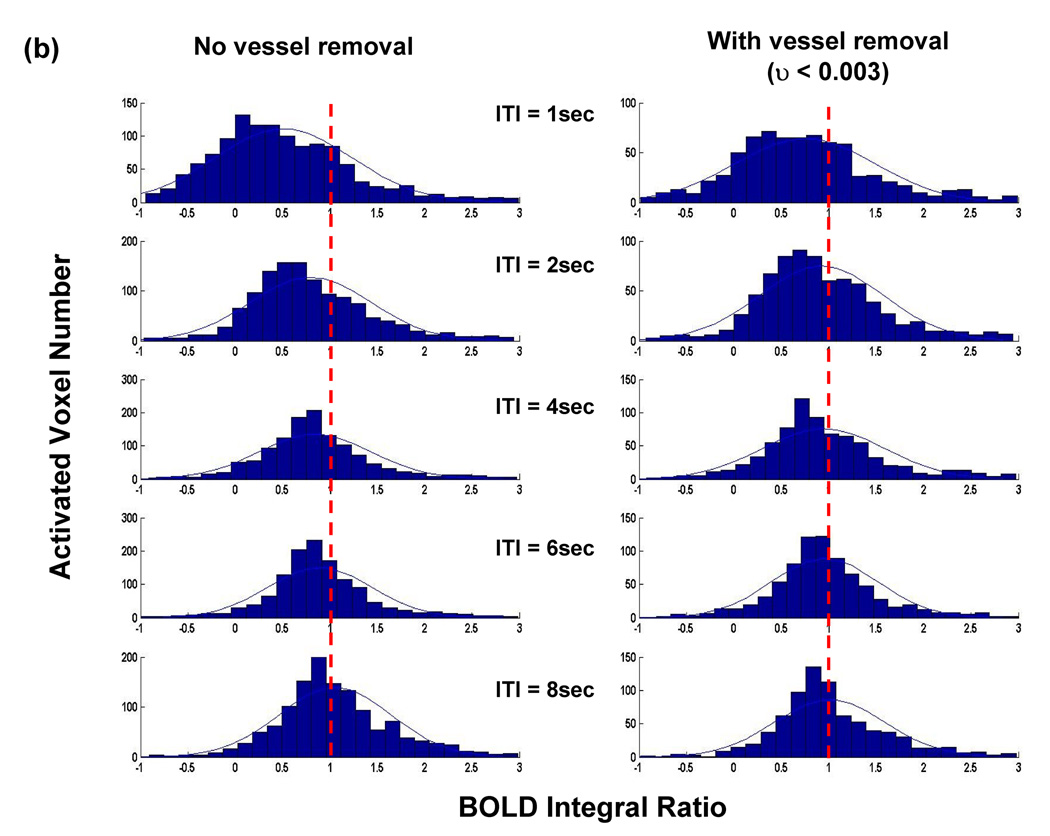
In order to investigate the relationship between BOLD nonlinearity and vessel size, we excluded pixels containing large vessels by setting different thresholds on υ value. Figure 5a demonstrates the dependency of BOLD integral ratio on ISI at two thresholds obtained from the analysis on a pixel-by-pixel basis. Clearly, BOLD nonlinearity is less significant (i.e. BOLD integral ratio is less dependent on ISI and closer to 1) when excluding the pixels containing large vessels by setting the threshold of υ < 0.005 compared to the case without vessel removal. This trend is more prominent at the threshold of υ < 0.003. Figure 5b compares distributions of BOLD integral ratio at different ISIs between the case without vessel removal and that at the threshold of υ < 0.003 from all activated ROI pixels from all subjects. After excluding pixels located at large vessels, distributions of BOLD integral ratio are more symmetric and their mean values are closer to 1 at short ISIs, whereas the distributions of BOLD integral ratio do not change significantly at long ISIs.
Figure 5.
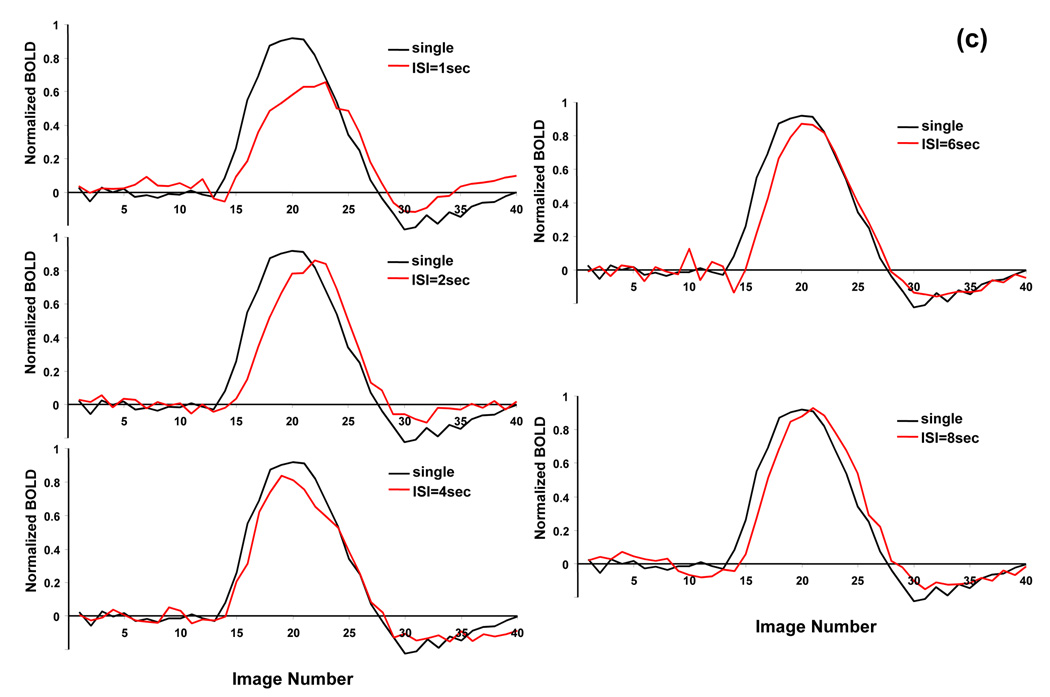
(a) BOLD nonlinearity is less significant after the large vessel contribution is eliminated. Lowering the threshold from υ < 0.005 to υ < 0.003 continues to reduce BOLD nonlinearity. (b) Histograms of BOLD integral ratio from all activated pixels at different ISIs at the thresholds of υ < 0.003. Comparing with the distribution without vessel removal, the BOLD nonlinearity is considerably less significant. (c) Averaged BOLD time courses at the single stimulus and at the second stimulus from all activated ROI pixels at the threshold of υ < 0.003. The time course at the second stimulus is shifted by the amount of corresponding ISI to align the stimulus onset.
Averaged BOLD time courses from activated ROI pixels at the threshold of υ < 0.003 are shown in Figure 5c. Compared to Fig. 2c, BOLD amplitudes in response to the second stimuli considerably increase at short ISIs but remain almost unaltered at long ISIs. This result again suggests that BOLD nonlinearity is less significant after excluding pixels containing large vessels.
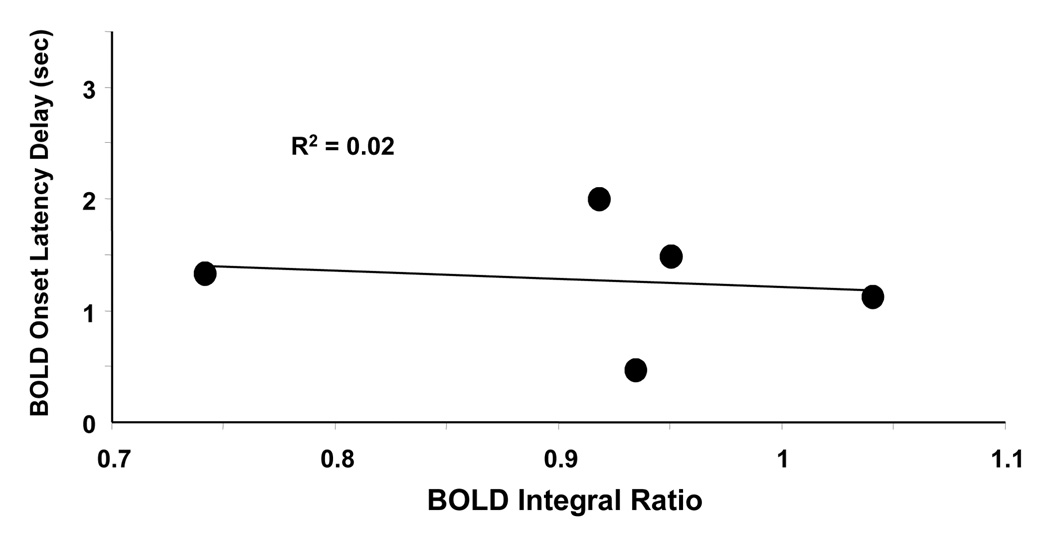
Fitting BOLD time courses averaged from all activated ROI pixels at υ < 0.003 with two Gamma functions enables us to calculate onset latencies of BOLD response after the procedure of vessel removal. Differing from the situation in Fig. 3, the onset latency is no longer correlated with BOLD integral ratio (R2 = 0.02) after vessel removal (Figure 6), indicating weaker dependency of BOLD activity on ISI and thus less significant BOLD nonlinearity.
Figure 6.
Dependency of BOLD onset latency delay on BOLD refractoriness calculated by fitting the averaged BOLD time course at υ < 0.003 with two Gamma functions. Differing from the situation in Figure 3, the onset latency delay is no longer correlated with BOLD integral ratio (R2 = 0.02) after the vessel removal procedure.
The data conclude that excluding pixels containing large vessels significantly increases the BOLD amplitude and shortens the BOLD onset latency when the vascular response is in the refractory period, whereas the procedure of vessel removal has little effect on BOLD activity when vascular refractoriness is absent. These results collectively suggest that a very large component, if not all, of BOLD nonlinearity is contributed by large vessels.
Discussion and Conclusion
In the present study we investigate the source of BOLD nonlinearity using a paired-stimulus paradigm. The task design and selection of ISIs were based on our previous results for ensuring no variation in elevated neuronal activity between the paired stimuli, and thus, eliminating possible neuronal nonlinear contribution. As a result, we could selectively study the vascular contribution to the BOLD nonlinearity. Significant nonlinearity is indeed observed in the BOLD signal, including considerable reduction in BOLD amplitude and delayed onset latency at short ISIs, and this BOLD nonlinearity is completely attributed to vascular activity. This conclusion can be further supported by the second part of the study investigating the relationship between vessel size and BOLD nonlinearity. Excluding pixels containing large vessels significantly increases BOLD amplitude and shortens BOLD onset latency when the vascular response is in the refractory period, whereas the procedure of vessel removal has little effect on BOLD activity when vascular refractoriness disappears. These results collectively suggest that the observed BOLD nonlinearity dominantly originates from the large vessels in the visual cortex.
The present work has several layers of importance: First, it rules out potential contributions of nonlinearity in neuronal activity and ascribes the BOLD nonlinearity observed entirely to vascular origin. Second, it suggests that BOLD nonlinearity is dominated by large vessel activity. Third, it will help to refine the modeling of BOLD nonlinearity and improve accuracy of deconvolving BOLD response in rapid ER fMRI experiments. Fourth, it can potentially provide a new method to select vessel populations with different sizes based on the characteristics of vascular refractoriness.
BOLD nonlinearity and large vessel contribution
If BOLD nonlinearity is dominated by large vessel activity, we would expect that excluding large vessel contribution to the BOLD signal should significantly reduce BOLD nonlinearity. This can be accomplished by excluding activated pixels that likely contain large vessels as demonstrated in the present study, and our results strongly support this prediction. Alternatively, BOLD nonlinearity can be evaluated at different magnetic field strengths because large vessel contribution to the BOLD signal is considerably smaller at higher fields (Boxerman et al., 1995; Yacoub et al., 2005). Pfeuffer et al compared BOLD nonlinearity at 1.5T, 4T and 7T in terms of BOLD amplitude and integral and found that the 7T data exhibit the least nonlinear characteristics while BOLD nonlinearity at 1.5 T is the most pronounced (Pfeuffer et al., 2003). This finding is in excellent consistency with our prediction regarding the dependency of BOLD nonlinearity on large vessel contribution. Taken together, the data clearly suggest that large vessels have a dominant contribution to the BOLD nonlinearity.
Does microvasculature also contain nonlinear characteristics?
The BOLD nonlinearity becomes much less significant after large vessel contribution is removed. However, significant nonlinearity still exists even at the lowest threshold. For example, at υ < 0.003, the BOLD integral ratio is still significantly smaller than 1 at the ISI of 1sec (paired t-test: p < 0.05; see Fig. 5c). In addition, although the BOLD onset latency of the second stimulus is not correlated to BOLD refractoriness at υ < 0.003, there is still a constant delay at all ISIs. The question arising from these observations is whether microvasculature also contains some degree of nonlinearity. Unfortunately, the data acquired in our experimental setting cannot definitely answer this question. This is because given the spatial resolution of our fMRI images (2.8×2.8 mm2), we are not able to strictly separate the capillary bed from small vessels and/or venules. It is very likely that most activated pixels in the subgroup of υ < 0.003 still contain some small vessels and/or venules. Under this circumstance, there is possibility that the BOLD nonlinearity remained when a small threshold is applied originates from small vessels and venules instead of capillary. Considering this argument, our data cannot judge whether the BOLD nonlinearity exhibiting after the vessel removal procedure comes from the capillary or small vessels. Further studies with a higher spatial resolution and/or spin-echo sequence are needed to elucidate this question. Nevertheless, since BOLD nonlinearity becomes much less significant after the vessel removal procedure, nonlinearity in microvasculature, if it exists at all, must be much smaller than that in large vessels.
Further lowering the threshold on υ value
Lowering the threshold from υ < 0.005 to υ < 0.003 significantly reduces BOLD nonlinearity, presumably because lowering threshold can exclude more large-vessel contribution. Intuitively, it would be of interest to further lower the threshold to see the extent to which BOLD nonlinearity can be additionally reduced. Unfortunately, this is not plausible in our study because the lowest threshold used in our study already reaches the limit of MRI scanner stability. This is reflected from the fact that almost no pixels remained at the threshold of υ < 0.001. Therefore, continuing to lower the threshold may not necessarily mean to eliminate more vessel contribution. In addition, one should be cautious that the absolute value of υ threshold chosen in this study may not simply be applied in other studies because υ value is determined by multiple factors such as signal-to-noise ratio, scanner stability and physiologic fluctuations.
Acknowledgement
We thank Dr. Bin He and Mr. Zhongming Liu for their insightful discussion. This work was supported in part by NIH grants of NS41262, EB00329, EB00513, P41 RR08079 and P30NS057091; the Keck foundation and the MIND institute.
Footnotes
Publisher's Disclaimer: This is a PDF file of an unedited manuscript that has been accepted for publication. As a service to our customers we are providing this early version of the manuscript. The manuscript will undergo copyediting, typesetting, and review of the resulting proof before it is published in its final citable form. Please note that during the production process errors may be discovered which could affect the content, and all legal disclaimers that apply to the journal pertain.
References
- Bandettini PA, Jesmanowicz A, Wong EC, Hyde JS. Processing strategies for time-course data sets in functional MRI of the human brain. Magn Reson Med. 1993;30:161–173. doi: 10.1002/mrm.1910300204. [DOI] [PubMed] [Google Scholar]
- Bandettini PA, Wong EC, Hinks RS, Tikofsky RS, Hyde JS. Time course EPI of human brain function during task activation. Magn Reson Med. 1992;25:390–397. doi: 10.1002/mrm.1910250220. [DOI] [PubMed] [Google Scholar]
- Birn RM, Bandettini PA. The effect of stimulus duty cycle and "off" duration on BOLD response linearity. Neuroimage. 2005;27:70–82. doi: 10.1016/j.neuroimage.2005.03.040. [DOI] [PubMed] [Google Scholar]
- Birn RM, Saad ZS, Bandettini PA. Spatial heterogeneity of the nonlinear dynamics in the FMRI BOLD response. Neuroimage. 2001;14:817–826. doi: 10.1006/nimg.2001.0873. [DOI] [PubMed] [Google Scholar]
- Boxerman JL, Bandettini PA, Kwong KK, Baker JR, Davis TL, Rosen BR, Weisskoff RM. The intravascular contribution to fMRI signal change: Monte Carlo modeling and diffusion-weighted studies in vivo. Magn Reson Med. 1995;34:4–10. doi: 10.1002/mrm.1910340103. [DOI] [PubMed] [Google Scholar]
- Boynton GM, Engel SA, Glover GH, Heeger DJ. Linear systems analysis of functional magnetic resonance imaging in human V1. J Neurosci. 1996;16:4207–4221. doi: 10.1523/JNEUROSCI.16-13-04207.1996. [DOI] [PMC free article] [PubMed] [Google Scholar]
- Buxton RB, Wong EC, Frank LR. Dynamics of blood flow and oxygenation changes during brain activation: the balloon model. Magn Reson Med. 1998;39:855–864. doi: 10.1002/mrm.1910390602. [DOI] [PubMed] [Google Scholar]
- Cannestra AF, Pouratian N, Shomer MH, Toga AW. Refractory periods observed by intrinsic signal and fluorescent dye imaging. J Neurophysiol. 1998;80:1522–1532. doi: 10.1152/jn.1998.80.3.1522. [DOI] [PubMed] [Google Scholar]
- Chen W, Zhu XH, Thulborn KR, Ugurbil K. Retinotopic mapping of lateral geniculate nucleus in humans using functional magnetic resonance imaging. Proc Natl Acad Sci U S A. 1999;96:2430–2434. doi: 10.1073/pnas.96.5.2430. [DOI] [PMC free article] [PubMed] [Google Scholar]
- Dale AM, Buckner RL. Selective averaging of rapidly presented individual trials using fMRI. Hum Brain Mapp. 1997;5:329–340. doi: 10.1002/(SICI)1097-0193(1997)5:5<329::AID-HBM1>3.0.CO;2-5. [DOI] [PubMed] [Google Scholar]
- Devor A, Dunn AK, Andermann ML, Ulbert I, Boas DA, Dale AM. Coupling of total hemoglobin concentration, oxygenation, and neural activity in rat somatosensory cortex. Neuron. 2003;39:353–359. doi: 10.1016/s0896-6273(03)00403-3. [DOI] [PubMed] [Google Scholar]
- Friston KJ, Josephs O, Rees G, Turner R. Nonlinear event-related responses in fMRI. Magn Reson Med. 1998;39:41–52. doi: 10.1002/mrm.1910390109. [DOI] [PubMed] [Google Scholar]
- Friston KJ, Mechelli A, Turner R, Price CJ. Nonlinear responses in fMRI: the Balloon model, Volterra kernels, and other hemodynamics. Neuroimage. 2000;12:466–477. doi: 10.1006/nimg.2000.0630. [DOI] [PubMed] [Google Scholar]
- Glover GH. Deconvolution of impulse response in event-related BOLD fMRI. Neuroimage. 1999;9:416–429. doi: 10.1006/nimg.1998.0419. [DOI] [PubMed] [Google Scholar]
- Haase A. Snapshot FLASH MRI. Applications to T1, T2, and chemical-shift imaging. Magn Reson Med. 1990;13:77–89. doi: 10.1002/mrm.1910130109. [DOI] [PubMed] [Google Scholar]
- Huettel SA, McCarthy G. Evidence for a refractory period in the hemodynamic response to visual stimuli as measured by MRI. Neuroimage. 2000;11:547–553. doi: 10.1006/nimg.2000.0553. [DOI] [PubMed] [Google Scholar]
- Inan S, Mitchell T, Song A, Bizzell J, Belger A. Hemodynamic correlates of stimulus repetition in the visual and auditory cortices: an fMRI study. Neuroimage. 2004;21:886–893. doi: 10.1016/j.neuroimage.2003.10.029. [DOI] [PubMed] [Google Scholar]
- Janz C, Heinrich SP, Kornmayer J, Bach M, Hennig J. Coupling of neural activity and BOLD fMRI response: new insights by combination of fMRI and VEP experiments in transition from single events to continuous stimulation. Magn Reson Med. 2001;46:482–486. doi: 10.1002/mrm.1217. [DOI] [PubMed] [Google Scholar]
- Kwong KK, Belliveau JW, Chesler DA, Goldberg IE, Weisskoff RM, Poncelet BP, Kennedy DN, Hoppel BE, Cohen MS, Turner R, et al. Dynamic magnetic resonance imaging of human brain activity during primary sensory stimulation. Proc Natl Acad Sci U S A. 1992;89:5675–5679. doi: 10.1073/pnas.89.12.5675. [DOI] [PMC free article] [PubMed] [Google Scholar]
- Ogawa S, Lee T-M, Stepnoski R, Chen W, Zhu XH, Ugurbil K. An approach to probe neural systems interaction by functional MRI at neural time scale down to milliseconds. Proc Natl Acad Sci U S A. 2000;97:11026–11031. doi: 10.1073/pnas.97.20.11026. [DOI] [PMC free article] [PubMed] [Google Scholar]
- Ogawa S, Menon RS, Tank DW, Kim SG, Merkle H, Ellermann JM, Ugurbil K. Functional brain mapping by blood oxygenation level-dependent contrast magnetic resonance imaging. A comparison of signal characteristics with a biophysical model. Biophys J. 1993;64:803–812. doi: 10.1016/S0006-3495(93)81441-3. [DOI] [PMC free article] [PubMed] [Google Scholar]
- Ogawa S, Tank DW, Menon R, Ellermann JM, Kim SG, Merkle H, Ugurbil K. Intrinsic signal changes accompanying sensory stimulation: functional brain mapping with magnetic resonance imaging. Proc Natl Acad Sci U S A. 1992;89:5951–5955. doi: 10.1073/pnas.89.13.5951. [DOI] [PMC free article] [PubMed] [Google Scholar]
- Pfeuffer J, McCullough JC, Van de Moortele PF, Ugurbil K, Hu X. Spatial dependence of the nonlinear BOLD response at short stimulus duration. Neuroimage. 2003;18:990–1000. doi: 10.1016/s1053-8119(03)00035-1. [DOI] [PubMed] [Google Scholar]
- Robson MD, Dorosz JL, Gore JC. Measurements of the temporal fMRI response of the human auditory cortex to trains of tones. Neuroimage. 1998;7:185–198. doi: 10.1006/nimg.1998.0322. [DOI] [PubMed] [Google Scholar]
- Sheth SA, Nemoto M, Guiou M, Walker M, Pouratian N, Toga AW. Linear and nonlinear relationships between neuronal activity, oxygen metabolism, and hemodynamic responses. Neuron. 2004;42:347–355. doi: 10.1016/s0896-6273(04)00221-1. [DOI] [PubMed] [Google Scholar]
- Soon CS, Venkatraman V, Chee MW. Stimulus repetition and hemodynamic response refractoriness in event-related fMRI. Hum Brain Mapp. 2003;20:1–12. doi: 10.1002/hbm.10122. [DOI] [PMC free article] [PubMed] [Google Scholar]
- Strupp JP. Stimulate: A GUI based fMRI analysis software package. Neuroimage. 1996;3:S607. [Google Scholar]
- Vazquez AL, Noll DC. Nonlinear aspects of the BOLD response in functional MRI. Neuroimage. 1998;7:108–118. doi: 10.1006/nimg.1997.0316. [DOI] [PubMed] [Google Scholar]
- Wager TD, Vazquez A, Hernandez L, Noll DC. Accounting for nonlinear BOLD effects in fMRI: parameter estimates and a model for prediction in rapid event-related studies. Neuroimage. 2005;25:206–218. doi: 10.1016/j.neuroimage.2004.11.008. [DOI] [PubMed] [Google Scholar]
- Yacoub E, Van De Moortele PF, Shmuel A, Ugurbil K. Signal and noise characteristics of Hahn SE and GE BOLD fMRI at 7 T in humans. Neuroimage. 2005;24:738–750. doi: 10.1016/j.neuroimage.2004.09.002. [DOI] [PubMed] [Google Scholar]
- Zhang N, Chen W. A dynamic fMRI study of illusory double-flash effect on human visual cortex. Exp Brain Res. 2006;172:57–66. doi: 10.1007/s00221-005-0304-7. [DOI] [PubMed] [Google Scholar]
- Zhang N, Liu Z, He B, Chen W. Noninvasive study of neurovascular coupling during graded neuronal suppression. J Cereb Blood Flow Metab. 2007 doi: 10.1038/sj.jcbfm.9600531. [DOI] [PubMed] [Google Scholar]
- Zhang N, Zhu XH, Chen W. Influence of gradient acoustic noise on fMRI response in the human visual cortex. Magn Reson Med. 2005;54:258–263. doi: 10.1002/mrm.20512. [DOI] [PubMed] [Google Scholar]


