Abstract
BrainMaps.org is an interactive high-resolution digital brain atlas and virtual microscope that is based on over 20 million megapixels of scanned images of serial sections of both primate and non-primate brains and that is integrated with a high-speed database for querying and retrieving data about brain structure and function over the internet. Complete brain datasets for various species, including Homo sapiens, Macaca mulatta, Chlorocebus aethiops, Felis catus, Mus musculus, Rattus norvegicus, and Tyto alba, are accessible online. The methods and tools we describe are useful for both research and teaching, and can be replicated by labs seeking to increase accessibility and sharing of neuroanatomical data. These tools offer the possibility of visualizing and exploring completely digitized sections of brains at a sub-neuronal level, and can facilitate large-scale connectional tracing, histochemical and stereological analyses.
Keywords: brain mapping, brain atlas, virtual microscopy, image pyramid
Introduction
Virtual microscopy is a recent technological innovation involving the merging of digital technologies with conventional microscopy that enables online viewing and interactive navigation through submicron-resolution digital images of glass microscope slides, dubbed "virtual" slides, exactly as if viewing the sections through a microscope (Ferreira, Moon, Humphries, Sussman, Saltz, Miller & Demarzo 1997; Afework 1998; Felten, Strauss, Okada & Marchevsky 1999; Romer & Suster 2003).
The advantages of virtual slides over conventional glass microscope slides are many, and include facilitation of data sharing over the internet, ease and speed of slide navigation, and tight integration into database management systems. For purposes of brain mapping, current virtual microscopy scanners achieve resolutions of digitized slides of more than 100,000 dpi, enabling the generation of brain atlases at microscopic resolutions that exceed, by several orders of magnitude, the resolutions obtained through other digital scanning technologies, MRI, or in conventional print media.
At BrainMaps.org, we have implemented an interactive internet-accessible submicron-resolution digital brain atlas that utilizes over 20 million megapixels of virtual microscopic slides corresponding to serial sections of primate and non-primate brains. In this report, we describe how the atlas has been created, review miscellaneous software tools for accessing the atlas for purposes of visualization and analysis, and finally, discuss the utility of the brain atlas for teaching neuroanatomy.
Tool Description
BrainMaps.org consists largely of annotated, internet-accessible virtual slides and methods for navigating them and extracting data from them through a distributed server-client architecture. The infrastructure, consisting of web servers, relational databases, RAID arrays, and server-side scripts, has been developed (Mikula, Trotts, Stone, & Jones, 2007) and tested over the past two years utilizing over 50 terabytes of virtual slides of largely histochemically-stained whole-brain sub-micron mouse and non-human primate brain material, but also including miscellaneous immunocytochemical, blockface, and in situ hybridization processed brain section series from myriad mammalian and avian species.
Multiresolution Images and Virtual Slides
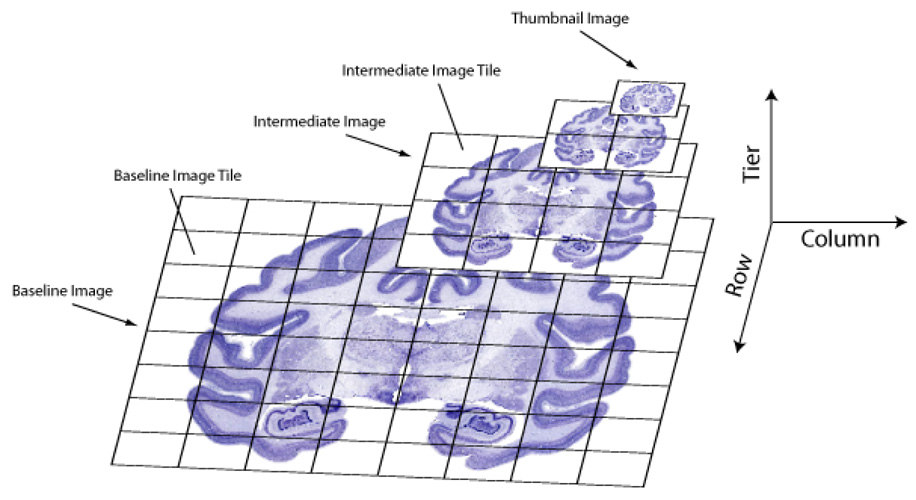
The virtual slides at BrainMaps.org range from 100 megapixels, for rodent brain slices, to more than 10 gigapixels, for macaque brain slices. When working with massive images such as these, it is generally preferable and often necessary to break the image down into smaller pieces and to organize it as a multiresolution image. By 'multiresolution image', we mean that each image consists of a hierarchical image pyramid composed of small image tiles (Figure 1). The multiresolution images we employ are divided into JPG image tiles, of maximum size equal to 256 × 256 pixels, organized as quad-trees (Figure 1). A quad-tree models a two-dimensional region by recursively dividing it into quadrants. By doing this, it is possible to develop software for rapidly accessing just the portions of the multiresolution image that we are interested in, over the internet for example, and thereby bypassing the need to load the entire image into computer memory (RAM), which is oftentimes not technically possible.
Figure 1.
Individual virtual slides are represented as multiresolution image pyramids composed of small image tiles, with a maximum size of 256 × 256 pixels. This allows for rapid online navigation because only the image tiles that are currently being viewed need to be downloaded from the Brainmaps server.
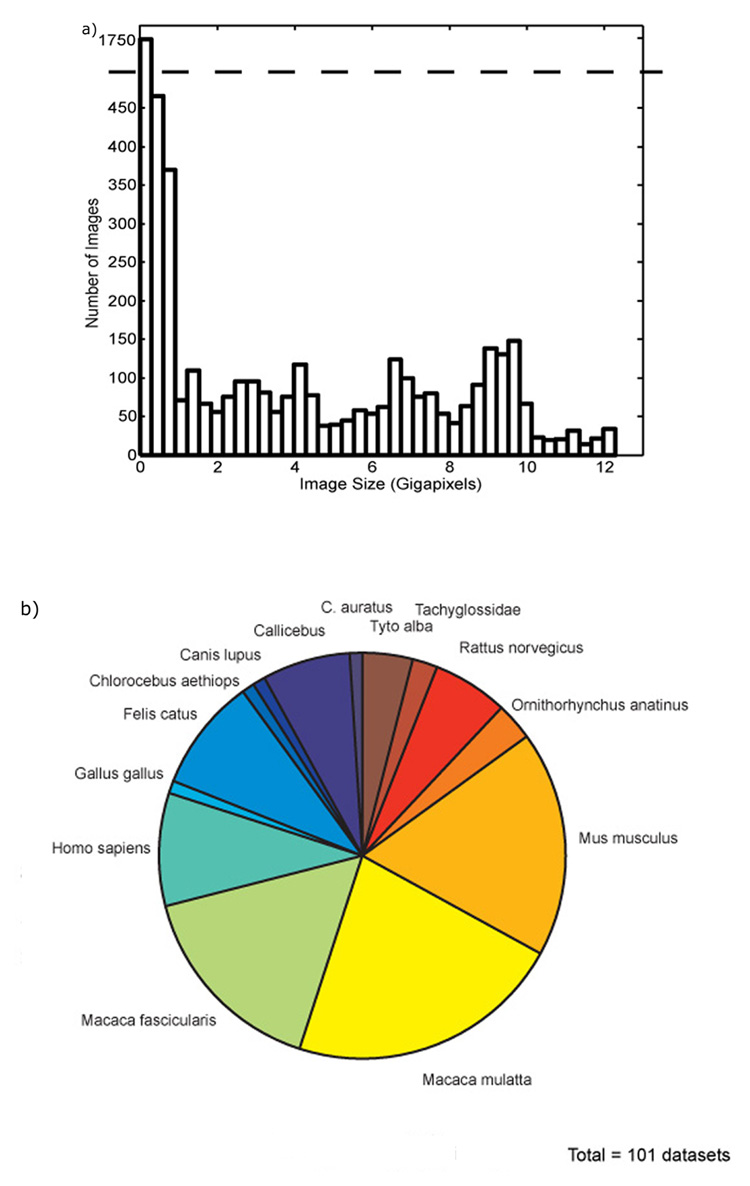
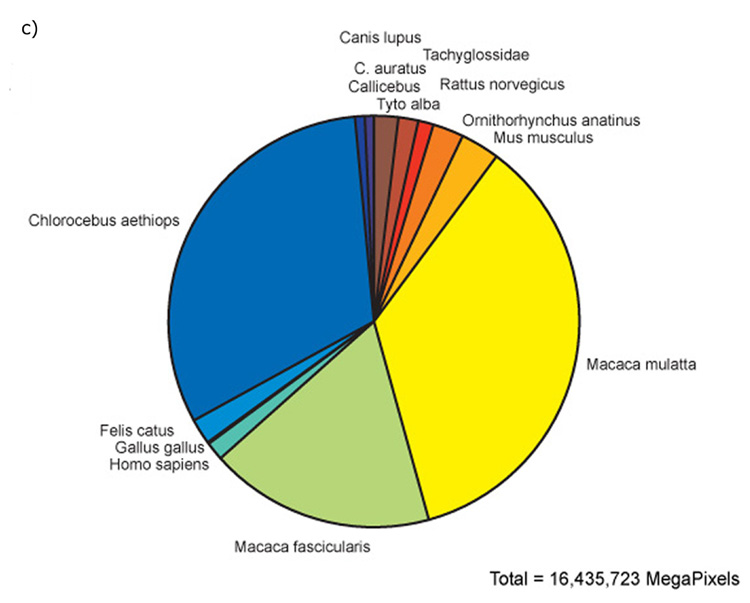
To date, more than 5000 virtual slides of primate and nonprimate brains, totaling over 16,033 gigapixels (or 48.1 terabytes, uncompressed) (Figure 2), and scanned in at 0.46 microns per pixel, have been uploaded and are directly accessible from BrainMaps.org.
Figure 2.
Total quantity of data scanned in, shown here as the distribution of image sizes at BrainMaps.org as of 06-18-2007 (a). The total size of the brain images is 16,435,723 MegaPixels, or 49.31 TeraBytes. The total number of images is 5264, with an average size of 3122.29 MegaPixels/image, or 9.37 GigaBytes/image. Distribution of datasets shown as a function of species (b). The distribution of image pixels shown as a function of species (c) shows that most of the image data online corresponds to the non-human primates, Chlorocebus aethiops, Macaca mulatta, and Macaca fascicularis.
Online Navigation and Graphical User Interfaces
Users access virtual slides from the BrainMaps server either through a web browser, usually through an AJAX (i.e., javascript and dHTML) graphical user interface (GUI) utilizing a MySQL backend, or a custom-coded desktop application, for example, using C and OpenGL (see StackVis below). We have also coded browser-based GUI's in Flash and Java, in addition to AJAX.
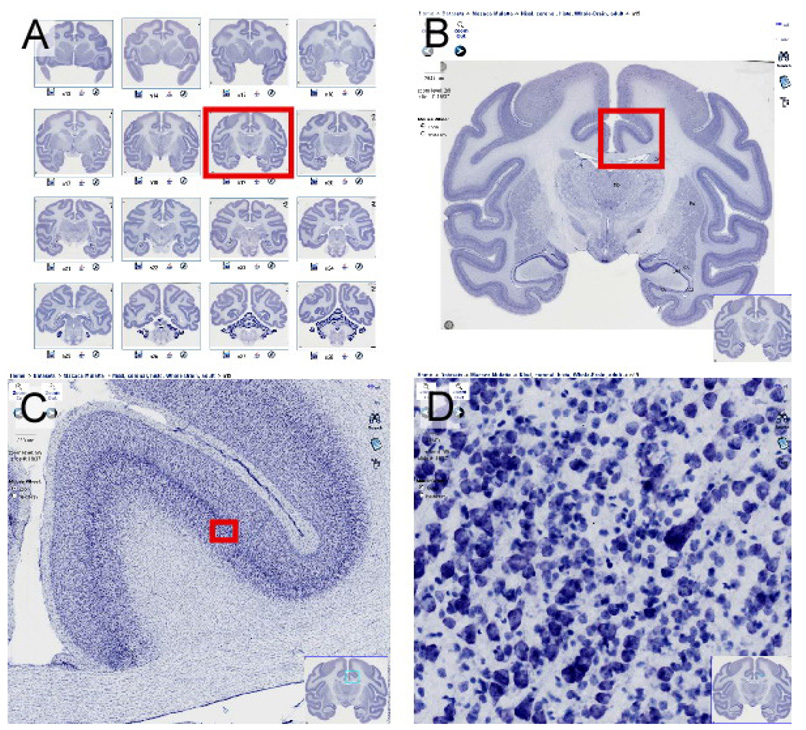
Figure 3 demonstrates navigation, using actual screenshots from a web browser using the AJAX GUI, through a Macaca mulatta dataset of Nissl-stained virtual slides at BrainMaps.org. The capability to interactively zoom in/out of and pan within individual virtual slides, and to rapidly jump to adjacent virtual slides, enables rapid navigation of virtual slides within a given dataset. Database integration permits both querying across datasets for various subsets that satisfy search query constraints and also for simple browsing of all available datasets, organized according to species or other criteria.
Figure 3.
An example of navigation through virtual slides at BrainMaps.org using a Macaca mulatta Nissl dataset. All images are actual screenshots from a web browser and are what a visitor to BrainMaps.org would see. (a) An array of virtual slides for the dataset, shown as clickable thumbnails that, when clicked on, launch a new browser window allowing navigation through the high-resolution image (b). The image in (b) is 104,640 × 84,144 pixels and 24 gigabytes in size. The thumbnail in the lower right is for navigation purposes. Shown also are overlying labels of brain areas that may be toggled on and off. (c) Zooming in on the slide in (b). The red box in (b) corresponds to (c). (d) Zooming in to full resolution in (c), showing details of individual neurons in the cingulate cortex. The red box in (c) corresponds to (d).
Advanced Techniques
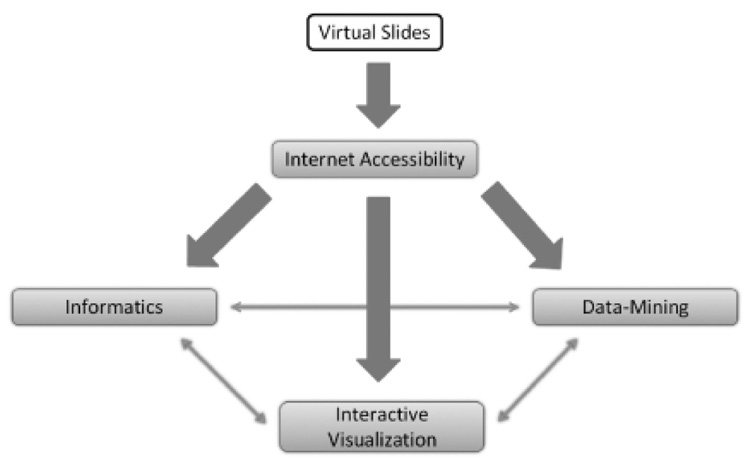
Additional progress at BrainMaps.org has been made on three fronts: 1) interactive visualization, 2) data-mining, and 3) informatics (Figure 4).
Figure 4.
Three avenues for extending BrainMaps.org functionality. Once virtual slides become internet-accessible, additional development in informatics, interactive visualization and data-mining is possible.
Interactive 3D Visualization
How we interact with data is very important. Towards this end, we have developed a desktop application that enables complete interactive visualization of virtual microscopy images and image stacks from BrainMaps.org in both 2D and 3D (Trotts, Mikula, & Jones, 2007). An example is shown in Figure 5.
Figure 5.
Example of interactive 3D visualization of multiresolution image stacks using the desktop application, StackVis. The dataset corresponds to a coronally-sectioned, Nissl-stained Chlorocebus aethiops brain.
Data-Mining
Data-mining includes image analysis of virtual slides and finding patterns in image data. Some examples include cell counts, stereological analysis, cell size distributions, granulometry, neuron morphology analysis, and quantitative architectonics. We have made progress in writing programs and scripts for performing different types of image analyses, including image variance and granulometry (for determining cell size distributions) on virtual slide data obtained remotely from BrainMaps.org.
Informatics
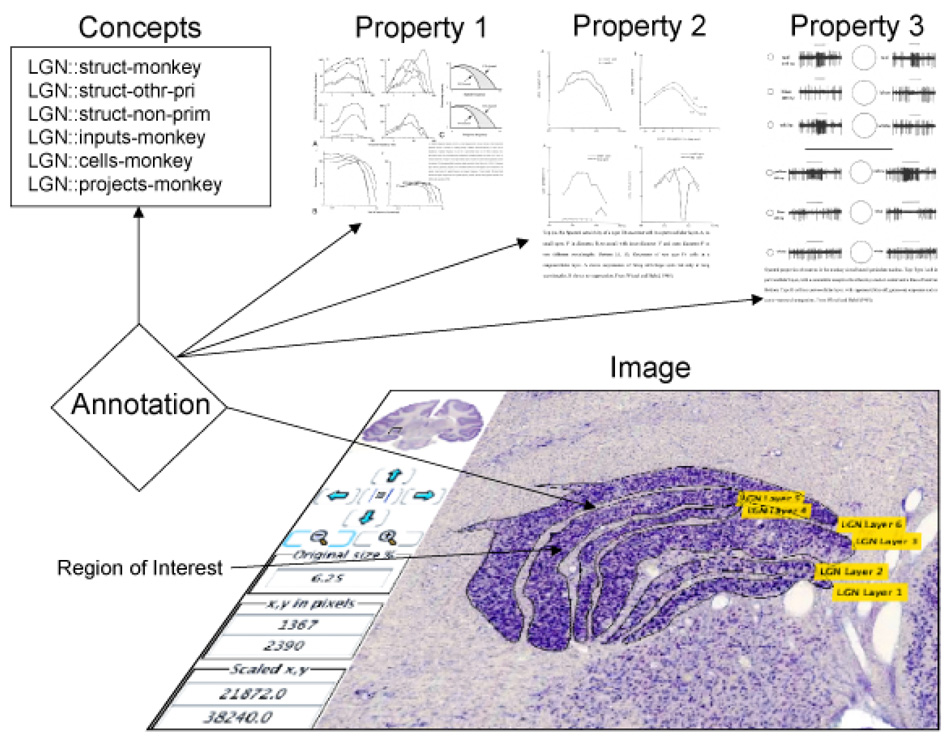
Informatics has three components: 1) Organization of raw image data (virtual slides) into a logical system that facilitates data navigation, retrieval, and querying, 2) integration of diverse types of data into the image data (i.e., EM, MRI, in situ), and 3) organization of diverse types of data that are integrated into the image data. We have developed a relational database for informatics that enables organization of virtual slides into datasets and classification by species, staining method, and other criteria, and that also allows for associating and integrating additional types of data into the virtual slide in a manner similar to GIS. Additional progress in neuroinformatics has been made with the Java annotator (Figure 6), which enables users to create, view, and query annotations of the images on the BrainMaps.org web site.
Figure 6.
An Annotation links a geometric ROI (shown here as a closed Bezier curve delimiting the boundaries of LGN layer 6) on an Image to one of a set of Concepts. The annotation is shown with three properties associated with it. These properties are all of type image (because they are the result of scanning documents) but the original data could have been stored as time series data, enabling data sharing among researchers.
Educational Use
BrainMaps.org, functioning as a virtual microscopy web service, is ideally-suited for teaching neuroanatomy in a classroom setting that has computers with internet connectivity. For example, medical students at SUNY, as part of their neuroscience curriculum, use BrainMaps in conjunction with a worksheet tutorial (http://ect.downstate.edu/cortex_exercise/) to learn about neuroanatomy.
Myriad educational uses can be devised along similar lines, including purely exploratory learning. For example, clicking on a tree symbol in the upper right of the virtual slide viewer will open a labeling hierarchy, shown in Figure 7, which enables navigation through the dataset using the labeling hierarchy.
Figure 7.
Hierarchical navigation through virtual slide datasets. Clicking on a tree symbol in the upper right of the virtual slide viewer will open a labeling hierarchy, shown above, which enables navigation through the dataset using the labeling hierarchy.
In addition, BrainMaps.org virtual slide annotations and labels feature complete integration with the research literature through its "parse pubmed" option, shown in Figure 8. The "parse pubmed" option appears when a label of a brain area or brain object is clicked on, and if the "parse pubmed" option is selected, a window will appear with parsed Pubmed results for the given brain area or brain object.
Figure 8.
The virtual slide viewer features complete integration with the research literature through its "parse pubmed" option, shown here. The "parse pubmed" option appears when a label of a brain area or brain object is clicked on, and if the "parse pubmed" option is selected, a window will appear with parsed Pubmed results for the given brain area or brain object. Note that this window may be closed using the "x" in the upper right.
Summary
We have described and implemented a method for the generation of virtual slides and for their incorporation into an online, interactive, multiresolution brain atlas at BrainMaps.org. We have demonstrated that internet-accessible virtual microscopes and interactive multiresolution histochemical and immunocytochemical brain atlases can be developed using existing computer technologies that facilitate data sharing, rapid navigation, data visualization, and analysis. By allowing for interactive visualization of completely digitized brains at submicron resolution, our online tools will be useful for research, including large-scale histochemical, gene expression, and eventually stereological analyses, and also for didactic purposes, such as the teaching of neuroanatomy.
Literature references
- Afework A. Digital Dynamic Telepathology: The Virtual Microscope. University of Maryland; 1998. [PMC free article] [PubMed] [Google Scholar]
- Felten C, Strauss J, Okada D, Marchevsky A. Virtual microscopy: high resolution digital photomicrography as a tool for light microscopy simulation. Hum Pathol. 1999;30(4):477–483. doi: 10.1016/s0046-8177(99)90126-0. [DOI] [PubMed] [Google Scholar]
- Ferreira R, Moon B, Humphries J, Sussman A, Saltz J, Miller R, Demarzo A. The Virtual Microscope; Proceedings of the 1997 AMIA Annual Fall Symposium; 1997. pp. 449–453. [PMC free article] [PubMed] [Google Scholar]
- Mikula S, Trotts I, Stone JM, Jones EG. Internet-Enabled High-Resolution Brain Mapping and Virtual Microscopy. NeuroImage. 2007;35(1):9–15. doi: 10.1016/j.neuroimage.2006.11.053. [DOI] [PMC free article] [PubMed] [Google Scholar]
- Romer D, Suster S. Use of virtual microscopy for didactic live-audience presentation in anatomic pathology. Ann Diagn Pathol. 2003;7(1):67–72. doi: 10.1053/adpa.2003.50021. [DOI] [PubMed] [Google Scholar]
- Trotts I, Mikula S, Jones EG. Interactive Visualization of Multiresolution Image Stacks in 3D. NeuroImage. 2007;35(3):1038–1043. doi: 10.1016/j.neuroimage.2007.01.013. [DOI] [PMC free article] [PubMed] [Google Scholar]


