

Abstract
Objective
The hypothesis is tested that electrocortical functional connectivity (quantified by coherence) of extremely low birth weight (ELBW) infants, measured at term post menstrual age, has regional differences from that of full term infants.
Methods
128 lead EEG data were collected during sleep from 8 ELBW infants with normal head ultrasound exams and 8 typically developing full term infants. Regional spectral power and coherence were calculated.
Results
No significant regional differences in EEG power were found between infant groups. However, compared to term infants, ELBW infants had significantly reduced interhemispheric coherence (in frontal polar and parietal regions) and intrahemispheric coherence (between frontal polar and parieto-occipital regions) in the 1–12 Hz band but increased interhemispheric coherence between occipital regions in the 24–50 Hz band.
Conclusions
ELBW infants at term post menstrual age manifest regional differences in EEG functional connectivity as compared to term infants.
Significance
Distinctive spatial patterns of electrocortical synchrony are found in ELBW infants. These regional patterns may presage regional alterations in the structure of the cortex.
Keywords: high density electroencephalogram (EEG), synchrony, functional connectivity, coherence, extremely low birth weight (ELBW), term, infant
Introduction
There has been a steady rise in the rate of extreme preterm birth (gestational age <30 weeks; birth weight <1250 g) ), which accounted for 2.3% of all births in 2003 (Martin et al., 2005). These infants are at high risk for poor neurodevelopmental outcome, including cerebral palsy, mental retardation (Furman et al., 1996; Hall et al., 1995; Piecuch et al., 1997; Stewart et al., 1996; Whitaker et al., 1997), attention deficit hyperactivity and anxiety disorders, schizophrenia (Ichiki et al., 2000), learning disabilities (Sykes et al., 1997; Whitaker et al., 1997), sudden infant death (Sahni et al., 2007) and cognitive dysfunction during adolescence (Saigal, 2000). An extensive literature has linked premature exposure to the extrauterine environment and disruption of normal brain development (Hubel et al., 1963; McEwen, 2001; Mower et al., 1982; Pham et al., 2003; Wiesel et al., 1965). Severe abnormalities measured by head ultrasound exam, including interventricular hemorrhage and periventricular leucomalacia, are robust predictors of cerebral palsy. Nonetheless, more than 75% of all surviving extremely low birth weight (ELBW) infants have a normal head ultrasound exam and yet persist in having an increased incidence of cerebral palsy and/or poor cognitive outcome (Fanaroff et al., 2007; Laptook et al., 2005). Thus, our research is focused on the ELBW infants with normal ultrasonic findings with an overall goal to detect changes in electrocortical function early in the neonatal period that are predictive of the neurodevelopmental outcome.
This report describes our initial research in this area, namely to determine if there are differences in electrocortical function between ELBW infants, at term equivalent age, and full term infant controls. We hypothesized that there are regional differences in EEG function between these groups because recent MRI studies have found regional differences in brain anatomy (Inder et al., 2005; Peterson, 2003; Peterson et al., 2003; Thompson et al., 2006); (Boardman et al., 2006; Srinivasan et al., 2007). The EEG is used to evaluate brain function between groups because it is a valuable tool for studies of cortical development (Mizrahi et al., 1987).
For this study spontaneous EEG from sleeping infants was recorded and processed to quantify brain function. The sources of spontaneous EEG are localized groups of neurons within the cerebral cortex, most likely pyramidal cells, that fire synchronously to form electric current dipoles that produce electric potentials measurable on the surface of the scalp (Buzsaki et al., 2004; Pedley TA, 1997). The dipoles that contribute most significantly to the spontaneous EEG are superficial radial dipoles within cortical gyri in close physical proximity to the recording electrode (Nunez, 1981; Salek-Haddadi et al., 2003; Srinivasan et al., 1998). Synchronous firing of neurons within a local cortical group produces increased EEG power at that site. Similarity in the population averages of neural firing across two spatially remote locations produces synchrony in the time-varying behavior of EEG waveforms recorded at those sites (Fingelkurts et al., 2005; Friston et al., 1996; Horwitz, 2003; Koenig et al., 2005; Sporns et al., 2004; Stam, 2004; Valdes-Sosa et al., 2005). Therefore, functional connectivity (as contrasted with neural connectivity) between brain regions can be inferred by quantifying the synchrony of EEG waveforms with use of measures such as the correlation function (Marmarelis, 1978) or coherence (Nunez, 1981; Nunez et al., 1999; Nunez et al., 1997). Various temporal frequencies in the EEG reflect different neural sources that subserve different brain functions (Buzsaki et al., 2004; Pedley TA, 1997). Thus, spectral power, an index of local neural synchrony, and coherence, an index of electrocortical functional connectivity, are measured in various EEG frequency bands.
Previously, researchers attempted visual analysis of the EEG from preterm and term infants but were unable to discern differences between the groups of infants (Ferrari et al., 1992; Nunes et al., 1997). Another group found similar EEG spectral power in the delta band of preterm infants (GA < 32 wks) compared with term infants, but significantly less power at higher frequencies in the preterm group, with the largest differences in the left parasagittal region (Scher et al., 1994). Other research from the same group assessed the correlations of EEG waveforms across multiple pairs of electrodes in term and preterm infants and found significantly higher correlations in the preterm group, particularly in the left parasagittal region, without assessment of the increased probability of false positive findings (Scher et al., 1996; Scher et al., 1997). Healthy infants born close to term were found to have greater coherence between the frontal and occipital regions at 10 Hz and between the left central and temporal regions at 6–24 Hz than prematurely born infants (Duffy et al., 2003). Our previous research developed and validated methods for localization of regional differences in EEG power and coherence in term infants with 128-lead, high density EEG technology (Fifer et al., 2006; Grieve et al., 2005; Grieve et al., 2007). We have applied these methods in the present study.
Methods
Subjects
This study was approved by the Institutional Review Board at Columbia University Medical Center. The subjects were infants in the well baby nursery and the Neonatal Intensive Care Unit of the Morgan Stanley Children’s Hospital of New York-Presbyterian. With prior permission from attending physicians, informed consent was given by the parent(s) of each infant studied. High density (128-lead) EEG data were then collected between postnatal days 2 to 4 from 8 healthy term infants at 39.7 ± 0.8 wks post menstrual age (mean ± SD) with birth weight of 3119 ± 329g and 5 male subjects. Table 1 summarizes the characteristics of this group. One pregnancy was complicated by a positive test for tuberculosis and treated with Isoniazid. There were no other complications. Cesarean delivery was indicated by a breech presentation in 1 pregnancy, suspected fetal distress in 1, and repeat procedures in 4. All infants had a normal neurological exam. Physical findings were all normal except one infant had an undescended testis.
Table 1.
Summary of the clinical characteristics of the 8 full term infants (mean ± s.d.).
| Maternal Age (y) | 26.4±6.9 (18 to 39) |
| Gravidity (#) | 2.9±1.4 (1 to 5) |
| Use By History | |
| Tobacco | Negative 8 of 8 |
| Drugs | Negative 8 of 8 |
| ETOH | Negative 8 of 8 |
| Pregnancy | Uncomplicated 8 of 8 |
| Delivery | |
| Vaginal | 1 of 8 |
| Cesarean | 7 of 8 |
| Apgar Score 1 min. | ≥8 for 8 of 8 |
| Apgar Score 5 min. | ≥9 for 8 of 8 |
| Gestational Age (wk) | 39.7±0.8 (39 to 41) |
| Newborn | |
| Sex | 3 female and 5 male |
| Birth Weight (gm) | 3119±329 (2875 to 3575) |
| Head circ. (cm) | 33.7±1.1 (32 to 35.5) |
| Length (cm) | 49.2±1.3 |
| Growth (AGA= appropriate for gestational age) | AGA 8 of 8 |
| Neurological exam | Normal 8 of 8 |
| Breast Feeding | 6 of 8 |
EEG data were also collected at 40.1 ± 3.8 (mean ± SD) wks post menstrual age in 8 ELBW infants born at 25.4 ± 1.5 wks, with birth weight of 786 ± 158 g and 5 male subjects. Table 2 summarizes the characteristics of this group. Entry criteria included birth weight ≤ 1250 gm, gestational age at birth ≤ 30 weeks, and the absence of maternal complications of pregnancy other than premature labor or rupture of fetal membranes. Two infants were the second born of twin gestations and two mothers were treated with antibiotics (urinary tract infection and vaginal culture positive for group B Streptococcus). None of the women had a history of ethanol, tobacco or drug use in pregnancy. In all ELBW infants there was an absence of abnormal findings with head ultrasound on three exams, two in the first week of life and a third at about one month postnatally. At the time of EEG study infants were receiving full enteral feeds and had no significant cardiorespiratory instability or oxygen requirement.
Table 2.
Summary of the clinical characteristics of the 8 ELBW infants (mean ± s.d.).
| Pregnancy | |
| Gravidity | 2.5±1.3 (range 1 to 5) |
| Multiple gestation | 2 of 8 ( Twins) |
| Assisted Fertility | 2 of 8 |
| Premature Labor | 6 of 8 |
| Fetal Membrane Rupture | 5 of 8 |
| Prenatal Steroids | 6 of 8 |
| Delivery | |
| Vaginal | 3 of 8 |
| Cesarean | 5 of 8 |
| Apgar 1 min. | 5.4±2.4 ( range 2 to 8) |
| Apgar 5 min. | 7.5±0.7 ( range 7 to 9) |
| Gestational Age (wk) | 25.4±1.5 (range 24 to 28.3) |
| Newborn | |
| Sex | 3 female and 5 male |
| Birth Weight (gm) | 786±158 (range 620 to 1120) |
| Head circ. (cm) | 23.4±1.7 (range 21.5 to 26.5) |
| Medical Course | |
| Respiratory Distress | 8 of 8 (6 of 8 severe) |
| Documented Sepsis | 3 of 8 |
| Patent Ductus Arteriosis | 7 of 8 ( ligation 5 of 7) |
| Bronchopulmonary dysplasia | 3 of 8 ( at discharge 1 of 3) |
| Necrotizing enterocolitis | 1 of 8 ( ruled out in 3 of 7) |
| Retrolentilfibroplasia | 4 of 8 ( 2 of 4 laser surgery) |
| Parenteral Nutrition (d) | 43.9±27.8 (range 11 to 104) |
| Hospitalization (d) | 121.5±37.4 (range 75 to 185) |
EEG Protocol and Data Preprocessing
Full term infants were tested in a study room within the newborn nursery and preterm infants in the Neonatal ICU. After fitting the EEG sensor net (Electrical Geodesics Inc; Eugene, OR) according to the manufacturer’s guidelines, infants were lightly swaddled and placed supine in their beds. EEG leads were connected to an Electrical Geodesics 200 portable collection system (Electrical Geodesics Inc; Eugene, OR) and the electrodes were adjusted to obtain the impedance level recommended by the manufacturer. EEG data were band-pass filtered from 0.1 to 400 Hz and then digitized with 16 bits per sample at the rate of 1000 samples per second. Recorded EEG data were re-referenced to a common average reference because it approximates the ideal reference-at-infinity used in theoretical electromagnetic calculations of the potential from cerebral currents. An effective average reference required the large number of electrodes and coverage of scalp surface available from the high density electrode array (Junghofer et al., 1999).
All infants were studied during sleep. Infant sleep state was noted each minute using behavioral criteria established for immature infants by our group (Myers et al., 1997; Sahni et al., 1995; Stefanski et al., 1984) that is in agreement with established methods (Grigg-Damberger et al., 2007). Specifically, the behavior of the infant was observed continuously during the study. Sleep states were assigned according to the following criteria: Quiet Sleep: Infant has eyes closed and has a predominantly flaccid “rag doll” appearance. Body movements are limited to startles, occasional antigravity posturing of the extremities, and rhythmic jaw jerks. Active Sleep: Small movements are seen including writhing, jerky startles, movements of extremities, frowns, smiles, grimaces, chewing and sucking, and occasional whimpers. Eyes may occasionally open or close or remain half open and there may be rapid eye movements.
Studies by our group and others have shown that for both preterm and term infants the active sleep state predominates in the hour following a feeding (Harper et al., 1977; Sahni et al., 2002). We found our study infants to be in active sleep 75–80% of the time and confined subsequent analyses to periods of active sleep.
Data Analysis
As in prior studies, EEG data were subjected to an automated absolute threshold criterion to exclude artifact from head movement, eye blink, and cranial muscle electrical activity (EMG) (Grieve et al., 2003). Custom software was then used to identify electrode bridging (Greischar et al., 2004) and to notch-filter the EEG at the mains power frequency and its harmonics. EEG data were analyzed with software written in the MATLAB language (The Mathworks, www.mathworks.com ). EEG power at each electrode and the magnitude of EEG coherence between all pairs of electrodes were measured in 6 spectral bands (nominal frequency coverage: delta:1–4 Hz, theta: 4–8 Hz, alpha: 8–12 Hz, beta: 12–24 Hz, low gamma: 24–40 Hz, and gamma: 40–50 Hz) in 30-second epochs.
Coherence is a standard statistical procedure for measuring the relationship between two time series, in this application, the EEG measured at two scalp sites (Nunez et al., 1997). Let Gxx (f), Gyy (f), and Gxy (f) be, respectively, the real power spectral density functions of the random processes x(t) and y(t) and the complex cross-power spectral density function for x(t) and y(t). The following definition holds:
| (1) |
where |γ(f)| is the magnitude of the complex-valued coherence function . It can be proven that 0< |γ (f)| < 1. The magnitude of coherence (“coherence” for brevity in the following) can be interpreted as a correlation coefficient quantifying the linear statistical relationship between x(t) and y(t) at a specified frequency. The definition of coherence varies in the literature and in some reports “coherence” or “magnitude-squared coherence” is defined to be equal to | γ( f ) |2. The spectral densities for (1) were estimated using the Fast Fourier Transform method. For example, the cross-spectral density statistical estimate was obtained as
| (2) |
where N is the number of disjoint epochs of x(t) and y(t), each of length T, Xk(f) and Yk(f) are the fast Fourier transforms (FFT) of the k-th records of x(t) and y(t), and “*” signifies complex conjugate (Bendat et al., 2000). The statistical estimate for |γ (f)| was calculated using (1) with spectra calculated by the FFT method of (2). To minimize spatial correlation measurement errors from statistical variability and the use of a common reference, we used a sufficient number of data epochs for computation of coherence and a sufficient number of electrodes for computation of the average reference to assure that coherence measurement errors are less than 10% of full scale coherence. The statistical estimate for |γ (f)| has been shown to have and . This result represents the idealized behavior of the 2N estimator and should be taken as a guideline to the actual accuracy achieved. We chose T=1 s and processed 30 s epochs to obtain N=30. The resulting accuracy for estimating |γ (f)| is bias < 0.1 and standard deviation < 0.08 (Grieve et al., 2003).
We summarized EEG measures in the generally accepted anatomical brain regions shown in Figure 1. EEG power, as a measure of local neural synchrony, was calculated for each of the brain regions as the average of the power for all electrodes in the region. EEG coherence between regions, a measure of functional connectivity, was calculated as the average coherence for all pairs of electrodes spanning the two regions. EEG interhemispheric coherence was calculated between the frontal polar; frontal; temporal; parietal and occipital brain regions across hemispheres. Intrahemispheric coherence was measured between the frontal polar and occipital regions within each hemisphere. In each 30-sec epoch, coherence and power were calculated using 30 independent data sets thus producing a statistically-reliable measurement of these quantities. These data were then averaged over all available epochs for each infant. The averages for each infant were used for summary statistics and further statistical analyses.
Figure 1.
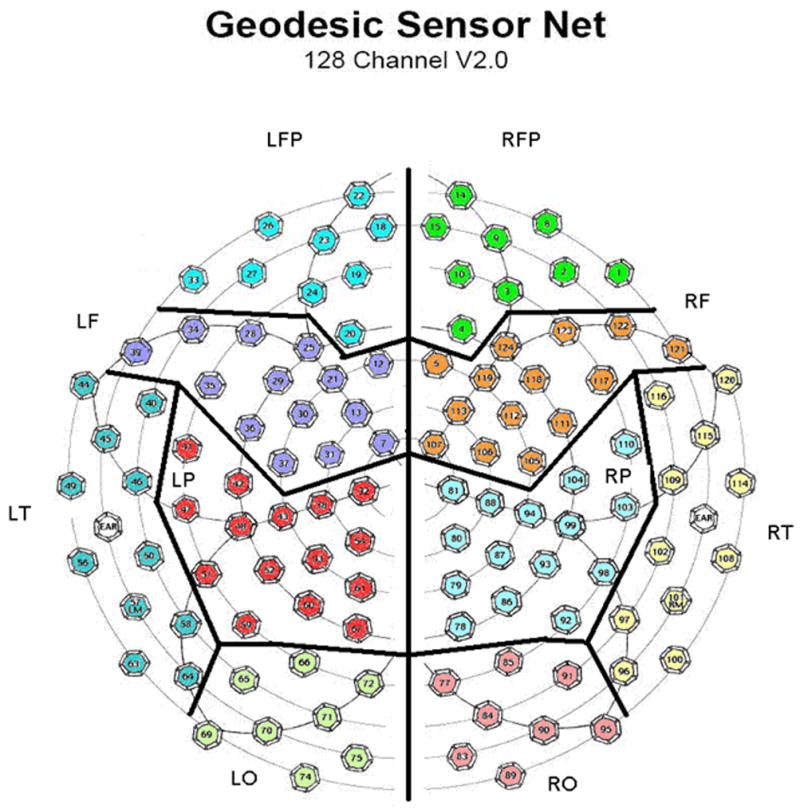
Numbered hexagons indicate electrode locations in the EEG sensor net (top down view, nose at top of page) and their assignment to brain regions. Electrodes on the midline between hemispheres are not assigned to any region and are excluded from the regional analyses. LFP= left frontal polar, RFP=right frontal polar, LF=left frontal, RF=right frontal, LT= left temporal, RT=right temporal, LP= left parietal, RP=right parietal, LO=left occipital, and RO=right occipital.
Regional measures were compared across the ELBW and term groups using Student’s t-test (two-tailed, two sample test with assumed unequal group variances) for all 6 frequency bands. The increased probability of false positive (Type 1) errors over these multiple simultaneous tests (60 for power and 42 for coherence) was controlled by selecting a per-test p-value significance threshold that ensured a False Discovery Rate of < 5% (Genovese et al., 2002; Liu et al., 2007; McMinn et al., 2005; Pawitan et al., 2005).
Results
The number of artifact-free, 30-sec EEG epochs (mean ±SD) analyzed was 11.1 ± 5.7 for the full term infants and 22.6 ± 18.4 epochs for the preterm infants out of a total number of epochs collected of 16.9 ± 12.1 for the full term infants and 54.7 ± 45.5 for the preterm infants. The mean percent of epochs rejected was greater for the ELBW infants (55%) than for the full term infants (29%) but because these infants were available to us for longer periods of time for data collection greater amounts of usable data resulted. Figures 2 and 3 show representative artifact-free 30-sec epochs of EEG data for an ELBW and a term infant, respectively. The data presented in these figures are for a subset of the 128 channels that correspond to leads placed in the International 10–20 montage and configured in the standard longitudinal bipolar (“double banana”) montage.
Figure 2.

Representative artifact-free 30-sec epoch of EEG data for an ELBW infant for a subset of the 128 channel data that correspond to leads placed in the International 10–20 montage and configured in the longitudinal bipolar montage.
Figure 3.

Representative artifact-free 30-sec epoch of EEG data for a full term infant for a subset of the 128 channel data that correspond to leads placed in the International 10–20 montage and configured in the longitudinal bipolar montage.
No significant differences between the term and preterm infants in mean EEG power were found in any region. However significant group differences were found for coherence measured between certain homologous hemispheric regions and between anterior – posterior regions in each hemisphere. For each infant group, the mean coherence between these regions is shown in Table 3. A separate t-test was performed for each of the 2 intrahemispheric and 5 interhemispheric regions for each of 6 frequency bands (totaling 42 tests) and significant differences at an overall false discovery rate < 5% are denoted by asterisks and shading. For the interhemispheric comparisons there were 2 significant findings. First, in the delta, theta, and alpha bands, between frontal polar regions, and in the delta band between parietal regions, coherence was significantly lower in ELBW group. In contrast, for the two highest frequency bands (low gamma and gamma), coherence across the occipital regions was significantly higher in ELBW than term infants. For the intrahemispheric comparisons between frontal polar to occipital regions there were again 2 significant findings. In both hemispheres coherence was significantly lower in ELBW than term infants in the delta, theta, and alpha bands. These data are depicted graphically in Figure 4 (interhemispheric coherence) and Figure 5 (intrahemispheric coherence).
TABLE 3.
For ELBW and full term (FT) infants mean magnitude of regional EEG spectral coherence and p-values (p) for two-sample t-tests of equality. Asterisks indicate significant group differences using an overall Type I error rate < 5%). Brain region labels are defined in the legend of Figure 1.
| Brain Region | Patient Group | Mean magnitude of coherence | |||||
|---|---|---|---|---|---|---|---|
| Delta | Theta | Alpha | Beta | Low gamma | Gamma | ||
| LFP-RFP | ELBW | 0.48 | 0.38 | 0.39 | 0.45 | 0.53 | 0.47 |
| FT | 0.60 | 0.50 | 0.52 | 0.54 | 0.55 | 0.45 | |
| p-value | 0.002* | 0.0007* | 0.003* | 0.18 | 0.90 | 0.83 | |
| LF-RF | ELBW | 0.34 | 0.34 | 0.31 | 0.32 | 0.44 | 0.42 |
| FT | 0.37 | 0.33 | 0.33 | 0.34 | 0.40 | 0.38 | |
| p-value | 0.23 | 0.72 | 0.43 | 0.54 | 0.57 | 0.64 | |
| LT-RT | ELBW | 0.34 | 0.35 | 0.36 | 0.46 | 0.64 | 0.62 |
| FT | 0.35 | 0.35 | 0.39 | 0.53 | 0.68 | 0.62 | |
| p-value | 0.62 | 0.93 | 0.23 | 0.10 | 0.60 | 0.99 | |
| LP-RP | ELBW | 0.35 | 0.36 | 0.34 | 0.35 | 0.44 | 0.43 |
| FT | 0.40 | 0.39 | 0.38 | 0.41 | 0.51 | 0.52 | |
| p-value | 0.004* | 0.17 | 0.27 | 0.42 | 0.25 | 0.21 | |
| LO-RO | ELBW | 0.54 | 0.50 | 0.52 | 0.61 | 0.77 | 0.76 |
| FT | 0.64 | 0.61 | 0.58 | 0.54 | 0.58 | 0.58 | |
| p-value | 0.02 | 0.02 | 0.13 | 0.26 | 0.003* | 0.005* | |
| LO-LFP | ELBW | 0.50 | 0.42 | 0.45 | 0.54 | 0.65 | 0.60 |
| FT | 0.59 | 0.54 | 0.56 | 0.58 | 0.59 | 0.51 | |
| p-value | 0.002* | 0.002* | 0.002* | 0.40 | 0.50 | 0.26 | |
| RO-RFP | ELBW | 0.51 | 0.45 | 0.46 | 0.53 | 0.64 | 0.58 |
| FT | 0.62 | 0.56 | 0.56 | 0.53 | 0.52 | 0.47 | |
| p-value | 0.0001* | 0.0006* | 0.003* | 0.97 | 0.14 | 0.18 | |
Figure 4.

Interhemispheric coherence in two brain regions. Mean + standard error of the coherence in frontal polar (left) and occipital (right) regions as a function of band center frequency for ELBW (x and dashed line) and full term (o and unbroken line).
Figure 5.

Intrahemispheric coherence. Mean + standard error of the coherence between left occipital and left frontal polar regions and right occipital and right frontal polar regions as a function of band center frequency for ELBW (x and dashed line) and full term (o and unbroken line) infants.
Discussion
We found that, at term equivalent age, ELBW infants with normal head ultrasound examination had significant differences in coherence as compared to term infants. At frequencies below 12 Hz, the ELBW coherence between the cerebral hemispheres was decreased in both the frontal polar and parietal regions. Decreased coherence was also observed when measured between anterior (frontal polar) and posterior (occipital) regions within each hemisphere. Conversely, the ELBW group had increased coherence at frequencies above 24 Hz when measured between the hemispheres in the occipital regions. However we did not observe significant differences in EEG power between the groups in any region. These results indicate that measures of EEG coherence are more sensitive markers of differences in the EEG of ELBW and term infants than are measures of EEG power. Further, as significant differences in EEG power were not observed between the groups, and as the coherence differences were observed only in certain regions, it is unlikely that the coherence group differences were the result of volume conduction artifact caused by group differences in EEG power or cranial anatomy.
The salient question remains: are the differences in coherence between ELBW and term infants a reflection of concomitant alterations in brain function? Taken together, the significant group differences in coherence but not in EEG power suggest that group differences in electrocortical function are most likely related to neural processes that connect (e.g. corticocortical fibers) or are common to (e.g. subcortical afferents) the brain regions (as quantified by EEG coherence) rather than to altered synchronous behavior of neurons in local neuronal pools within regions (as quantified by EEG power). Further, since cortical neurons form behavior-dependent oscillating networks, changes in brain function corresponding to altered coherence likely depend on the behavioral state of the subject (Leocani et al., 1999) and on the temporal frequency (Hz) at which coherence is computed (Buzsaki et al., 2004). To control for behavioral state, we have studied the infants at a set time after their feeding. Thus, in this study, all the subjects are in the active sleep state. Thus to deduce function from the EEG observations, it remains to consider the observed changes in coherence as they are related to temporal frequency.
Hypothesized alterations in brain function at frequencies below 12 Hz
We found coherence for these lower frequencies to be reduced in the ELBW group in certain regions. In human sleep, increased low frequency EEG power and synchrony are observed in the progression from wakefulness to slow wave sleep. During the process, thalamocortical neurons are hyperpolarized and there is a concomitant reduction in sensory input to the cortex. In response to this process, the low amplitude, high frequency, spatially differentiated EEG of wakefulness is replaced by a large amplitude, low frequency, spatially synchronous EEG waveform. This waveform is observed when cortical sensory input is reduced or eliminated and is seen both in sleep and in dementia (as a result of cortical deafferentation) (Destexhe et al., 2003; Leocani et al., 1999; Llinas et al., 2006; Spiegel et al., 2006; Steriade et al., 1993). Thus, decreased coherence at these lower frequencies in ELBW infants may be indicative of a lesser degree of reduction of sensory input to the cortex during sleep than that which occurs in term infants. This speculation is in keeping with our observations and others (Hoppenbrouwers et al., 2005; Scher et al., 2003) that ELBW infants appear to have more body movement during sleep. For example, the ELBW infants in our study had a larger percentage (55%) of data epochs rejected for movement artifact than did the term infants (29%).
Hypothesized alterations in brain function at frequencies above 24 Hz
We found the coherence for these higher frequencies to be increased in ELBW infants. Increased high frequency coherence is associated with cortical activation in response to a sensory stimulus (Grieve et al., 2007) while decreased high frequency coherence has been found in adults with dementia and attributed to reduced corticocortical neural connectivity (Leocani et al., 1999). It is interesting that high frequency coherence is increased in a region associated with primary visual function. ELBW infants are exposed to visual stimuli far in advance of term infants. It may be that ELBW infants exhibit precocious visual processing capability. The literature on visual evoked potentials in premature infants indicates that myelination of their visual neural pathways is not different at term equivalent age from that of term-born infants; however, the higher amplitude of the visual evoked potential observed in preterm infants could be interpreted as evidence for a higher degree of neural connectivity in their visual cortex (Tsuneishi et al., 2000; Tsuneishi et al., 1995).
Regional coherence differences and possible relationship to brain volume alterations
We also considered whether the regional differences in coherence observed could be a reflection of differences in brain anatomy. Recent magnetic resonance imaging studies have found regional anatomical differences between the brains of ELBW infants, at term equivalent age, and term infants. The studies measured reduced volumes of cortical grey matter and unmyelinated white matter in the parieto-occipital, sensorimotor, orbitofrontal and premotor cortices of ELBW infants (Inder et al., 2005; Peterson, 2003; Peterson et al., 2003; Thompson et al., 2006), and of subcortical grey matter including the thalamus, lentiform nucleus, and subgenual region (Boardman et al., 2006; Srinivasan et al., 2007) (Thompson et al., 2006). Further, these differences persisted over development and were related to perinatal risk factors such as sex, diffuse white matter injury, chronic lung disease, and intrauterine growth restriction and to neurodevelopmental outcome (Peterson et al., 2000). These volumetric findings in humans were corroborated by a study of the preterm baboon where, in the absence of prenatal potentiating factors such as hypoxia or infection, preterm birth was associated with a decrease in brain growth with greatest effect on cortical and subcortical gray matter volumes (Loeliger et al., 2006).
It is interesting that the regions where we observed decreased interhemispheric coherence (parietal and frontal polar cortices) and reduced intrahemispheric coherence (between frontal polar and occipital cortices) in ELBW infants are also the regions that magnetic resonance imaging studies found reduced cortical volumes. These regions of disturbed cortical anatomy may have faulty gating of sensory information may be faulty in these regions of disturbed cortical anatomy in ELBW infants and thus the cortical spatial synchrony characteristic of sleep may have delayed development. In the perinatal period the duration of active sleep decreases while the duration of quiet sleep increases. It is important to note that this normal pattern of development of sleep state organization is delayed in the earliest born premature infants (Hoppenbrouwers et al., 2005; Scher et al., 2003). Could this delay be the result of deficits in the gating of sensory input to the cortex as reflected by the reduced coherence found for these ELBW infants? In contrast, we did not find coherence differences that might be the result of the reduced subcortical grey matter volumes observed for ELBW infants in the MRI studies. It is likely that disturbances to these structures would produce global (rather than regional) alterations in coherence since they project to the entire cortex.
Finally, we also observed increased interhemispheric coherence between occipital cortices in ELBW infants at frequencies above 24 Hz. Occipital regions were not found to have altered volumes in the magnetic resonance imaging studies (Inder et al., 2005; Peterson, 2003; Peterson et al., 2003; Thompson et al., 2006); (Boardman et al., 2006; Srinivasan et al., 2007). Hence the increased coherence observed may be caused by precocious development of occipital cortical networks in the ELBW infants as a result of early exposure to visual stimuli.
Conclusion
In a normal intrauterine environment, brain development during the late second and early third trimesters is an orderly series of interrelated events including neuronal migration, glial cell proliferation, axonal and dendritic spine elaboration, synapse formation, myelination, programmed cell death, and stabilization of cortical connectivity (Rakic et al., 1983). When the environment in which the brain is developing is stressed by premature birth, the unfolding of this maturational program can be seriously disrupted in a regionally specific manner. The resultant changes in regional brain structure and function would presumably contribute to specific long-term cognitive, motor, behavioral, and emotional abnormalities in these children. The results of our study indicate a relationship between regional differences in coherence and brain anatomy however comprehensive research is needed to substantiate this concept.
For example, in this study EEG data were collected at term-equivalent age from hospitalized ELBW infants. This produced an inherent selection of sicker infants to the ELBW cohort because less ill infants were discharged before term equivalent age. Although we believe that the results of this study are representative of ELBW infants that remain in the hospital until term equivalent age they are not necessarily representative of infants discharged before term age. In subsequent studies we plan to collect EEG data from these infants as well by having them return to a research clinic at term-equivalent age.
Further, we anticipate future expanded studies that would include the acquisition of both brain structure from magnetic resonance imaging and functional connectivity from EEG in the same ELBW cohort. These data would address the limitations of this study and yield direct correlates of structure and function while tests of longitudinal neurodevelopment outcome would address issues relating brain function to behavioral and cognitive outcome.
This initial study provides the data necessary for the design of these future investigations.
Acknowledgments
This research was supported by the Department of Pediatrics, Division of Neonatology, Columbia University, the Sackler Institute, and by NIH grants HD032774, K25EB000266, K25NS052230, and 1 UL1 RR024156 (Irving Center for Clinical Research).
Footnotes
Publisher's Disclaimer: This is a PDF file of an unedited manuscript that has been accepted for publication. As a service to our customers we are providing this early version of the manuscript. The manuscript will undergo copyediting, typesetting, and review of the resulting proof before it is published in its final citable form. Please note that during the production process errors may be discovered which could affect the content, and all legal disclaimers that apply to the journal pertain.
References
- Bendat JS, Piersol AG. Random data : analysis and measurement procedures. 3. New York: Wiley; 2000. [Google Scholar]
- Boardman JP, Counsell SJ, Rueckert D, Kapellou O, Bhatia KK, Aljabar P, et al. Abnormal deep grey matter development following preterm birth detected using deformation-based morphometry. Neuroimage. 2006 Aug 1;32:70–8. doi: 10.1016/j.neuroimage.2006.03.029. [DOI] [PubMed] [Google Scholar]
- Buzsaki G, Draguhn A. Neuronal oscillations in cortical networks. Science. 2004 Jun 25;304:1926–9. doi: 10.1126/science.1099745. [DOI] [PubMed] [Google Scholar]
- Destexhe A, Sejnowski TJ. Interactions between membrane conductances underlying thalamocortical slow-wave oscillations. Physiological reviews. 2003 Oct;83:1401–53. doi: 10.1152/physrev.00012.2003. [DOI] [PMC free article] [PubMed] [Google Scholar]
- Duffy FH, Als H, McAnulty GB. Infant EEG spectral coherence data during quiet sleep: unrestricted principal components analysis--relation of factors to gestational age, medical risk, and neurobehavioral status. Clin Electroencephalogr. 2003 Apr;34:54–69. doi: 10.1177/155005940303400204. [DOI] [PubMed] [Google Scholar]
- Fanaroff AA, Stoll BJ, Wright LL, Carlo WA, Ehrenkranz RA, Stark AR, et al. Trends in neonatal morbidity and mortality for very low birthweight infants. American journal of obstetrics and gynecology. 2007 Feb;196:147 e1–8. doi: 10.1016/j.ajog.2006.09.014. [DOI] [PubMed] [Google Scholar]
- Ferrari F, Torricelli A, Giustardi A, Benatti A, Bolzani R, Ori L, et al. Bioelectric brain maturation in fullterm infants and in healthy and pathological preterm infants at term post-menstrual age. Early Hum Dev. 1992 Jan;28:37–63. doi: 10.1016/0378-3782(92)90006-3. [DOI] [PubMed] [Google Scholar]
- Fifer WP, Grieve PG, Grose-Fifer J, Isler JR, Byrd D. High-density electroencephalogram monitoring in the neonate. Clinics in perinatology. 2006 Sep;33:679–91. doi: 10.1016/j.clp.2006.06.011. vii. [DOI] [PubMed] [Google Scholar]
- Fingelkurts AA, Fingelkurts AA, Kahkonen S. Functional connectivity in the brain--is it an elusive concept? Neurosci Biobehav Rev. 2005 Jan;28:827–36. doi: 10.1016/j.neubiorev.2004.10.009. [DOI] [PubMed] [Google Scholar]
- Friston KJ, Frith CD, Fletcher P, Liddle PF, Frackowiak RS. Functional topography: multidimensional scaling and functional connectivity in the brain. Cereb Cortex. 1996 Mar–Apr;6:156–64. doi: 10.1093/cercor/6.2.156. [DOI] [PubMed] [Google Scholar]
- Furman L, Baley J, Borawski-Clark E, Aucott S, Hack M. Hospitalization as a measure of morbidity among very low birth weight infants with chronic lung disease. The Journal of pediatrics. 1996 Apr;128:447–52. doi: 10.1016/s0022-3476(96)70353-0. [DOI] [PubMed] [Google Scholar]
- Genovese CR, Lazar NA, Nichols T. Thresholding of statistical maps in functional neuroimaging using the false discovery rate. NeuroImage. 2002 Apr;15:870–8. doi: 10.1006/nimg.2001.1037. [DOI] [PubMed] [Google Scholar]
- Greischar LL, Burghy CA, van Reekum CM, Jackson DC, Pizzagalli DA, Mueller C, et al. Effects of electrode density and electrolyte spreading in dense array electroencephalographic recording. Clin Neurophysiol. 2004 Mar;115:710–20. doi: 10.1016/j.clinph.2003.10.028. [DOI] [PubMed] [Google Scholar]
- Grieve PG, Emerson RG, Fifer WP, Isler JR, Stark RI. Spatial correlation of the infant and adult electroencephalogram. Clin Neurophysiol. 2003 Sep;114:1594–608. doi: 10.1016/s1388-2457(03)00122-6. [DOI] [PubMed] [Google Scholar]
- Grieve PG, Myers MM, Stark RI, Housman S, Fifer WP. Topographic localization of electrocortical activation in newborn and two- to four-month-old infants in response to head-up tilting. Acta Paediatr. 2005 Dec;94:1756–63. doi: 10.1111/j.1651-2227.2005.tb01850.x. [DOI] [PubMed] [Google Scholar]
- Grieve PG, Stark RI, Isler JR, Housman SL, Fifer WP, Myers MM. Electrocortical functional connectivity in infancy: response to body tilt. Pediatr Neurol. 2007 Aug;37:91–8. doi: 10.1016/j.pediatrneurol.2007.04.004. [DOI] [PubMed] [Google Scholar]
- Grigg-Damberger M, Gozal D, Marcus CL, Quan SF, Rosen CL, Chervin RD, et al. The visual scoring of sleep and arousal in infants and children. J Clin Sleep Med. 2007 Mar 15;3:201–40. [PubMed] [Google Scholar]
- Hall A, McLeod A, Counsell C, Thomson L, Mutch L. School attainment, cognitive ability and motor function in a total Scottish very-low-birthweight population at eight years: a controlled study. Dev Med Child Neurol. 1995 Dec;37:1037–50. doi: 10.1111/j.1469-8749.1995.tb11965.x. [DOI] [PubMed] [Google Scholar]
- Harper RM, Hoppenbrouwers T, Bannett D, Hodgeman J, Sterman MB, McGinty DJ. Effects of feeding on state and cardiac regulation in the infant. Dev Psychobiol. 1977 Nov;10:507–17. doi: 10.1002/dev.420100604. [DOI] [PubMed] [Google Scholar]
- Hoppenbrouwers T, Hodgman JE, Rybine D, Fabrikant G, Corwin M, Crowell D, et al. Sleep architecture in term and preterm infants beyond the neonatal period: the influence of gestational age, steroids, and ventilatory support. Sleep. 2005 Nov 1;28:1428–36. doi: 10.1093/sleep/28.11.1428. [DOI] [PubMed] [Google Scholar]
- Horwitz B. The elusive concept of brain connectivity. NeuroImage. 2003 Jun;19:466–70. doi: 10.1016/s1053-8119(03)00112-5. [DOI] [PubMed] [Google Scholar]
- Hubel DH, Wiesel TN. Receptive Fields of Cells in Striate Cortex of Very Young, Visually Inexperienced Kittens. J Neurophysiol. 1963 Nov;26:994–1002. doi: 10.1152/jn.1963.26.6.994. [DOI] [PubMed] [Google Scholar]
- Ichiki M, Kunugi H, Takei N, Murray RM, Baba H, Arai H, et al. Intrauterine physical growth in schizophrenia: evidence confirming excess of premature birth. Psychological medicine. 2000 May;30:597–604. doi: 10.1017/s003329179900210x. [DOI] [PubMed] [Google Scholar]
- Inder TE, Warfield SK, Wang H, Huppi PS, Volpe JJ. Abnormal cerebral structure is present at term in premature infants. Pediatrics. 2005 Feb;115:286–94. doi: 10.1542/peds.2004-0326. [DOI] [PubMed] [Google Scholar]
- Junghofer M, Elbert T, Tucker DM, Braun C. The polar average reference effect: a bias in estimating the head surface integral in EEG recording. Clin Neurophysiol. 1999 Jun;110:1149–55. doi: 10.1016/s1388-2457(99)00044-9. [DOI] [PubMed] [Google Scholar]
- Koenig T, Studer D, Hubl D, Melie L, Strik WK. Brain connectivity at different time-scales measured with EEG. Philos Trans R Soc Lond B Biol Sci. 2005 May 29;360:1015–23. doi: 10.1098/rstb.2005.1649. [DOI] [PMC free article] [PubMed] [Google Scholar]
- Laptook AR, O’Shea TM, Shankaran S, Bhaskar B. Adverse neurodevelopmental outcomes among extremely low birth weight infants with a normal head ultrasound: prevalence and antecedents. Pediatrics. 2005 Mar;115:673–80. doi: 10.1542/peds.2004-0667. [DOI] [PubMed] [Google Scholar]
- Leocani L, Comi G. EEG coherence in pathological conditions. J Clin Neurophysiol. 1999 Nov;16:548–55. doi: 10.1097/00004691-199911000-00006. [DOI] [PubMed] [Google Scholar]
- Liu P, Gene Hwang JT. Quick Calculation for Sample Size while Controlling False Discovery Rate with Application to Microarray Analysis. Bioinformatics. 2007 Jan 19; doi: 10.1093/bioinformatics/btl664. [DOI] [PubMed] [Google Scholar]
- Llinas RR, Steriade M. Bursting of thalamic neurons and states of vigilance. J Neurophysiol. 2006 Jun;95:3297–308. doi: 10.1152/jn.00166.2006. [DOI] [PubMed] [Google Scholar]
- Loeliger M, Inder T, Cain S, Ramesh RC, Camm E, Thomson MA, et al. Cerebral outcomes in a preterm baboon model of early versus delayed nasal continuous positive airway pressure. Pediatrics. 2006 Oct;118:1640–53. doi: 10.1542/peds.2006-0653. [DOI] [PubMed] [Google Scholar]
- Marmarelis PMV. Analysis of Physiological Systems. New York: Plenum Press; 1978. pp. 98–101. [Google Scholar]
- Martin JA, Kochanek KD, Strobino DM, Guyer B, MacDorman MF. Annual summary of vital statistics--2003. Pediatrics. 2005 Mar;115:619–34. doi: 10.1542/peds.2004-2695. [DOI] [PubMed] [Google Scholar]
- McEwen BS. Plasticity of the hippocampus: adaptation to chronic stress and allostatic load. Ann N Y Acad Sci. 2001 Mar;933:265–77. doi: 10.1111/j.1749-6632.2001.tb05830.x. [DOI] [PubMed] [Google Scholar]
- McMinn J, Wei M, Schupf N, Cusmai J, Johnson EB, Smith AC, et al. Unbalanced Placental Expression of Imprinted Genes in Human Intrauterine Growth Restriction. Placenta. 2005 Aug 23; doi: 10.1016/j.placenta.2005.07.004. [DOI] [PubMed] [Google Scholar]
- Mizrahi EM, Kellaway P. Characterization and classification of neonatal seizures. Neurology. 1987 Dec;37:1837–44. doi: 10.1212/wnl.37.12.1837. [DOI] [PubMed] [Google Scholar]
- Mower GD, Burchfiel JL, Duffy FH. Animal models of strabismic amblyopia: physiological studies of visual cortex and the lateral geniculate nucleus. Brain research. 1982 Nov;281:311–27. doi: 10.1016/0165-3806(82)90130-4. [DOI] [PubMed] [Google Scholar]
- Myers MM, Fifer WP, Grose-Fifer J, Sahni R, Stark RI, Schulze KF. A novel quantitative measure of Trace-alternant EEG activity and its association with sleep states of preterm infants. Dev Psychobiol. 1997;31:167–74. doi: 10.1002/(sici)1098-2302(199711)31:3<167::aid-dev1>3.0.co;2-q. [DOI] [PubMed] [Google Scholar]
- Nunes ML, Da Costa JC, Moura-Ribeiro MV. Polysomnographic quantification of bioelectrical maturation in preterm and fullterm newborns at matched conceptional ages. Electroencephalogr Clin Neurophysiol. 1997 Mar;102:186–91. doi: 10.1016/s0013-4694(96)95191-7. [DOI] [PubMed] [Google Scholar]
- Nunez P. Electric Fields of the Brain. New York, Oxford: Oxford University Press; 1981. pp. 218–22. [Google Scholar]
- Nunez PL, Srinivasan R, Westdorp AF, Wijesinghe RS, Tucker DM, Silberstein RB, et al. EEG coherency. I: Statistics, reference electrode, volume conduction, Laplacians, cortical imaging, and interpretation at multiple scales. Electroencephalogr Clin Neurophysiol. 1997 Nov;103:499–515. doi: 10.1016/s0013-4694(97)00066-7. [DOI] [PubMed] [Google Scholar]
- Nunez PL, Silberstein RB, Shi Z, Carpenter MR, Srinivasan R, Tucker DM, et al. EEG coherency II: experimental comparisons of multiple measures. Clin Neurophysiol. 1999 Mar;110:469–86. doi: 10.1016/s1388-2457(98)00043-1. [DOI] [PubMed] [Google Scholar]
- Pawitan Y, Michiels S, Koscielny S, Gusnanto A, Ploner A. False discovery rate, sensitivity and sample size for microarray studies. Bioinformatics. 2005 Jul 1;21:3017–24. doi: 10.1093/bioinformatics/bti448. [DOI] [PubMed] [Google Scholar]
- Pedley TATR. Physiological Basis of the EEG. In: Daly DDPT, editor. Current Practice of Clinical Electroencephalography. New York: Lippincott Williams & Wilkins; 1997. pp. 107–38. [Google Scholar]
- Peterson BS, Vohr B, Staib LH, Cannistraci CJ, Dolberg A, Schneider KC, et al. Regional brain volume abnormalities and long-term cognitive outcome in preterm infants. Jama. 2000 Oct 18;284:1939–47. doi: 10.1001/jama.284.15.1939. [DOI] [PubMed] [Google Scholar]
- Peterson BS. Brain imaging studies of the anatomical and functional consequences of preterm birth for human brain development. Ann N Y Acad Sci. 2003 Dec;1008:219–37. doi: 10.1196/annals.1301.023. [DOI] [PubMed] [Google Scholar]
- Peterson BS, Anderson AW, Ehrenkranz R, Staib LH, Tageldin M, Colson E, et al. Regional brain volumes and their later neurodevelopmental correlates in term and preterm infants. Pediatrics. 2003 May;111:939–48. doi: 10.1542/peds.111.5.939. [DOI] [PubMed] [Google Scholar]
- Pham K, Nacher J, Hof PR, McEwen BS. Repeated restraint stress suppresses neurogenesis and induces biphasic PSA-NCAM expression in the adult rat dentate gyrus. Eur J Neurosci. 2003 Feb;17:879–86. doi: 10.1046/j.1460-9568.2003.02513.x. [DOI] [PubMed] [Google Scholar]
- Piecuch RE, Leonard CH, Cooper BA, Kilpatrick SJ, Schlueter MA, Sola A. Outcome of infants born at 24–26 weeks’ gestation: II. Neurodevelopmental outcome. Obstetrics and gynecology. 1997 Nov;90:809–14. doi: 10.1016/S0029-7844(97)00429-8. [DOI] [PubMed] [Google Scholar]
- Rakic P, Riley KP. Overproduction and elimination of retinal axons in the fetal rhesus monkey. Science. 1983 Mar 25;219:1441–4. doi: 10.1126/science.6828871. [DOI] [PubMed] [Google Scholar]
- Sahni R, Schulze KF, Stefanski M, Myers MM, Fifer WP. Methodological issues in coding sleep states in immature infants. Dev Psychobiol. 1995;28:85–101. doi: 10.1002/dev.420280203. [DOI] [PubMed] [Google Scholar]
- Sahni R, Saluja D, Schulze KF, Kashyap S, Ohira-Kist K, Fifer WP, et al. Quality of diet, body position, and time after feeding influence behavioral states in low birth weight infants. Pediatric research. 2002 Sep;52:399–404. doi: 10.1203/00006450-200209000-00016. [DOI] [PubMed] [Google Scholar]
- Sahni R, Fifer WP, Myers MM. Identifying infants at risk for sudden infant death syndrome. Current opinion in pediatrics. 2007 Apr;19:145–9. doi: 10.1097/MOP.0b013e32808373b6. [DOI] [PubMed] [Google Scholar]
- Saigal S. Follow-up of very low birthweight babies to adolescence. Semin Neonatol. 2000 May;5:107–18. doi: 10.1053/siny.1999.0003. [DOI] [PubMed] [Google Scholar]
- Salek-Haddadi A, Friston KJ, Lemieux L, Fish DR. Studying spontaneous EEG activity with fMRI. Brain Res Brain Res Rev. 2003 Sep;43:110–33. doi: 10.1016/s0165-0173(03)00193-0. [DOI] [PubMed] [Google Scholar]
- Scher MS, Sun M, Steppe DA, Guthrie RD, Sclabassi RJ. Comparisons of EEG spectral and correlation measures between healthy term and preterm infants. Pediatr Neurol. 1994 Mar;10:104–8. doi: 10.1016/0887-8994(94)90041-8. [DOI] [PubMed] [Google Scholar]
- Scher MS, Steppe DA, Banks DL. Prediction of lower developmental performances of healthy neonates by neonatal EEG-sleep measures. Pediatr Neurol. 1996 Feb;14:137–44. doi: 10.1016/0887-8994(96)00013-6. [DOI] [PubMed] [Google Scholar]
- Scher MS, Steppe DA, Sclabassi RJ, Banks DL. Regional differences in spectral EEG measures between healthy term and preterm infants. Pediatr Neurol. 1997 Oct;17:218–23. doi: 10.1016/s0887-8994(97)00101-x. [DOI] [PubMed] [Google Scholar]
- Scher MS, Jones BL, Steppe DA, Cork DL, Seltman HJ, Banks DL. Functional brain maturation in neonates as measured by EEG-sleep analyses. Clin Neurophysiol. 2003 May;114:875–82. doi: 10.1016/s1388-2457(03)00026-9. [DOI] [PubMed] [Google Scholar]
- Spiegel A, Tonner PH, Renna M. Altered states of consciousness: processed EEG in mental disease. Best practice & research. 2006 Mar;20:57–67. doi: 10.1016/j.bpa.2005.07.010. [DOI] [PubMed] [Google Scholar]
- Sporns O, Chialvo DR, Kaiser M, Hilgetag CC. Organization, development and function of complex brain networks. Trends Cogn Sci. 2004 Sep;8:418–25. doi: 10.1016/j.tics.2004.07.008. [DOI] [PubMed] [Google Scholar]
- Srinivasan L, Dutta R, Counsell SJ, Allsop JM, Boardman JP, Rutherford MA, et al. Quantification of deep gray matter in preterm infants at term-equivalent age using manual volumetry of 3-tesla magnetic resonance images. Pediatrics. 2007 Apr;119:759–65. doi: 10.1542/peds.2006-2508. [DOI] [PubMed] [Google Scholar]
- Srinivasan R, Nunez PL, Silberstein RB. Spatial filtering and neocortical dynamics: estimates of EEG coherence. IEEE Trans Biomed Eng. 1998 Jul;45:814–26. doi: 10.1109/10.686789. [DOI] [PubMed] [Google Scholar]
- Stam CJ. Functional connectivity patterns of human magnetoencephalographic recordings: a ‘small-world’ network? Neurosci Lett. 2004 Jan 23;355:25–8. doi: 10.1016/j.neulet.2003.10.063. [DOI] [PubMed] [Google Scholar]
- Stefanski M, Schulze K, Bateman D, Kairam R, Pedley TA, Masterson J, et al. A scoring system for states of sleep and wakefulness in term and preterm infants. Pediatric research. 1984;18:58–62. [PubMed] [Google Scholar]
- Steriade M, McCormick DA, Sejnowski TJ. Thalamocortical oscillations in the sleeping and aroused brain. Science. 1993 Oct 29;262:679–85. doi: 10.1126/science.8235588. [DOI] [PubMed] [Google Scholar]
- Stewart A, Kirkbride V. Very preterm infants at fourteen years: relationship with neonatal ultrasound brain scans and neurodevelopmental status at one year. Acta Paediatr Suppl. 1996 Oct;416:44–7. doi: 10.1111/j.1651-2227.1996.tb14276.x. [DOI] [PubMed] [Google Scholar]
- Sykes DH, Hoy EA, Bill JM, McClure BG, Halliday HL, Reid MM. Behavioural adjustment in school of very low birthweight children. Journal of child psychology and psychiatry, and allied disciplines. 1997 Mar;38:315–25. doi: 10.1111/j.1469-7610.1997.tb01516.x. [DOI] [PubMed] [Google Scholar]
- Thompson DK, Warfield SK, Carlin JB, Pavlovic M, Wang HX, Bear M, et al. Brain. 2006. Sep 28, Perinatal risk factors altering regional brain structure in the preterm infant. [DOI] [PubMed] [Google Scholar]
- Tsuneishi S, Casaer P, Fock JM, Hirano S. Establishment of normal values for flash visual evoked potentials (VEPs) in preterm infants: a longitudinal study with special reference to two components of the N1 wave. Electroencephalogr Clin Neurophysiol. 1995 Jul;96:291–9. doi: 10.1016/0168-5597(95)00031-m. [DOI] [PubMed] [Google Scholar]
- Tsuneishi S, Casaer P. Effects of preterm extrauterine visual experience on the development of the human visual system: a flash VEP study. Dev Med Child Neurol. 2000 Oct;42:663–8. doi: 10.1017/s0012162200001225. [DOI] [PubMed] [Google Scholar]
- Valdes-Sosa PA, Kotter R, Friston KJ. Introduction: multimodal neuroimaging of brain connectivity. Philos Trans R Soc Lond B Biol Sci. 2005 May 29;360:865–7. doi: 10.1098/rstb.2005.1655. [DOI] [PMC free article] [PubMed] [Google Scholar]
- Whitaker AH, Van Rossem R, Feldman JF, Schonfeld IS, Pinto-Martin JA, Tore C, et al. Psychiatric outcomes in low-birth-weight children at age 6 years: relation to neonatal cranial ultrasound abnormalities. Archives of general psychiatry. 1997 Sep;54:847–56. doi: 10.1001/archpsyc.1997.01830210091012. [DOI] [PubMed] [Google Scholar]
- Wiesel TN, Hubel DH. Comparison of the effects of unilateral and bilateral eye closure on cortical unit responses in kittens. J Neurophysiol. 1965 Nov;28:1029–40. doi: 10.1152/jn.1965.28.6.1029. [DOI] [PubMed] [Google Scholar]