

Abstract
An array of 33 prototype polypeptides was examined as putative contrast agents that can be distinguished from each other based on the Chemical Exchange Saturation Transfer (CEST) mechanism. These peptides were chosen based on predictions of the chemical exchange rates of exchangeable amide, amine, and hydroxyl protons that produce this contrast, and tested at 11.7T for their CEST suitability. Artificial colors were assigned to particular amino acid units (lysine, arginine, threonine or serine) based on the separate resonance frequencies of these exchangeable protons. The magnitude of the CEST effect could be fine-tuned by altering the amino acid sequence, and these three exchangeable groups could be distinguished in an MR phantom based on their different chemical shifts (“colors”). These new DIACEST agents possess a wide range of electrostatic charges, compositions, and protein stabilities in vivo, making them potentially suitable for a variety of biological applications such as designing MR reporter genes for imaging cells and distinguishing multiple targets within the same MR image.
Keywords: CEST, chemical exchange rates, saturation transfer, contrast agents, MRI, peptides
Introduction
Recently, there has been interest in the design of so-called Chemical Exchange Saturation Transfer (CEST) (1-4) agents because of their unique MR properties. These compounds contain pools of exchangeable protons that can be selectively saturated using radiofrequency irradiation, the effect of which on the bulk water can be imaged using MRI. Several groups (5-9) have used paramagnetic metals to shift the proton frequency of solute protons or water pools, which has been termed paramagnetic CEST (PARACEST). For non-paramagnetic (DIACEST) agents, contrast has been obtained using amide protons in proteins (10,11), imino protons in nucleic acids (12) and OH protons in sugars such as glycogen (1,13). When using amide protons in polypeptides such as Poly-L-Lysine (PLK), contrast enhancements by factors as large as 500,000 could be achieved due to the presence of a large concentration of rapidly exchangeable amide protons (exchange rate, kex,∼400 Hz) per molecular weight unit (e.g. 4.78 amide protons/kD for PLK) (11). This capability was recently exploited to design the first non-paramagnetic MR reporter gene in vivo, by engineering xenografted mammalian brain tumor cells to express an artificial Lysine-Rich Protein (LRP) (14).
Here we describe an approach that can be considered the MR analogue of optical imaging of marker proteins, by designing a series of peptide sequences for which CEST contrast is distinguishable due to the different resonance frequencies of their exchangeable protons. This saturation frequency dependence can be viewed as imparting a “color” to each peptide, similar to the way green fluorescent protein (GFP) and red fluorescent protein (RFP) are distinguishable through appropriate excitation wavelengths, although different in the sense that this “color” is not in the visual part of the spectrum. We show that three peptides: Poly-L-Arginine (PLR), PLK, and Poly-L-Threonine (PLT) can be differentiated using CEST MR imaging, and that derivative amino acid sequences display the same “label” characteristics. For clarity we use here the standard one letter abbreviations for each amino acid.
We demonstrate the feasibility of constructing a large family of similar peptide-based CEST compounds with each variant having different exchange properties based on different charge and stability of the peptides. Through further screening of peptide libraries using the approach we outline in this paper, peptide sequences with improved in vivo imaging characteristics are expected to be found while retaining their “color” characteristics, similar to the evolution of fluorescent proteins(15).
Theory
CEST contrast increases exponentially with the exchange rate (10), which will vary with the chemical groups surrounding the exchangeable protons. Fig [1] shows several representative derivatives of the three labels, NH: KGKG (1a), arginine's guanidyl NH2 (gNH2): HRHR (1b), and OH: DTDT (1c). In order to determine which peptides would be synthesized and tested, backbone NH exchange rates were predicted based on the neighbors to the left (l) and right (r) using the combined base-catalyzed and acid-catalyzed equation (16) :
| [1] |
where kA,ref,= 1.83 M/s, kB,ref = 3.82 x10⁸ M/s, and kW,ref = 5.27 x10⁻⁴ M/s are the acid, base and water rate constants for the appropriate reference (16) and A and B are the acid and base rate factors, respectively, listed in Table 1. These numbers take into account effects such as steric hindrance by sidechains and also presence of additional exchangeable protons. This equation is valid for backbone amide protons (NH). The temperature dependence of these rates is: (17)
| [2] |
with T being the absolute temperature and Ea the activation energy (14, 17, 19 kcal mol−1 for kA, kB, kW, respectively); R = 1.987 kcal mol−1K−1. The general rule coming from these expressions is that smaller (S, G) or basic (K, R) side chain protons speed up exchange while larger or acidic side chains (D, E) reduce this rate.
Figure 1.

Chemical structure of three CEST peptides with arrows denoting chemical exchange between neighboring protons. A) Gly Lys Gly Lys peptide. B) His Arg His Arg peptide. C) Asp Thr Asp Thr peptide.
Table 1.
Acid and Base rate factors (A, B) reflecting catalysis effects of amino acid side chains on the proton exchange rates of neighboring peptides from ref. (16)
| Acid catalysis | Base catalysis | |||
|---|---|---|---|---|
| Side chain | A1 | Ar | B1 | Br |
| R | 0.26 | 0.48 | 1.2 | 1.66 |
| D | 7.94 | 3.80 | 0.50 | 0.66 |
| E | 0.13 | 2.04 | 0.31 | 0.71 |
| G | 0.6 | 1.66 | 1.86 | 1.48 |
| H | - | - | 0.79 | 1.38 |
| K | 0.28 | 0.51 | 0.91 | 1.32 |
| S | 0.36 | 0.41 | 2.34 | 2.0 |
| T | 0.16 | 0.34 | 0.85 | 1.58 |
The contrast produced by CEST agents can be described using the Bloch equations with exchange terms (3,18-24). The number of Bloch equations needed depends on the number of exchangeable protons, or “pools”. For the polypeptides listed, two to four pool models would be required to simulate the data, with the majority of the peptides requiring three pools, two solute pools ‘a’ and ‘b’ and a third water pool ‘w’. The three pool Bloch equations are linear and can be written in a general format which can be solved numerically using Matlab's (The MathWorks Inc., Natick, MA) built-in functions of matrix left division and matrix power as described by Woessner et al.(23). The equations are :
| [3] |
Here, , and are the chemical shift differences between the saturation pulse and solute or water proton resonance frequencies, respectively; M0a, M0b, M0w are the equilibrium magnetizations; ω1 is the nutation rate of the RF irradiation; Proton exchange between the three pools occurs with rates kaw (solute a -> water), and kwa (water -> solute a), etc., with kawMoa = kwaMow at equilibrium based on mass balance. R1a, R2a, are the relaxation rates for proton ‘a’, with similar definitions applying to both ‘b’ and ‘w’ spins. In addition, r1a= R1a +kaw+kab and r2a= R2a+kaw+kab. Eqn [1] can be used to simulate the effects of RF irradiation at a given frequency offset and duration on the water magnetization, Mzw. For two pools, the equations and variables involving the ‘b’ protons are removed.
Using the direct proportionality between magnetization and signal, we can then directly relate the asymmetry in the magnetization transfer ratio (MTRasym) with respect to the water frequency to the proton transfer rate (PTR) or CEST contrast using the following expression:
| [4] |
in which S0 and are, respectively, the water signals without saturation and with saturation at ±Δωsw from bulk water. The experimental proton transfer enhancement (PTE) for a given exchangeable group on a peptide is defined by the following equation:
| [5] |
Using PTE instead of MTRasym allows the sensitivity of each agent to be compared independent of concentration to 1st order.
Materials and Methods
Sample Preparation
PLK (13.8 kD), PLT (7.6 kD), PLR (45.7 kD), and protamine from salmon were purchased from Sigma-Aldrich (St. Louis, MO). The twelve residue polypeptides listed in Table 2 were purchased from Bio S&T Inc. (Montreal, Quebec) and Sigma Genosys (The Woodlands, TX). For these samples, 2.5 mg/mL was dissolved in 10 mM phosphate buffered saline (PBS) and titrated to pH 7.3. The ratio of amide protons to water protons was determined from the NMR spectra using the integral ratio of Hε to the H2O peak for peptides containing lysine. For peptides that contained arginine, the ratio was measured using the Hδ peak, for peptides containing threonine the ratio was measured using Hγ , and for the aspartate containing serine peptides, the ratio was measured using the aspartate Hβ . The ratio of amide protons to water was used to determine the molar concentration of peptide in solution. PTE was calculated according to Eq. [5] using the molar peptide concentration and the measured MTRasym for Table 2. In addition, an imaging phantom was constructed from separate PLT, PLK and PLR solutions. For this, PLT, PLK and PLR were dissolved in PBS at concentrations of 20 mg/mL (PLT), 5 mg/mL (PLK) and 2 mg/mL (PLR). We used these relative concentrations to equalize the contrast for the polypeptides. The PLK, PLR and PLT solutions were titrated to pH 7.3 and placed in 1 mm capillary tubes, which were then inserted into a 5 mm NMR tube.
Table 2.
Experimental sensitivities and predicted properties of different versions of NH, gNH2 and OH colors
| Polypeptide |
Charge |
Theor. pI |
Avg. MW/Am.Acid |
Instab. Index |
1/2 life (hr) |
Pred. PTE NH/1000 |
Exp. PTE NH/1000 |
Exp PTE gNH2/1000 |
Exp PTE OH/1000 |
|---|---|---|---|---|---|---|---|---|---|
| K12 | 12 | 11.04 | 128.5 | 9.4 | 1.3 | 16.9 | 12.5 | - | - |
| (KS)6 | 6 | 10.7 | 109.1 | 9.3 | 1.3 | 11.3 | 17.0 | - | - |
| (KH)6 | 6 | 10.7 | 134.1 | 107.8 | 1.3 | 9.8 | 12.7 | - | - |
| (KG)6 | 6 | 10.7 | 94.1 | −68.7 | 1.3 | 13.8 | 10.8 | - | - |
| (KSS)4 | 4 | 10.48 | 102.2 | 73.4 | 1.3 | 18.1 | 13.2 | - | - |
| (KGG)4 | 4 | 10.48 | 82.2 | 0.8 | 1.3 | 15.1 | 11.8 | - | - |
| (KSSS)3 | 3 | 10.3 | 98.8 | 105.5 | 1.3 | 18.7 | 13.0 | - | - |
| (KGGG)3 | 3 | 10.3 | 76.3 | 35.5 | 1.3 | 10.7 | 12.1 | - | - |
| LRP |
9.31 |
12.0 |
122.1 |
13.9 |
302 |
- |
- |
- |
- |
| R12 | 12 | 13.04 | 156.5 | 534.2 | 1 | 17.5 | 22.0 | 47.1 | - |
| (RS)6 | 6 | 12.7 | 123.0 | 309.1 | 1 | 16.9 | 12.8 | 21.4 | - |
| (RG)6 | 6 | 12.7 | 108.1 | −33.3 | 1 | 16.4 | 17.2 | 31.3 | - |
| (RH)6 | 6 | 12.7 | 148.2 | 105.5 | 1 | 11.9 | 5.5 | 10.0 | - |
| (RT)6 | 6 | 12.7 | 130.1 | 9.2 | 1 | - | 18.7 | 36.2 | - |
| (RTT)4 | 4 | 12.48 | 121.0 | 9.2 | 1 | - | 16.3 | 30.4 | - |
| (RTTT)3 | 3 | 12.3 | 116.3 | 9.2 | 1 | - | 18.9 | 28.5 | - |
| Salm. Protam. |
7.91 |
13.3 |
132.2 |
330.5 |
>20 |
- |
19.0 |
38.41 |
- |
| T12 | 0 | 5.19 | 102.6 | 9.2 | 7.2 | - | 6.5 | - | 3.0 |
| (TK)6 | 6 | 10.7 | 116.2 | 9.2 | 7.2 | - | 14.1 | - | 4.5 |
| (DT)6 | −6 | 3.17 | 109.6 | −65.98 | 1.1 | - | 2.2 | - | 2.9 |
| (ET)6 | −6 | 3.46 | 116.6 | 89.42 | 1 | - | 1.7 | - | 3.4 |
| (TTK)4 | 4 | 10.48 | 111.6 | 9.2 | 7.2 | - | 12.6 | - | 4.0 |
| (DTT)4 | −4 | 3.32 | 107.2 | −40.93 | 1.1 | - | 4.0 | - | 4.6 |
| (ETT)4 | −4 | 3.58 | 111.9 | 57.32 | 1 | - | 4.4 | - | 7.6 |
| (TTTK)3 | 3 | 10.3 | 109.3 | 9.2 | 7.2 | - | 13.8 | - | 4.8 |
| (DTTT)3 | −3 | 3.42 | 106.1 | −28.41 | 1.1 | - | 4.0 | - | 5.5 |
| (ETTT)3 | −3 | 3.67 | 109.6 | 41.27 | 1 | - | 4.0 | - | 6.3 |
| (TTTTTK)2 | 2 | 10.0 | 107.1 | 9.2 | 7.2 | - | 13.8 | - | 6.7 |
| (DTTTTT)2 | −2 | 3.56 | 104.9 | −15.88 | 1.1 | - | 7.2 | - | 6.7 |
| (ETTTTT)2 |
−2 |
3.8 |
107.2 |
25.22 |
1 |
- |
5.9 |
- |
6.4 |
| (DS)6 | −6 | 3.17 | 102.6 | 105.5 | 1.1 | - | 2.5 | - | 3.4 |
| (DSSS)3 | −3 | 3.42 | 97.9 | 137.6 | 1.1 | - | 7.0 | - | 5.2 |
| (DSSSSS)2 | −2 | 3.56 | 93.2 | 169.7 | 1.1 | - | 9.1 | - | 5.2 |
Normalized charge for 12 residue peptide from 32 and 200 residue proteins
This includes the methionine N- terminal residue. If this is removed, the 1/2 life becomes 1.3 hr.
Amino acid abbreviations: K = lysine, S = Serine, H = Histidine, G = Glycine, R = Arginine, T = Threonine, E = Glutamate, D = aspartate
MR Experiments
All NMR data were collected at 310K using an 11.7T Bruker Avance system equipped with a triple-channel, triple-axis gradient high-resolution NMR probe. Z-spectra (relative water saturation SΔω/S0 as a function of saturation frequency) were acquired with the saturation transfer sequence consisting of a saturation pulse with variable offset, power (B1) and duration (tsat) followed by spin echo acquisition with radiofrequency pulses centered on the water resonance, which was arbitrarily assigned to 0 ppm. Z-spectra were acquired using B1 = 4.7μT, tsat =10s, and steps of 0.2 ppm from +5ppm to −5ppm from water. This power previously was shown to provide good exchange measurements (25). To display the frequency-dependent contrast as a positive parameter, z-spectra were processed using MTRasym analysis with respect to the water frequency using Eqn. [4]. For PLK, PLR and PLT, the three main polypeptides, we also collected MTRasym data at 1.1, 2.2 and 3.3μT to determine contrast-to-noise ratio (CNR) as a function of saturation field strength.
All MR images were acquired with a 5 mm Micro 5.0 micro-imaging probe using the same 11.7T Bruker Avance System. Images were collected using a 4 s continuous wave (cw) pre-saturation pulse followed by a multi-echo MRI pulse sequence. The center of k-space was sampled on the 2nd echo with an effective TE= 11 ms.
PTE predictions
For all peptides, the chemical exchange rates were predicted using Eq. [1], and then the PTE's were calculated using Eq. [4] and [5] at the concentrations of agents measured, using numerical simulations of the two or three pool Bloch equations (25). The solute and solvent relaxation parameters determined previously for PLK were assumed to be valid for all peptides (25), which were: R1w = 0.248 Hz, R2w = 0.6 s−1, R1a = R1b = 0.71Hz and R2a =R2b= 39 s−1. In addition, for the arginine peptides, the intrasolute proton exchange rate, kab, was assumed to be 10Hz for simplicity. This exchange rate affects only the ratio of saturation transfer between the NH and gNH2 protons, with higher rates reducing the difference between the PTE's at these sites. For the threonine containing peptides including those containing arginine, exchange rate predictions were not performed because there are no exchange rate constants listed for the OH protons in Bai et al.(16)
Polypeptide Stability data
The theoretical pI, instability index and in situ half-life for the peptides were computed using the ProtParam software tool on the exPASY Proteomics Server (26), (website http://ca.expasy.org/tools/). The theoretical pI was calculated using the individual pK values of amino acids according to the method described by Bjellqvist et al. (27). The instability index, which was based on a statistical analysis of 44 proteins, is computed based on the combined stability of the amino acid pairs that make up the peptide sequence by summing the stabilities. This is based on the fact that there are certain dipeptides (out of the 400 different possibilities) that occur more frequently in stable proteins, while others show up more frequently in unstable proteins. Using the weightings determined by this statistical analysis (28), an index smaller than 40 predicted as stable, above this index, it is considered to be unstable. The half-life predicts the amount of time for half of the protein in a cell to be degraded after synthesis, and is computed using the N-terminal residue. The identity of this residue determines the half-life, which was established from site-directed mutagenesis studies at the N-terminus of the metabolic fate of artificial beta-galactosidase proteins (29). These parameters are indications for how long the peptide will survive in vivo, and how long the isolated peptide will survive in a test tube. We report the predictions for our CEST based contrast agents which may be used for reporter genes based on rodents and primates in vivo.
Results
NMR Data
In Fig. [2], actual and normalized z-spectra and MTRasym spectra for PLK, PLR and PLT are plotted. When normalizing the MTRasym curves to the highest contrast point for each peptide (Fig. [2c]), maxima are found at saturation frequency offsets of approximately 0.6ppm for PLT, 1.8ppm for PLR and 3.7ppm for PLK. These three characteristic frequency dependencies can be seen as representing “colors” of the amino acid units, allowing one to design polypeptides (Table 2) that can be distinguished, thereby providing the potential to image up to three different targets simultaneously.
Figure 2.

B0 frequency dependence of CEST contrast for PLK (30 kD,  ), PLR (35 kDa,
  ) and PLT (7.6 kD,
  ) using ω1= 2.2 μT. a) Intensity comparison of z-spectra and MTRasym spectra . b) Expanded z spectra from a. b) MTRasym spectra from a normalized to their highest intensity.
In order to best determine how sensitive these agents are and what might optimize this sensitivity, we studied the saturation time, saturation strength, and pH dependence of the CEST contrast for these three base polypeptides. In Figs. [3a,b] the Contrast-to-Noise-Ratio (CNR) for these compounds is plotted as a function of saturation strength. It is evident that the optimal strength for all three agents occurs at about 4.7μT, the same saturation strength shown previously to allow accurate measurements of kex > 400Hz (25) at 11.7T. For PLT alone the optimal field was ∼3.5 μT. In Fig [3c], the PTE in PLR is plotted as a function of pH for both NH and gNH2 exchangeable peaks. For the gNH2 protons, there is an increase in CEST enhancement until about pH=6.7, at which point it stabilizes. For the NH protons, however, contrast increases all the way up to pH= 7.3 and probably beyond. We carried out the same experiments on PLT for NH and OH (Fig. [3d]). Unlike the gNH2 protons in PLR, the OH protons in PLT show a reduction in PTE starting at around pH= 6, while again the NH protons show increased contrast with pH throughout the range tested. For PLK, we previously showed that both exchange rate and NH PTE increase with pH at least up to pH 7.3 at 11.7T (25).
Figure 3.

Optimization of saturation field strength and pH for the best sensitivity for the CEST peptides PLK(▲), PLR(□), and PLT(◇).a) Saturation field strength dependence of the CNR at pH = 7.3. B) Same as a, except CNR scale changed to highlight PLT. c) pH dependence of the PTE for PLR examining both NH(■) and gNH2(□) frequencies at saturation ω1 = 4.7 μT. c) pH dependence of the PTE for the NH (◆) and OH (◇) frequencies in PLT at saturation ω1 = 4.7 μT.
Table 2 lists the charge, theoretical pI, MW/amino acid, peptide stability and PTEs for NH, gNH2, OH protons in the 33 CEST peptides which were either synthesized, expressed in 9L cells (Lysine Rich Protein) or obtained commercially (salmon protamine). The synthesized peptides are 12 residues long and consist of simple binary patterns containing lysine (K), arginine (R), serine (S), threonine (T), glycine (G), glutamate(E), aspartate (D) and histidine (H). These peptides were synthesized based on predictions using Eq. [1]. In Fig. [4] we display the agreement between the experimental and predicted PTE's at the concentrations used for our experiments for the backbone NH protons. In an attempt to predict the PTEs for the arginine containing peptides, we also estimated the exchange rates for the gNH2 protons, but these did not compare well with experiment and are not shown in Fig. 4. For the threonine peptides there were no OH reference rates and so we did not predict the backbone PTEs. The agreement is modest between prediction and experiment, R=0.71. In Fig. [5] the molar PTE values for the various peptides are shown. Fig [5a] shows the enhancement at the NH (green), gNH2 (red) and OH (blue) frequencies. Compared to Fig. [2], a higher saturation field was used (4.7 μT), where the maximal CNR occurs for PLR and PLK with only a slight reduction in PLT sensitivity. To reveal how these peptides would perform as separate colors, we plotted the contrast at the three frequencies, NH (3.69 ppm), gNH2 (1.8 ppm), and OH(0.8 ppm). In Fig. [5b] we display the red color peptides, which are based on R, and in Fig. [5c] the blue color peptides, based on either T or S.
Figure 4.
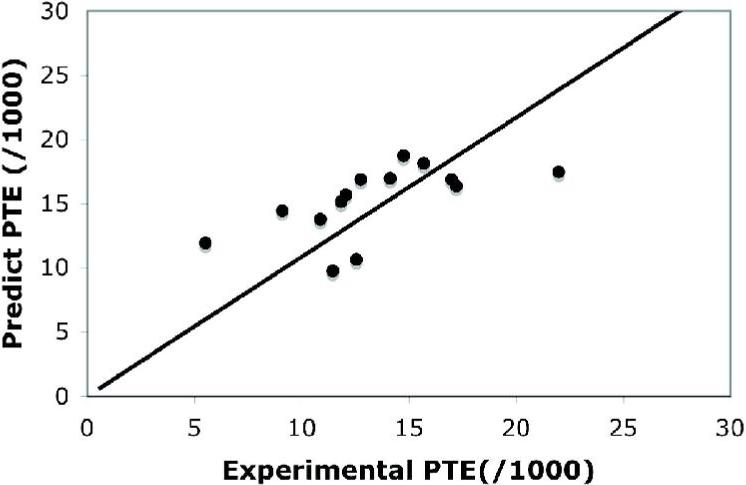
Comparison of experimental vs. predicted PTE ‘s for the 12 residue peptides. Comparison for all peptides, NH PTE (•) and best fit(-). Slope =1.1, R=0.71.
Figure 5.

Comparison of molar PTE values for all peptides at saturation ω1 = 4.7 μT. One letter abbreviations are used for the amino acids (Lys=K, Arg=R, Thr=T, Ser=S, Gly=G, His=H, Asp=D, Glu=E). a) Comparison of PTE for NH color ( ), gNH2 color (
 ), OH color (
 ). b) Comparison of gNH2 color peptides, showing the gNH2 (
 ), NH
), NH  , and OH (
 ) PTE. C) Comparison OH color peptides, showing the NH (
 ), gNH2 (
 ) and OH (
 ) PTE.
The MR images of a phantom consisting of tubes containing PLK, PLR and PLT are shown in Fig. [6]. The optimal image contrast occurs based on our saturation power and saturation frequency data shown in Figs. [2a-c] and [3a]. The PLT peptide appears to limit the saturation strength for this multi-color imaging because the hydroxyl protons resonate very close to the water frequency. Also, tsat was chosen to be 4s, which maintains approximately 80% of the potential CEST contrast in half the saturation time to obtain 100% of this CEST contrast (25). Saturation images were taken using ±3.69 ppm [Fig. 6b], ±1.8 ppm [Fig. 6c], and ±0.8 ppm [Fig. 6d] from the water proton resonance frequency. In order to assign frequencies, these images could then be compared to the MTRasym plots shown in Fig. [2]. The difference images (Figs. [6f-h]) and a merged image (Fig. 6e) demonstrate that the three different polypeptides can be used as three distinguishable “color labels” in a frequency-dependent fashion.
Figure 6.

Phantom images using 3 different saturation frequencies. The phantom consists of 1 mm tubes inserted in a 5mm NMR tube, filled with 2.5 mg/ml peptides as outlined in (A). a) Proton density image. b) MTRasym (±3.69 ppm) image. c) MTRasym (±1.8 ppm) image. d) MTRasym (±0.8 ppm) image. e) Merged image from the three label channels. f) NH label from the difference between images in b, d after normalizing the maximum signal in the image. g) gNH2 channel from c after normalization the maximum signal in the image. h) OH channel from the difference between normalized images c, d.
Discussion
The primary goal of study was to systematically develop and optimize peptide-based DIACEST agents. Polypeptide agents have three attractive features, 1) they can be expressed as reporter genes (14) without need for addition of iron or another paramagnetic chelate supplement to detect the agent 2) they degrade naturally through proteases, and 3) they can be discriminated from each other using the frequency dependence of the saturation transfer (as shown in Figs. [3] and [5]). In this study, we designed and screened 33 peptide sequences composed of either one or two amino acid residues that had three different types of exchangeable protons.
DIACEST peptides used as contrast agents require a different type of optimization than well-folded proteins used for structural NMR studies. In fact, peptides exhibiting a fast exchange rate have previously been been discarded from combinatorial libraries using Electrospray Mass Spectrometry analysis (30). Since CEST MR contrast in general will increase with the exchange rate (18), we studied how simple changes in the amino acid sequence affects these rates. Using the exchange prediction equations of Bai and coworkers (10), a series of peptides expected to have fast rates was identified, which included PLK, Poly-L-Serine (PLS), Poly-Glycine (PG), PLR and PLT. Because PLS and PG are predicted to have rapidly exchanging amide protons but are not very soluble in water, several peptides were designed which included solubilizing residues (K, R, D, E). We grouped these peptides according to three prototype “color” labels based on the resonance frequency of the following three exchangeable protons: NH (PLK), gNH2 (PLR), and OH (PLT/PLS) and studied the sensitivity and differential detectability of the labels.
In order to improve (in the case of PLT) or create (in the case of PLS) a detectable OH PTE effect we modified the baseline polypeptide sequences. For PLT the OH sensitivity drops as a function of pH (Fig. [3c]), presumably due to the exchange rate becoming too fast compared to the chemical shift difference between water and OH at 11.7T. In order to slow the rate down, based on Eq. [1] we added negatively charged sidechains and tried a series of sequences with different amounts of Aspartate and Glutamate. We could also have used Leucine, Valine, Isoleucine or maybe even Alanine or Methionine to slow the rate down, but chose to use the acidic side chains because they also enhance the peptide solubility. For the NH peptides, the CEST effect will increase with kex, and so the fastest exchange rate is desired. The resulting compounds (Table 2, Figs. [5a-c]) have high PTE's and a wide range of isoelectric points (pI) and half-lives. The predictive model proved to reasonably estimate the NH PTE's for the peptides, with an R = 0.71 (Fig. [4]). For gNH2 protons, the agreement was poor, due to the overestimation of the kbw rates. This may be due to protein folding effects that were not taken into consideration, or because the base catalyzed reference rate was too high (kB,ref = 3.32x10⁹). The peptides in this study are 12-residue peptides, whereas Eq.[1] was calibrated using dipeptides (16). It would also have been helpful to have reference rates for S and T OH protons to test the equations, but these were not available. The theoretical pI's of these peptides vary from slightly acidic to extremely basic (Table 2). This should be a consideration when choosing the agent, because positively charged contrast agents will have different interactions in vivo from neutral or anionic agents. The latter, for example, do not bind via non-covalent interactions to anions.
All K-based (NH) derivatives show the same characteristic color label based on the backbone amide protons, which were the only ones visible in the asymmetry spectra. The amide protons in the (KS)6 peptide have a faster exchange rate than PLK, which results in a higher CEST sensitivity as can be seen from the measured PTE. This was predicted based on the results of Eq. [1]. In addition, the three lowest PTE's could be predicted to have reduced contrast due to steric blocking and inductive effects included in Eq.[1]; for example the bulky histidine sidechains in (KH)6 hinder water access to the backbone. In addition, peptides composed predominantly of T or S such as (TTTK)3 are listed as NH peptides because the OH is in the fast exchange limit, and has a PTE that is less than 60% of the NH. At higher magnetic field strengths, this is expected not be the case - i.e. the OH PTE will increase when the chemical shift separation approaches or exceeds the exchange rate.
For the arginine peptides (Fig. [5b]), the shape of the asymmetry spectrum depends on the fraction of guanidyl protons (gNH2) contained in the peptide, but all gNH2 protons still resonate at ∼1.8 ppm from water. As can be seen from Fig. [3b], the optimal exchange rate for these protons is in the physiological range for PLR on a 11.7T scanner, and because PLR consists solely of arginine and possesses the most gNH2's, this peptide has the highest CEST sensitivity. The PTE's of most guanidyl-based peptides are much higher than the NH or OH color peptides, indicating a significantly better sensitivity with concentration, which is partly due to the number of exchangeable protons (4) on the guanidyl group on the side chain, as can be seen from the chemical structure in Fig. [1b]. In addition, from Figs. [5b] and [5c] it is clear that the ratio of contrast displayed at 1.8 and 0.8 ppm is very different between the gNH2 and the OH “color” peptides, with the gNH2 peptides displaying higher contrast at 1.8ppm, the OH at 0.8 ppm.
Protamines are defined as having more than 30% arginine residues and 45−80% arginine+lysine+histidine residues (31). Indeed, salmon protamine displayed the second highest PTE of all peptides tested so far. An additional feature of arginine-rich peptides can be seen in Fig [3]. In the pH range from 6.7 to 7.3, there is almost no change in the PTE measured on the guanidyl protons. This trend also holds for salmon protamine, which makes this agent relatively pH-insensitive over a range of physiologically relevant pH values commonly encountered in tumors and normal tissue (32), which is in stark contrast to PLK (25) and PLT (Fig. [3c]). This pH independency feature might be useful for CEST reporter gene applications in cancer where the intra/extra cellular pH can vary (32).
For the T and S based OH peptides, we wanted to optimize the OH exchange rate for 11.7T to maximize the PTE for these protons. Introduction of K into these sequences reduces the PTE at the OH frequency from PLT because the exchange rate is too fast compared to the chemical shift difference between the hydroxyl protons and water. Addition of negative charges such as those found in aspartate or glutamate sidechains reduces the exchange rate to the slow-to-intermediate exchange regime, and increases the PTE. Addition of alanine, methionine, histidine, isoleucine, valine or leucine will also slow the exchange rates and may prove to be superior for in vivo applications.
We decided to classify the peptides by their highest exchange rate. Thus, peptides having an OH PTE of less than 60% of the NH PTE were classified as NH peptides in Fig. [4]. As shown in Table 2 and Fig. [4c], the (ETT)4 sequence was found to be optimal for 11.7T applications due to a sufficiently slowed OH exchange, however, other sequences should be better for higher or lower magnetic fields due to the different chemical shift separation between OH and water. We were able to tune this exchange rate over a wide range using different amounts of negatively charged side chains.
The polypeptides in Table 2 may serve as a starting point for developing new CEST reporter genes in addition to LRP (14). It could be possible, however, that these may turn out not to be the optimal peptide sequences for in vivo applications, because of potential toxicity, or because the exchange rates might be slower than desired for a given tissue pathology and for different peptide lengths (the previously used LRP was 200 amino acids long). The sensitivity of the CEST agents is lower than that of fluorescence, bioluminescence reporter genes and also superparamagnetic MR contrast agents. We speculate that the detection level of these agents will be limited to tens of thousands of exogenously or endogenously labeled cells in living tissue depending of the properties of the tissue. Nevertheless, the main advantage of CEST agents is that the contrast can be switched on and off by applying different RF pulses. By applying statistical methods developed for fMRI and currently in use to detect small changes we can detect these changes in CEST contrast. These methods rely on correlating the “on” “off” properties of the CEST agent with the changes in the contrast.
It should be pointed out that a number of naturally occurring proteins have similar amino acid sequences to those mentioned in Table 2, including the sperm nuclear basic proteins (SNBPs) (33). The protamine type of SNBPs are small and rich in arginine (≥30 %). Protamine derived from salmon sperm is a 32 amino acid protein, which is 66% arginine. This protein displays z-spectra suitable for CEST agents with label characteristics similar to PLR, demonstrating that there may exist other natural analogues for the three CEST labels. Protamine sulfate has been approved by the FDA to reverse heparin toxicity (34,35), and is also used for the MR labeling of cells using iron oxides (36). In addition, it is expected that a number of the histone type and also protamine-like SNBPs will show large CEST contrast, which would depend on whether or not DNA is bound to the proteins. In nature, both of these protein families are phosphorylated, translocated to the nuclei and primarily involved in DNA binding and formation of compact structures, limiting the water accessibility to the exchangeable protons, which results in a reduction of the exchange rate. Thus, in order to use these as CEST agents, we would like to limit this phosphorylation and binding.
In addition to the residues included, asparagine and glutamine also have exchangeable gNH2 groups that can be detected with CEST and are expected to have fast amide proton exchange based on Eq. [1]. However these residues are the amide forms of aspartate and glutamate, and can de-amidate to D and E residues (37). Since these carboxylic residues produce a reduction in the chemical exchange rates of Lys and the de-amidation reaction of N and Q also can limit the longevity of the protein (37), they are probably undesirable for incorporation into CEST polypeptides. Cysteine is expected to speed up amide exchange rates based on Eq. [1], but was not tested due to the possibility of forming disulfide bridges which might hinder the rates or cause peptide aggregation. We therefore considered this residue to be undesirable.
CEST sensitivity as based on the different types of exchangeable protons at a given magnet field and in a given tissue compartment will depend on two factors which can be adjusted, i.e., the concentration of exchangeable protons and the chemical exchange rate. We have chosen to compare the sensitivity of these agents for peptides dissolved in PBS at pH=7.3 using PTE at 11.7T. We use the molar PTE definition of sensitivity, which to 1st order is independent on concentration (contrast/mole). For all peptides (which have a range of molecular weights), we dissolved 2.5 mg/mL in PBS and then directly measured the concentration of peptide to calculate the molar PTE. For example, incorporation of more glycine residues into a lysine chain might not affect the exchange rate or the PTE but will reduce the molecular weight and thus will increases the sensitivity per mass of agent. Because the sensitivity is not linear with concentration, the PTE will also be affected by changes in concentration due to proton back exchange effects (12,13). However, over a range of +/−100% change in concentration for the peptides used in this study, we calculated that the PTE will be affected by less than +/−15% assuming a 564 Hz exchange rate, which is an acceptable error when comparing the sensitivities. For lower exchange rates the back exchange effects are smaller. Therefore we report PTE to compare the sensitivities directly. The choice of buffer was made because this buffer contains the approximate concentrations of electrolytes found in the cytoplasm (38). The phosphate concentration is very important as phosphate acts as a proton exchange catalyst (38) and reduction of its concentration will reduce the exchange rates.
An additional consideration for contrast agent utility is how stable these peptides are in situ, which has been hinted at from the Instability Index and half-life predictions in Table 2. As can be seen, both protamine sulfate and LRP (14) are predicted to have a particularly long half-life and stability compared to the simpler peptides, which are desirable features. It suggests that addition of specific motifs can potentially prolong the life times of the polypeptides, and may be required for the next generation of CEST contrast agents or reporter genes.
Finally, when testing the multi-color concept on an imaging phantom consisting of tubes of PLK, PLT, PLR and PBS, it was possible to discriminate between the different agents (Fig. [6]). Similar to optical fluorescence images the digitized CEST MRI data could be displayed as color maps. For each peptide a single “color” or label could be assigned simply by subtracting the normalized maps (Figs. 6 e-h). In order to distinguish whether a pixel contained one of the three agents, these 3 frequencies were sufficient as the normalized contrast was very different. This unique CEST capability, is expected to expand the populations. One application that could benefit from this would be serial studies of stem cell-tumor cell interactions. Neural stem cells have been shown to migrate extensively towards glioma cells allowing delivery of anti-tumor genes, Multi-color CEST reporters could aid in these studies, with the neural stem cell population labeled using an gNH2 reporter, which tend to be more sensitive agents, and the tumors an NH or OH reporter. In addition, because these reporters require live cells due to pH sensitivity and degradation from proteases, dead neural stem cells will not be highlighted in the images.
Conclusions
We have shown that a family of CEST peptides can be constructed which produce different frequency responses upon saturation transfer. The current peptide labels can be categorized into three distinct groups based on the resonance frequency (color) of the predominant exchangeable proton: lysine-based, arginine-based, and threonine/serine-based. Over 33 peptides were constructed that produced the high PTE's needed for in vivo applications, and many more are possible. This opens the door to designing and testing libraries of new CEST proteins for use as MR reporter genes in-vivo following transgenic expression. Additional applications may include its use in cell tracking and monitoring drug release.
Acknowledgement
This research was supported, in part, by NIH grants K01 EB006394 and R21 EB005252. The authors thank Drs. Kristine Glunde, Yah-el Har-el, Arvind Pathak and Jinyuan Zhou for their insightful comments.
References
- 1.Ward K, Aletras A, Balaban R. A New Class of Contrast Agents for MRI Based on Proton Chemical Exchange Dependent Saturation Transfer (CEST). J Magn Reson. 2000;143:79–87. doi: 10.1006/jmre.1999.1956. [DOI] [PubMed] [Google Scholar]
- 2.Zhou J, vanZijl PCM. Chemical Exchange Saturation Transfer Imaging and Spectroscopy. Prog NMR Spec. 2006;48:109–136. [Google Scholar]
- 3.Zhang S, Merritt M, Woessner DE, Lenkinski RE, Sherry AD. PARACEST Agents: Modulating MRI Contrast via Water Proton Exchange. Acc Chem Res. 2003;36:783–790. doi: 10.1021/ar020228m. [DOI] [PubMed] [Google Scholar]
- 4.McMahon MT, Zhou J, Gilad AA, Bulte JWM, van Zijl PCM. Physical Mechanism and Applications of CEST Contrast Agents. In: Bulte JWM, Modo M, editors. Molecular and Cellular MR Imaging. CRC press; Boca Raton, FL: 2007. pp. 85–100. [Google Scholar]
- 5.Zhang S, Winter P, Wu K, Sherry AD. A novel europium(III)-based MRI contrast agent. J Am Chem Soc. 2001;123(7):1517–1518. doi: 10.1021/ja005820q. [DOI] [PubMed] [Google Scholar]
- 6.Aime S, Carrera C, Castelli DD, Crich SG, Terreno E. Tunable imaging of cells labeled with MRI-PARACEST agents. Angew Chem Int Ed. 2005;44(12):1813–1815. doi: 10.1002/anie.200462566. [DOI] [PubMed] [Google Scholar]
- 7.Vinogradov E, He H, Lubag A, Balschi JA, Sherry AD, Lenkinski RE. MRI detection of paramagnetic chemical exchange effects in mice kidneys in vivo. Magn Reson Med. 2007;58(4):650–655. doi: 10.1002/mrm.21393. [DOI] [PubMed] [Google Scholar]
- 8.Yoo B, Pagel MD. A Paracest Mri Contrast Agent to Detect Enzyme Activity. Journal of the American Chemical Society. 2006;128(43):14032–14033. doi: 10.1021/ja063874f. [DOI] [PubMed] [Google Scholar]
- 9.Wojciechowski F, Suchy M, Li AX, Azab HA, Bartha R, Hudson RHE. A robust and convergent synthesis of Dipeptide-DOTAM conjugates as Chelators for lanthanide ions: New PARACEST MRI agents. Bioconjugate Chemistry. 2007;18(5):1625–1636. doi: 10.1021/bc0701287. [DOI] [PubMed] [Google Scholar]
- 10.Zhou J, Payen J-F, Wilson DA, Traystman RJ, van Zijl PC. Using the amide proton signals of intracellular proteins and petides to detect pH effects in MRI. Nat Med. 2003;9(8):1085–1090. doi: 10.1038/nm907. [DOI] [PubMed] [Google Scholar]
- 11.Goffeney N, Bulte JW, Duyn J, Bryant LH, Jr., van Zijl PC. Sensitive NMR detection of cationic-polymer-based gene delivery systems using saturation transfer via proton exchange. J Am Chem Soc. 2001;123(35):8628–8629. doi: 10.1021/ja0158455. [DOI] [PubMed] [Google Scholar]
- 12.Snoussi K, Bulte JW, Gueron M, van Zijl PC. Sensitive CEST agents based on nucleic acid imino proton exchange: detection of poly(rU) and of a dendrimer-poly(rU) model for nucleic acid delivery and pharmacology. Magn Reson Med. 2003;49(6):998–1005. doi: 10.1002/mrm.10463. [DOI] [PubMed] [Google Scholar]
- 13.van Zijl PCM, Jones CK, Ren J, Malloy CR, Sherry AD. MRI Detection of Glycogen In Vivo Using Chemical Exchange Saturation Transfer Imaging (glycoCEST). Proceedings of the National Academy of Sciences of the United States of America. 2007;104(11):4359–4364. doi: 10.1073/pnas.0700281104. [DOI] [PMC free article] [PubMed] [Google Scholar]
- 14.Gilad AA, McMahon MT, Walczack P, Winnard PTJ, Raman V, van Laarhoven HWM, Skoglund CM, Bulte JWM, van Zijl PCM. Artificial reporter gene providing MRI contrast based on proton exchange. Nat Biotech. 2007;25(2):217–219. doi: 10.1038/nbt1277. [DOI] [PubMed] [Google Scholar]
- 15.Shaner NC, Campbell RE, Steinbach PA, Giepmans BNG, Palmer AE, Tsien RY. Improved monomeric red, orange and yellow fluorescent proteins derived from Discosoma sp red fluorescent protein. Nature Biotechnology. 2004;22(12):1567–1572. doi: 10.1038/nbt1037. [DOI] [PubMed] [Google Scholar]
- 16.Bai Y, Milne JS, Mayne L, Englander SW. Primary Structure Effects on Peptide Group Hydrogen Exchange. PROTEINS. 1993;17:75–86. doi: 10.1002/prot.340170110. [DOI] [PMC free article] [PubMed] [Google Scholar]
- 17.Connolly GP, Bai Y, Jeng M-F, Englander SW. Isotope Effects in Peptide Group Hydrogen Exchange. PROTEINS. 1993;17:87–92. doi: 10.1002/prot.340170111. [DOI] [PubMed] [Google Scholar]
- 18.Zhou J, Wilson DA, Sun PZ, Klaus JA, van Zijl PCM. Quantitative Description of Proton Exchange Processes between Water and Endogenous and Exogenous Agents for WEX, CEST, and APT Experiments. Magn Reson Med. 2004;51(5):945–952. doi: 10.1002/mrm.20048. [DOI] [PubMed] [Google Scholar]
- 19.Jeener J, Meier BH, Bachmann P, Ernst RR. Investigation of Exchange Processes by 2-Dimensional NMR-Spectroscopy. J Chem Phys. 1979;71(11):4546–4553. [Google Scholar]
- 20.Forsen S, Hoffman RA. Study of Moderately Rapid Chemical Exchange Reactions by Means of Nuclear Magnetic Double Resonance. J Chem Phys. 1963;39(11):2892–2901. [Google Scholar]
- 21.McConnell HM. Reaction rates by nuclear magnetic resonance. J Chem Phys. 1958;28:430–431. [Google Scholar]
- 22.McConnell BM, von Hippell PH. Hydrogen exchange as a probe of the dynamic structure of DNA: I. General acid-base catalysis. J Molec Biol. 1970;50:297–316. doi: 10.1016/0022-2836(70)90194-4. [DOI] [PubMed] [Google Scholar]
- 23.Woessner DE, Zhang S, Merritt ME, Sherry AD. Numerical solution of the Bloch equations provides insights into the optimum design of PARACEST agents for MRI. Magn Reson Med. 2005;53(4):790–799. doi: 10.1002/mrm.20408. [DOI] [PubMed] [Google Scholar]
- 24.Sun PZ, van Zijl PCM, Zhou JY. Optimization of the irradiation power in chemical exchange dependent saturation transfer experiments. Journal of Magnetic Resonance. 2005;175(2):193–200. doi: 10.1016/j.jmr.2005.04.005. [DOI] [PubMed] [Google Scholar]
- 25.McMahon MT, Gilad AA, Zhou J, Sun PZ, Bulte JWM, vanZijl PCM. Quantifying exchange rates in CEST Agents using the saturation time and saturation power dependencies of the magnetization transfer effect on the MRI signal (QUEST and QUESP): pH calibration for Poly-L-Lysine and a Starburst Dendrimer. Magn Reson Med. 2006;55:836–847. doi: 10.1002/mrm.20818. [DOI] [PMC free article] [PubMed] [Google Scholar]
- 26.Gasteiger E, Hoogland C, Gattiker A, Duvaud S, Wilkins MR, Appel RD, Bairoch A. Protein Identification and Analysis Tools on the ExPASy Server. In: Walker JM, editor. The proteomics protocols handbook. Humana Press; Totowa, N.J.: 2005. pp. 571–607. [Google Scholar]
- 27.Bjellqvist B, Hughes GJ, Pasquali C, Paquet N, Ravier F, Sanchez JC, Frutiger S, Hochstrasser D. The focusing positions of polypeptides in immobilized pH gradients can be predicted from their amino acid sequences. Electrophoresis. 1993;14(10):1023–1031. doi: 10.1002/elps.11501401163. [DOI] [PubMed] [Google Scholar]
- 28.Guruprasad K, Reddy BVB, Pandit MW. Correlation between Stability of a Protein and Its Dipeptide Composition - a Novel-Approach for Predicting Invivo Stability of a Protein from Its Primary Sequence. Protein Engineering. 1990;4(2):155–161. doi: 10.1093/protein/4.2.155. [DOI] [PubMed] [Google Scholar]
- 29.Varshavsky A. The N-end rule pathway of protein degradation. Genes to Cells. 1997;2(1):13–28. doi: 10.1046/j.1365-2443.1997.1020301.x. [DOI] [PubMed] [Google Scholar]
- 30.Rosenbaum DM, Roy S, Hecht MH. Screening combinatorial libraries of de Novo proteins by hydrogen-deuterium exchange and electrospray mass spectrometry. Journal of the American Chemical Society. 1999;121(41):9509–9513. [Google Scholar]
- 31.Lewis JD, Song Y, de Jong ME, Bagha SM, Ausio J. A walk though vertebrate and invertebrate protamines. Chromosoma. 2003;111(8):473–482. doi: 10.1007/s00412-002-0226-0. [DOI] [PubMed] [Google Scholar]
- 32.Gillies RJ, Raghunand N, Karczmar GS, Bhujwalla ZM. MRI of the tumor microenvironment. Journal of Magnetic Resonance Imaging. 2002;16(4):430–450. doi: 10.1002/jmri.10181. [DOI] [PubMed] [Google Scholar]
- 33.Lewis J, Ausio J. Protamine-like proteins: evidence for a novel chromatin structure. Biochem Cell Biol. 2002;80(3):353–361. doi: 10.1139/o02-083. [DOI] [PubMed] [Google Scholar]
- 34.Gervin AS. Complications of heparin therapy. Surg Gynecol Obstet. 1975;140(5):789–796. [PubMed] [Google Scholar]
- 35.Bull BS, Huse WM, Brauer FS, Korpman RA. Heparin therapy during extracorporeal circulation. II. The use of a dose-response curve to individualize heparin and protamine dosage. J Thorac Cardiovasc Surg. 1975;69(5):685–689. [PubMed] [Google Scholar]
- 36.Arbab AS, Yocum GT, Kalish H, Jordan EK, Anderson SA, Khakoo AY, Read EJ, Frank JA. Efficient magnetic cell labeling with protamine sulfate complexed to ferumoxides for cellular MRI. Blood. 2004;104(4):1217–1223. doi: 10.1182/blood-2004-02-0655. [DOI] [PubMed] [Google Scholar]
- 37.Creighton TE. Proteins : structures and molecular properties. xiii. W.H. Freeman; New York: 1993. p. 507. [Google Scholar]
- 38.Liepinsh E, Otting G. Proton exchange rates from amino acid side chains--implications for image contrast. Magn Reson Med. 1996;35(1):30–42. doi: 10.1002/mrm.1910350106. [DOI] [PubMed] [Google Scholar]