Abstract
Many transgenic and knockout mouse models with increased urine flow have been noted to have structural abnormalities of the renal pelvis and renal inner medulla. Here, we describe an approach for in vivo study of such abnormalities in mice using high resolution contrast enhanced T1-weighted magnetic resonance imaging (MRI). The studies were carried out in mice in which the UT-A isoform 1 and 3 urea transporters had been deleted (UT-A1/3-/- mice). The experiments revealed three distinct variations in the appearance of the renal pelvis in these mice: 1) normal kidneys with no accumulation of contrast agent in the renal pelvis; 2) frank right-sided unilateral hydronephrosis with marked atrophy of the renal medulla, seen relatively infrequently; and 3) a renal pelvic reflux pattern characterized by the presence of contrast agent in the renal pelvis surrounding the renal inner medulla, with no substantial atrophy of the renal medulla, seen in most UT-A1/3-/- mice with advancing age. The reflux pattern was also found in aquaporin-1 knockout mice. UT-A1/3-/- mice also manifested increased mean arterial pressure. Feeding the UT-A1/3-/- mice a low protein diet did not prevent the demonstrated abnormalities of the renal pelvis. These studies demonstrate the feasibility of real time imaging of renal pelvic structure in genetically manipulated mice, providing a tool for non-destructive, temporal studies of kidney structure.
Keywords: kidney, hydronephrosis, renal pelvic reflux, blood pressure
Introduction
We recently generated knockout mice (UT-A1/3-/- mice) in which we deleted the two UT-A urea transporter isoforms expressed in the inner medullary collecting duct, namely UT-A1 and UT-A3 [1]. Isolated perfused inner medullary collecting ducts (IMCDs) from these mice demonstrated a complete lack of phloretin-sensitive urea transport. UT-A1/3-/- mice characteristically displayed a sustained polyuria that was markedly attenuated when urea production was reduced by restricting dietary protein intake [1], suggesting that the polyuria was a result of an osmotically-induced diuresis produced by high luminal urea. Such an osmotic diuresis does not occur in normal mice because the urea transporters mediate equilibration of luminal and interstitial urea concentrations. UT-A1/3-/- mice were also found to exhibit increased excretion of nitric oxide and had evidence of renal medullary hyperemia [2].
A number of mouse strains have been described in which knockout of a particular gene results in sustained polyuria and renal pelvic abnormalities [3] including those with disruption of angiotensinogen [4], the angiotensin-II AT1 receptor [5], the thick ascending limb Na-K-2Cl transporter NKCC2 [6], and the water channels AQP1 [ref] and AQP3 [7]. Anecdotally, we have also observed sporadic hydronephrosis in polyuric UT-A1/3-/- mice [2].
While computed tomography is the main modality used for clinical imaging of the kidney, magnetic resonance imaging (MRI) is comparable in identification of renal lesions [8], and can provide a wide range of morphologic and functional information through techniques such as diffusion weighted imaging, dynamic contrast enhanced imaging, size selective contrast agents, and angiography [9;10]. Indeed, MRI has widespread application in the assessment of kidney disease, including visualization of cysts, tumors, obstructive uropathy, and vasculature [9;10].
Hydronephrosis in pediatric patients has been examined and shown to be well defined using a chelated gadolinium contrast agent, gadopentate dimeglumine (Gd-DTPA), for urography [11;12]. However, MRI of hydronephrosis has not to our knowledge been previously reported in mouse models. Technetium (99m-Tc)-DTPA and gadolinium-DTPA clearance are markers for glomerular filtration rate by x-ray and MRI methods respectively [13]. In this study gadolinium-DTPA clearance through the kidney is used to visualize fluid in the kidney at high contrast and identify structural abnormalities in the pelvic space in these models.
MRI in small animal models, particularly mice, requires higher magnetic fields than clinical systems, dedicated radiofrequency coils and high performance gradient systems to achieve high resolution images. In recent years, improvements in technology in the form of high magnetic field (7.0T and higher) systems have become accessible to most academic medical research institutions. MRI has been applied to the characterization of a number of mouse models including polycystic kidney disease [14] [15], and combined with novel contrast agents to characterize renal failure [16].
In the present study, we used serial MRI to evaluate kidneys from polyuric UT-A1/3-/- mice in order to investigate the morphology of the renal pelvis as a function of time as well as dietary protein intake. Contrast enhanced T1 weighted MRI was performed of the abdomen following subcutaneous administration of gadopentate dimeglumine, Gd-DTPA. The renal anatomy was well delineated on high resolution T1 weighted images. Telemetric measurement of blood pressure and acute sodium loading test were also performed to compare the blood pressure and urine excretion between UT-A1/3-/- and wild-type mice.
Results
MRI Imaging of UT-A1/3-/- mice kidneys
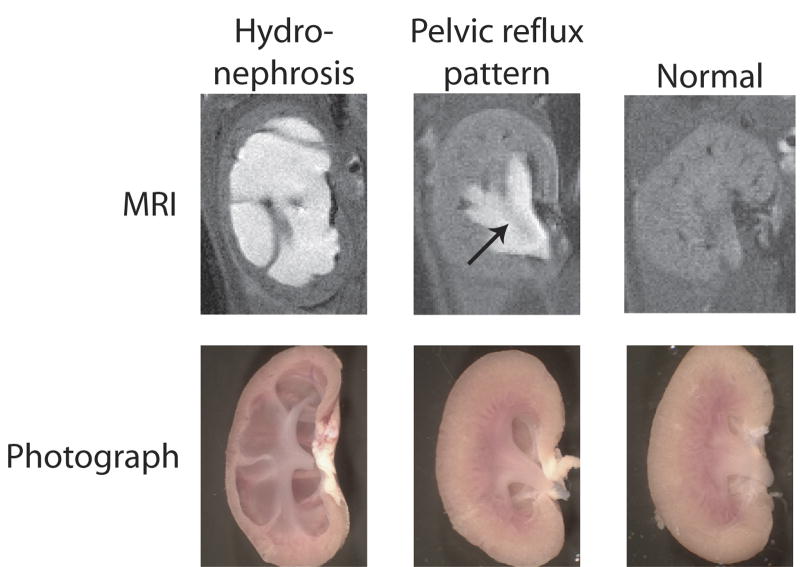
Figure 1 shows examples of contrast-enhanced MRI images from mouse kidneys obtained in this study along with photographs of the same kidneys after resection. The contrast agent is generally concentrated in the urine, and thus, in these and other images in this paper, the brightest areas represent contrast agent in the urinary space. The study demonstrated two distinct variations from the normal appearance of kidney: 1) renal hydronephrosis characterized by extensive dilation of the entire renal pelvis including the pelvic fornices and peripelvic columns (seen in ∼20% of animals); and 2) a renal pelvic reflux pattern, consistent with a functional defect characterized by urinary backflow into the pelvis surrounding the inner medulla (seen in the majority of UT-A1/3-/- mice). One or the other of these variations were eventually seen in more than 80% of the UT-A1/3-/- mice, but were not seen in wild-type mice at any time point (Table 1, analysis by Chi-square). Hydronephrosis was seen only in the right kidney, and when present the left-kidney generally did not show reflux. Although reflux is a dynamic process and the MRI images are time-averaged, the reflux pattern is consistent with the pattern that would be expected based on prior physiological observations in rodents [17], in which refluxing urine bathes the outer aspect of the renal inner medulla. The inner medulla is seen in Figure 1 (middle) as a dark area in the midst of the bright contrast (arrow). This type of reflux has been viewed as a variation of normal that exists with rising or rapid urine flow [18]. With reflux, urine emerging from the ducts of Bellini at the inner medullary tip moves retrograde during part of the peristaltic cycle, whereas in the absence of reflux, urine emerging from the ducts of Bellini passes directly into the ureter. (This type of reflux does not appear to involve movement of urine in a retrograde path up the ureter as seen under some clinical circumstances in human.)
Figure 1.
MRI images (above) and photographs (below) of mouse kidneys illustrating the morphological changes seen in kidneys from UT-A1/3-/- mice compared to normal mouse kidneys (right). Prior to imaging, anesthetized mice were subcutaneously injected with Magnevist contrast agent. Cavities where the contrast agent accumulates in fluid appear white on the MRI. The two distinct abnormalities seen were frank hydronephrosis (left) and a pelvic reflux pattern (middle). An arrow depicts the position of renal inner medulla.
Table 1.
Chi Square analysis of occurrence of renal pelvic abnormalities in UT-A1/3-/- and wild-type mice.
| Normal | Renal Pelvic
Abnormality |
Total | |
|---|---|---|---|
| WT* | 16
(100%) |
0
(0%) |
16 |
| UT-A1/3-/- | 5
(16.7%) |
25
(83.3%) |
30 |
|
| |||
| Total | 21 | 25 | 46 |
WT, wild-type.
Chi square test showed a highly significant difference in occurrence of renal pelvic abnormalities (P<0.0001).
Throughout this study, the renal pelvic changes identified by MRI in UT-A1/3-/- mice were consistent with the patterns seen by visual examination of the resected kidneys (Figure 1, bottom). In particular, the massive dilatation seen in the MRI images of hydronephrotic kidneys was confirmed by direct observation and found to be associated with marked atrophy of the renal medulla. The reflux pattern in the MRI images was associated with modestly increased volume of the pelvic space surrounding the inner medulla, but normal inner medullary morphology.
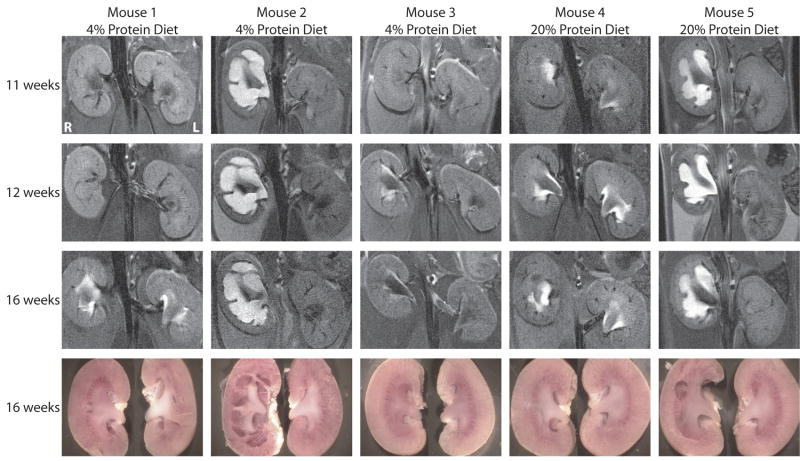
Figure 2 shows examples of MRI images of kidneys from the same UT-A1/3-/- mice maintained on different dietary protein intakes at a series of time points to illustrate morphological changes with time and the effect of the attenuation of polyuria. The first three animals seen in Figure 2 were maintained on a 4% protein gelled diet beginning at weaning (3 weeks). The first animal shown in Figure 2 (Mouse 1) had normal MRI images at 11 and 12 weeks and developed bilateral pelvic reflux pattern by 16 weeks. Mouse 2 had frank hydronephrosis in the right kidney and no pelvic abnormality in the left kidney at 11 weeks which did not change during the period of observation, i.e. 11-16 weeks. Mouse 3 had no renal pelvic abnormalities at 11 weeks, but developed unilateral pelvic reflux in the right kidney by 12 weeks. Mouse 4 and mouse 5 were maintained on a normal pelleted diet (20% protein). By 11 weeks, mouse 4 had bilateral pelvic reflux pattern and mouse 5 had unilateral hydronephrosis in the right kidney. The MRI images of mouse 4 and mouse 5 were unchanged throughout the time series images.
Figure 2.
MRI images and photographs of kidneys from the same UT-A1/3-/- mice at different ages. Mice were maintained on either a low-protein diet or a normal-protein diet (as indicated) from the time of weaning. MRI renal imaging was performed at 11, 12 and 16 weeks of age. At the end of MRI imaging at 16 weeks, mice were euthanized, and the kidneys were resected and photographed.
In general, kidneys from UT-A1/3-/- mice could have any of the three morphological appearances shown in Figure 1, including a totally normal appearance. We never observed progression from a reflux pattern to frank hydronephrosis in the 11-16 week time frame (out of 9 mice progressively imaged). When hydronephrosis was present, it was always seen from the earliest time point (either 11 or 12 weeks) and was present only in the right kidney. In some cases, the reflux pattern was seen at 11-12 weeks, but in other cases it developed initially from kidneys without reflux. Both hydronephrosis and reflux pattern were observed in mice on both the low protein and normal protein diets. Thus, diet did not have an effect on presence or absence of these renal manifestations during the 11-16 week time frame.
To examine whether renal pelvic abnormalities can be detected at early ages, kidneys were dissected from 5 UT-A1/3-/- mice at age of 3 weeks, immediately after weaning (Figure 3). Whereas mice numbers 2, 3 and 4 had normal kidneys, the right kidney of mouse 1 showed frank hydronephrosis and the right kidney of mouse 5 had a slightly expanded pelvic space with normal inner medullary architecture, suggesting that it may have experienced reflux.
Figure 3.
Photographs of kidneys from 3 weeks old UT-A1/3-/- mice. Kidneys from five UT-A1/3-/- mice shortly after weaning were visual examined for possible renal pelvic abnormalities. The right kidney of mouse 1 shows signs of hydronephrosis with loss of cortex parenchyma and a clear pelvic cavity. The right kidney of mouse 5 shows sign of reflex pattern similar to that shown in Figure 1 and Figure 2.
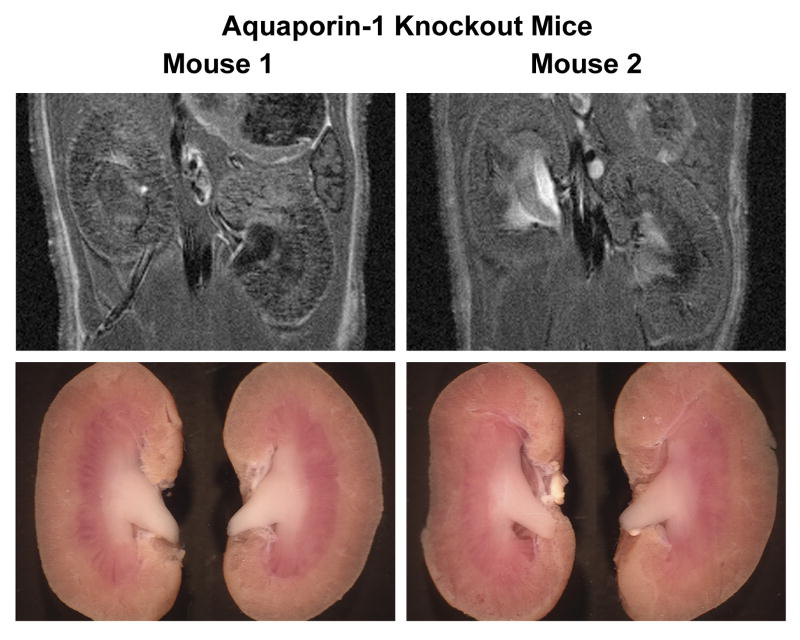
To address whether either the hydronephrosis or the reflux detected in UT-A1/3-/- mice by MRI can be seen in another mouse strain that has polyuria, we examined kidneys from aquaporin-1 (AQP1) knockout mice. MRI examination was performed on two AQP1 knockout mice at 11 weeks (Figure 4). Both the MRI renal images and photographed kidney from mouse 2 are consistent with the renal reflux pattern seen in UT-A1/3-/- mice.
Figure 4.
MRI images and photographs of kidneys from aquaporin-1 knockout mouse. Two aquaporin-1 mice at 11 weeks old were examined. The right kidney of mouse 2 clearly shows reflex pattern in both MRI imaging and photographs.
Mean arterial blood pressure; plasma renin and aldosterone
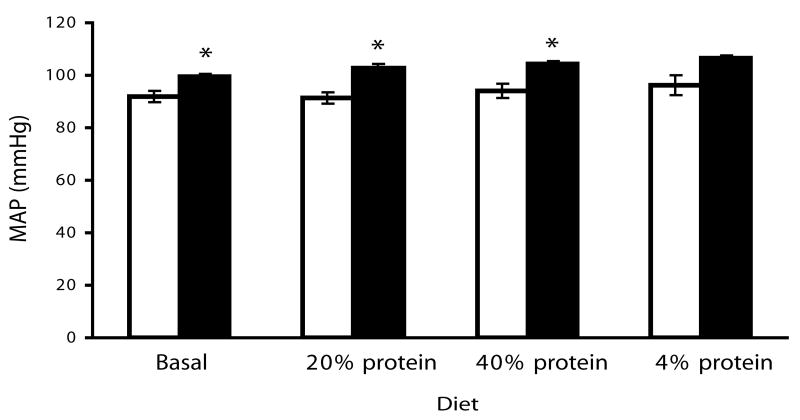
To address whether UT-A1/3-/- mice are normotensive we telemetrically measured mean arterial blood pressure in >10 week old UT-A1/3-/- mice on a progression of diets with different protein contents, separated by one week equilibration periods. Regardless of diet the mean arterial blood pressure in UT-A1/3-/- mice were about 10 mmHg higher than in wild-type mice (Figure 5). Plasma renin levels were not significantly different between UT-A1/3-/- mice and WT control mice on all diets (Figure 6). In the wild-type group, the plasma renin activity was significantly increased when mice were on high protein dietary intake (n=10, P<0.01). In addition, aldosterone levels were not significantly different between WT and UT-A1/3-/- mice (Figure 6).
Figure 5.
Telemetric blood pressure measurement. Mean arterial blood pressure was telemetrically measured from 4 UT-A1/3-/- and 4 wild-type mice on different diets. Mice were allowed to equilibrate for 7 days on each diet before measurements. Values are mean ± SE; * indicates significant difference by t-test (P<0.05).
Figure 6.
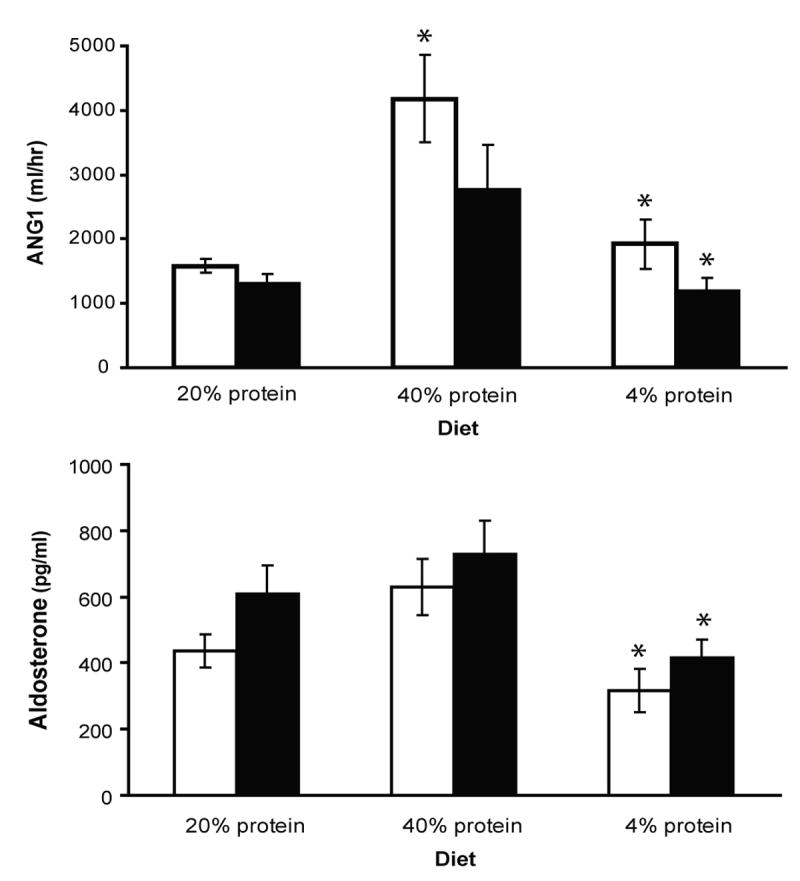
Plasma renin activity and aldosterone. Value show measurments 11 UT-A1/3-/- versus 10 wild-type mice on different dietary protein intakes. Mice were allowed to equilibrate for 7 days on each diet before measurements. There is no significant difference in plasma renin or aldosterone between knockout and wildtype mice. Values are mean ± SE; * indicates significantly different from previous period by t-test (P<0.05).
Ability to excrete an acute Na load
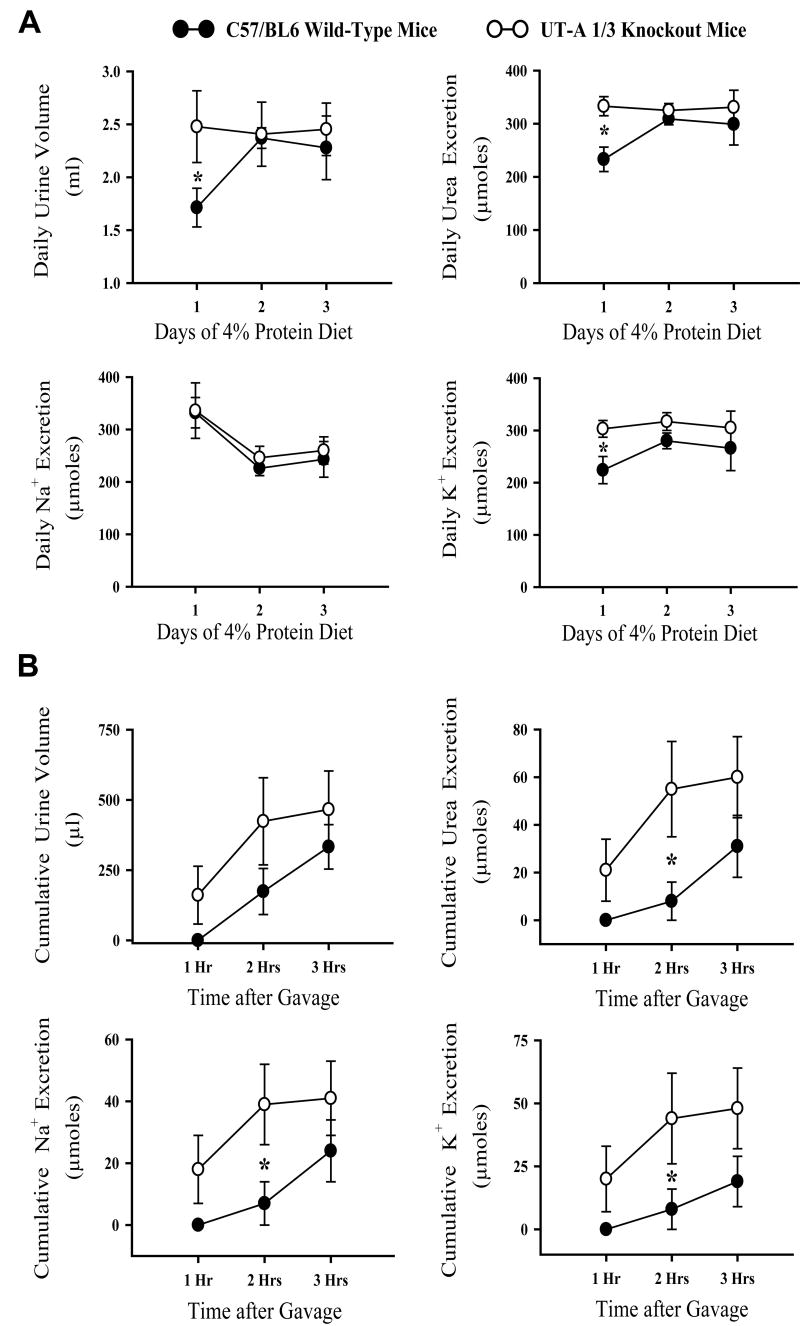
We also measured the ability of 11-12 week UT-A1/3-/- mice without hydronephrosis to excrete a test load of a solution containing 50 mM urea and 125 mM NaCl (0.3 mL/ 25 gBW) (Figure 7). Three days prior to the experiment, UT-A1/3-/- mice and WT mice were kept on a 4% protein gelled food diet to minimize osmotic diuresis [1]. Following equilibration on the diet for three days, WT and UT-A1/3-/- mice were similar with regard to urine volume and excretion of solutes (Figure 7A). After the test fluid load, UT-A1/3-/- mice excreted urea more rapidly than did WT mice (Figure 7B). UT-A1/3-/- mice also excreted water, Na, and K more rapidly than WT mice at the second hour after gavage loading.
Figure 7.
Urine excretion analysis. Metabolic cage studies were conducted on six UT-A1/3-/- mice and six wild-type mice. A. Mice were maintained on a 4% protein diet with 0.2% NaCl for a three-day equilibration period. Daily renal excretion of urine and solutes are depicted. Mice in both groups had similar urine volume and solute excretion at the end of the equilibration period. Values are mean ± SE; * indicates significant difference by t-test (P<0.05). B. Urine excretion measurements in gavage loading test. Following equilibration period, mice were given a gavage loading of an iso-osmotic solution (50 mM urea and 125 mM NaCl). Cumulative renal excretion was measured in each hour after gavage loading up to 3 hours. UT-A1/3-/- mice had a significantly higher excretion of urea, sodium and potassium at the second hour after the onset of loading. Values are mean ± SE; * indicates significant difference by t-test (P<0.05).
Discussion
A distinct advantage of MRI over the usual means of assessing renal anatomy, gross dissection, in the process of renal phenotyping is the ability to image changes in individual mice non-invasively over time. Indeed, in the present study, there was a high correlation between the MRI images and the renal morphology shown on renal dissection. Important factors in the application of MRI to the mouse kidney are high spatial resolution, respiratory gating to remove respiratory motion artifacts in the abdomen, and use of a spin echo technique. We used a 7.0T MR system, ECG gating to remove arterial motion blurring, and respiratory gating. Both single-echo spin echo techniques and respiratory gating prolong imaging time compared to ungated or faster repetition-time imaging techniques, but produce superior images in this application. High contrast visualization of the renal pelvic space results from concentration of the contrast agent in urine as it is excreted through the kidneys from the bloodstream. We used subcutaneous injection of the contrast agent as opposed to the standard intravenous route. This allowed at least a 30-minute period of highly enhanced fluid in the kidney. This was a sufficient imaging period to obtain a multislice, respiratory gated spin echo data set through the kidney.
Contrast-enhanced MRI at 7.0T yielded high-contrast images of mouse kidneys in UT-A1/3-/- mice, differentiating three different morphological appearances. These three appearances, confirmed by direct observation of resected kidneys, were: 1) normal kidneys with no accumulation of contrast agent in the renal pelvis; 2) frank unilateral hydronephrosis, with marked dilation of the pelvic space accompanied by atrophy of the renal parenchyma; and 3) a pattern of contrast accumulation consistent with pelvic reflux. The latter was associated with the presence of contrast agent over the inner medulla with no deformation of the renal parenchyma.
The MRI imaging method allowed assessment of the effects of time and diet on kidney morphology in serial images of kidneys from UT-A1/3-/- mice over several days (Figure 2). The reflux pattern was usually not present or relatively mild at the earliest time point (11 weeks) but appeared or progressed at longer time points. Low protein diet did not eliminate the progression of the reflux pattern, and overall the results indicate that dietary protein restriction did not significantly reduce the extent of reflux or hydronephrosis, suggesting that the degree of polyuria in later stages of progression is not a significant factor. MRI results also indicate that although the reflux pattern may advance over time, it does not convert to hydronephrosis in the 16 week time frame. We observed that in those mice that have hydronephrosis, it is unilateral in the right kidney, while reflux pattern was observed either unilaterally or bilaterally. When observed, the hydronephrosis was far advanced at 11 weeks, and did not appreciably change by 16 weeks. Thus, hydronephrosis and reflux appear to be separate, independent processes.
UT-A1/3 knockout mice also manifested mild hypertension and accelerated excretion of a saline/urea load administered by gastric gavage. Hypertension has been seen previously in rodents with hydronephrosis [19], [20], although it is not clear whether the either renal pelvic abnormality is causally related to the hypertension observed in the present experiments. Based on the present findings, the hypertension in UT-A1/3-/- mice is unlikely to be due to abnormalities in the renin-angiotensin-aldosterone system. Furthermore, we previously observed that UT-A1/3-/- mice exhibit more than double the rate of NO product excretion than wild-type mice [2]. Thus, the hypertension in UT-A1/3-/- mice does not appear to be due to NO deficiency. Further studies are required to determine the mechanism of hypertension in these mice.
Could the urine concentrating defect seen in the previous studies with UT-A1/3-/- mice [1]; [2]; [21] be attributable to hydronephrosis? The answer is no, because the kidneys in the previous studies were examined visually and the occasional mouse that manifested hydronephrosis was not included in the analysis. It is likely, however, that reflux was present in many of the mice studied previously, since the presence of reflux is not associated with obvious structural abnormalities of the renal medullary parenchyma and would not have been detected by visual inspection. Whether reflux is truly an abnormality or a physiological variation of normal is presently unclear. Schmidt-Nielsen [18] demonstrated that pelvic reflux is seen in normal rodents in states of rising or high urine flow as may be present in our mice. The physiological and pathological significance of pelvic reflux remains to be evaluated and high resolution MRI provides a tool that could be exploited in the pursuit of this question.
Methods
Animals
Experiments were performed in UT-A1/3-/- mice of 11 to 16 weeks of age and corresponding wild-type (WT) controls from the same C57BL/6 background strain. The knockout mice were previously generated by selectively deleting 3 kb of the UT-A transporter gene containing a single 140-bp exon, which ablates UT-A1 and UT-A3 expression but not UT-A2 expression [1]. Animals were housed up to five per cage and kept on a 12:12-h light-dark cycle with free access to water and standard mouse chow (pelleted, 20% protein), unless otherwise indicated. Where control of dietary intake of protein was required, the standard chow was replaced by a gelled food diet with 4%, 20%, or 40% protein (as casein) by isocaloric substitution for cornstarch and sucrose as described [2]. Two aquaporin-1 knockout mice were also used in the present study [22]. All animal procedures were approved by NHLBI Animal Care and Use Committee (protocol H-0047).
MRI Imaging of UT-A1/3-/- mice kidneys versus WT mice kidneys
Experiments were carried out in a 7.0T, 16 cm horizontal Bruker MR imaging system (Bruker, Billerica, MA) with Bruker ParaVision 3.0.2 software. Mice were anesthetized with 1.5-2.5% isoflurane and imaged with ECG, temperature and respiratory detection using a 38 mm Bruker birdcage volume coil. Magnevist (Berlex, Montville, NJ) diluted 1:10 with sterile 0.9% saline, was administered subcutaneously at a dose of 0.3 mmol Gd /kg BW. T1 weighted spin echo images (TR/TE= 600/10.7 ms, 5-7 averages, 0.5 mm slice thickness, 2.5 to 2.8 cm × 5 cm field of view, 512×256 matrix, 5-7 slices, respiratory and ECG-gated) were acquired in the coronal plane through the kidneys within 20 minutes of gadolinium injection. At the conclusion of the MRI session, the mice were either euthanized or returned to their cages. When euthanized, their kidneys were resected and bisected coronally but slightly off center for observation and photographic imaging with a Sony CCD camera (Model DKC-5000) mounted on a Wild M-8 dissection microscope.
Telemetric measurement of blood pressure
Four ten-week old male UT-A1/3-/- mice and four age-matched wild-type mice were implanted with blood pressure devices (model TA11PA-C10, Data Sciences International, St. Paul, MN). Telemetric transmitters were magnetically activated >24 h before implantation. Mice were anesthetized with ketamine and xylazine (90 and 10 mg/kg, respectively) and the left carotid artery was isolated. The telemeter catheter was inserted into the left carotid artery and advanced to reach the aortic arch, and the telemeter body (model TA11PA-C10, Data Sciences International, St. Paul, MN) was placed in a subcutaneous pocket on the right flank. One day after surgery, each animal was returned to its home cage with ad libitum food and water for the duration of the study [23].
After surgery for implantation of the telemetric device, mice were allowed to recover for one week before blood pressure measurements were made. The telemeter signal was processed using a model RPC-1 receiver, a 20-channel data-exchange matrix, APR-1 ambient pressure monitor, and a Dataquest ART 2.3 acquisition system (Data Sciences International). The system was programmed to acquire data for 10 s every 2 min and to calculate 1 hour averages of the mean, systolic, and diastolic blood pressure. Additionally, activity and heart rate were recorded. The recording room was maintained at 21–22°C. The eight mice implanted with telemetric devices were treated consecutively with a 20% protein (by weight as casein) pelleted diet, a 20% protein gelled diet, a 40% protein gelled diet and a 4% protein gelled diet. Animals were allowed to equilibrate to each diet for a period of five days before blood pressure measurements were recorded.
Renin sampling and assay; plasma aldosterone
Eleven UT-A1/3-/- and ten wild-type mice treated with the four different diets were used for blood renin sampling and plasma aldosterone measurments. This group included the eight mice implanted with telemetric blood pressure devices (see above) and additional mice of similar age. Blood was taken from conscious mice by submandibular vein puncture towards the end of each diet period. The samples were collected into a 75-μl hematocrit tube containing 1 μl 125 mM EDTA in the tip. Red cells and plasma were separated by centrifugation, samples were frozen until use. With the use of a five-fold dilution of 2 μl of plasma, renin concentration was measured by radioimmunoassay (Gammacoat, DiaSorin, Stillwater, MN) as the generation of angiotensin I (ANG I) following addition of excess rat substrate with final plasma dilutions varying between 1:500 and 1:1,000 [23]. Plasma aldosterone was measured by Coat-A-Count aldosterone radioimmunoassay (Cat. No. TKAL-1, Diagnostic Products Corporation, Los Angeles, CA).
Sodium loading by gavage and urine collection
Six UT-A1/3-/- mice and six age-matched wild-type controls were placed on a 4% protein and 0.2 mEq/ day/ 20 g mouse NaCl gelled food diet as described above. Animal weights were: UT-A1/3-/-, 26.1 ± 0.6 g; and WT, 27.1 ± 0.6 g (approximately 11 weeks of age). The diet was continued for 3 days with each mouse receiving 8 g/ day/ 20 gBW. The mice were kept in metabolic cages (Hatteras Instruments) and urine was collected under 1 mL of mineral oil in pre-weighed tubes. Each day, the mice were weighed. After collecting urine, all parts of the cage were cleaned to remove any previous residue prior to addition of a new collection tube.
On the test day, each mouse received a gavage of 0.4 cc/20gBW of a solution containing 50 mM urea and 125 mM NaCl (300 mOsm total) and urine was collected on parafilm for three 1-hr periods in modified metabolic cages. Following the experiment, the mice were returned to regular cages for five days. All urine samples were centrifuged for 2 minutes to remove particulates. The supernatant was diluted 1:10 with distilled water and vortexed prior to measurement of urea, sodium and potassium using an autoanalyzer. The experiment was then repeated identically with a 40% protein gelled food diet in the same mice.
Statistical analysis
Data are presented as mean ± SE. Statistical significance was determined by Chi-square test and paired or unpaired t-test. P<0.05 was considered significant.
Acknowledgments
We thank Aneeka Chaudhry for her excellent technical assistance with MRI imaging. The work described in this paper was supported by the Intramural budgets of NHLBI (Z01-HL001285) and NIDDK (Z01-DK043408), and the support of NHLBI to MRI Imaging Core.
Footnotes
Disclosure: The authors state no conflict of interest.
References
- 1.Fenton RA, Chou CL, Stewart GS, et al. Urinary concentrating defect in mice with selective deletion of phloretin-sensitive urea transporters in the renal collecting duct. Proc Natl Acad Sci U S A. 2004;101:7469–7474. doi: 10.1073/pnas.0401704101. [DOI] [PMC free article] [PubMed] [Google Scholar]
- 2.Fenton RA, Flynn A, Shodeinde A, et al. Renal phenotype of UT-A urea transporter knockout mice. J Am Soc Nephrol. 2005;16:1583–1592. doi: 10.1681/ASN.2005010031. [DOI] [PMC free article] [PubMed] [Google Scholar]
- 3.Fenton RA, Knepper MA. Mouse models and the urinary concentrating mechanism in the new millennium. Physiol Rev. 2007;87:1083–1112. doi: 10.1152/physrev.00053.2006. [DOI] [PubMed] [Google Scholar]
- 4.Taniguchi K. Pathologic characterization of hypotensive C57BL/6J-agt: angiotensinogen-deficient C57BL/6J mice. International journal of molecular medicine. 1998;1:583–587. doi: 10.3892/ijmm.1.3.583. [DOI] [PubMed] [Google Scholar]
- 5.Miyazaki Y, Ichikawa I. Role of the angiotensin receptor in the development of the mammalian kidney and urinary tract. Comp Biochem Physiol A Mol Integr Physiol. 2001;128:89–97. doi: 10.1016/s1095-6433(00)00299-3. [DOI] [PubMed] [Google Scholar]
- 6.Takahashi N, Chernavvsky DR, Gomez RA, et al. Uncompensated polyuria in a mouse model of Bartter's syndrome. Proc Natl Acad Sci U S A. 2000;97:5434–5439. doi: 10.1073/pnas.090091297. [DOI] [PMC free article] [PubMed] [Google Scholar]
- 7.Yang B, Ma T, Verkman AS. Erythrocyte water permeability and renal function in double knockout mice lacking aquaporin-1 and aquaporin-3. J Biol Chem. 2001;276:624–628. doi: 10.1074/jbc.M008664200. [DOI] [PubMed] [Google Scholar]
- 8.Nikken JJ, Krestin GP. MRI of the kidney-state of the art. Eur Radiol. 2007;17:2780–2793. doi: 10.1007/s00330-007-0701-3. [DOI] [PMC free article] [PubMed] [Google Scholar]
- 9.Fenchel M, Nael K, Herget-Rosenthal S, et al. Magnetic resonance imaging of renal disease: recent developments and future applications. Nephron Clin Pract. 2006;103:c37–c44. doi: 10.1159/000090607. [DOI] [PubMed] [Google Scholar]
- 10.Laissy JP, Idee JM, Fernandez P, et al. Magnetic resonance imaging in acute and chronic kidney diseases: present status. Nephron Clin Pract. 2006;103:c50–c57. doi: 10.1159/000090609. [DOI] [PubMed] [Google Scholar]
- 11.Perez-Brayfield MR, Kirsch AJ, Jones RA, Grattan-Smith JD. A prospective study comparing ultrasound, nuclear scintigraphy and dynamic contrast enhanced magnetic resonance imaging in the evaluation of hydronephrosis. J Urol. 2003;170:1330–1334. doi: 10.1097/01.ju.0000086775.66329.00. [DOI] [PubMed] [Google Scholar]
- 12.McMann LP, Kirsch AJ, Scherz HC, et al. Magnetic resonance urography in the evaluation of prenatally diagnosed hydronephrosis and renal dysgenesis. J Urol. 2006;176:1786–1792. doi: 10.1016/j.juro.2006.05.025. [DOI] [PubMed] [Google Scholar]
- 13.Choyke PL, Austin HA, Frank JA, et al. Hydrated clearance of gadolinium-DTPA as a measurement of glomerular filtration rate. Kidney Int. 1992;41:1595–1598. doi: 10.1038/ki.1992.230. [DOI] [PubMed] [Google Scholar]
- 14.Sun Y, Zhou J, Stayner C, et al. Magnetic resonance imaging assessment of a murine model of recessive polycystic kidney disease. Comp Med. 2002;52:433–438. [PubMed] [Google Scholar]
- 15.Wallace DP, Hou YP, Huang ZL, et al. Tracking kidney volume in mice with polycystic kidney disease by magnetic resonance imaging. Kidney Int. 2008;73:778–781. doi: 10.1038/sj.ki.5002771. [DOI] [PubMed] [Google Scholar]
- 16.Dear JW, Kobayashi H, Jo SK, et al. Dendrimer-enhanced MRI as a diagnostic and prognostic biomarker of sepsis-induced acute renal failure in aged mice. Kidney Int. 2005;67:2159–2167. doi: 10.1111/j.1523-1755.2005.00321.x. [DOI] [PubMed] [Google Scholar]
- 17.Dwyer TM, Schmidt-Nielsen B. The renal pelvis: machinery that concentrates urine in the papilla. News Physiol Sci. 2003;18:1–6. doi: 10.1152/nips.1416.2002. [DOI] [PubMed] [Google Scholar]
- 18.Schmidt-Nielsen B, Churchill M, Reinking LN. Occurrence of renal pelvic refluxes during rising urine flow rate in rats and hamsters. Kidney International. 1980;18:419–431. doi: 10.1038/ki.1980.155. [DOI] [PubMed] [Google Scholar]
- 19.Carlstrom M, Sallstrom J, Skott O, et al. Hydronephrosis causes salt-sensitive hypertension and impaired renal concentrating ability in mice. Acta Physiol (Oxf) 2007;189:293–301. doi: 10.1111/j.1748-1716.2006.01637.x. [DOI] [PubMed] [Google Scholar]
- 20.Carlstrom M, Wahlin N, Skott O, Persson AE. Relief of chronic partial ureteral obstruction attenuates salt-sensitive hypertension in rats. Acta Physiol (Oxf) 2007;189:67–75. doi: 10.1111/j.1748-1716.2006.01625.x. [DOI] [PubMed] [Google Scholar]
- 21.Fenton RA, Chou CL, Sowersby H, et al. Gamble's ‘Economy of Water’ Revisited: Studies in Urea Transporter Knockout Mice. Am J Physiol Renal Physiol. 2006 doi: 10.1152/ajprenal.00348.2005. [DOI] [PubMed] [Google Scholar]
- 22.Ma T, Yang B, Gillespie A, et al. Severely impaired urinary concentrating ability in transgenic mice lacking aquaporin-1 water channels. J Biol Chem. 1998;273:4296–4299. doi: 10.1074/jbc.273.8.4296. [DOI] [PubMed] [Google Scholar]
- 23.Kim SM, Mizel D, Huang YG, et al. Adenosine as a mediator of macula densa-dependent inhibition of renin secretion. Am J Physiol Renal Physiol. 2006;290:F1016–F1023. doi: 10.1152/ajprenal.00367.2005. [DOI] [PubMed] [Google Scholar]


