Abstract
The literature contains numerous references describing heterogeneity for tumor phenotypes including cell proliferation, invasiveness, metastatic potential and response to therapies. However, data regarding angiogenic heterogeneity are limited. In this study, we investigated the degree of inter-tumoral angiogenic heterogeneity present in head and neck squamous cell carcinomas (HNSCC). In addition, we investigated the biologic relevance that this heterogeneity may have in the context of cytokine directed anti-angiogenic therapy. Keratinocytes were harvested from HNSCC specimens using Laser Capture Microdissection (LCM). Gene expression profiling of the RNA extracted from these specimens demonstrated variability in the expression of angiogenesis-related genes. Hierarchical Clustering and Principal Component Analyses (PCA) demonstrated the presence of unique patient clusters, suggesting that there may be two potentially distinct pathways by which HNSCC induce angiogenesis. Immunohistochemistry for VEGF, IL-8/CXCL8, HGF, and FGF-2, cytokines that play functional roles in HNSCC angiogenesis was performed on the original patient samples as well as a larger panel of normal, dysplastic and HNSCC specimens to validate the heterogeneous expression observed in the gene expression profiling studies. Finally, the therapeutic response of HNSCC tumor xenografts to anti-VEGF therapy was found to be dependent on the amount of VEGF produced by the tumor cells. These findings support the hypothesis of inter-tumoral angiogenic heterogeneity. They imply that there are differences with regard to the specific molecular mechanisms by which individual tumors within the same histologic type induce angiogenesis. Moreover, they demonstrate the need for a more in-depth understanding of the variability of the angiogenic phenotype within a given type of neoplasm when designing cytokine targeted anti-angiogenic therapies. Finally, they suggest that studies in conjunction with ongoing clinical trials that explore the correlation between target expression and clinical outcome are warranted.
Keywords: angiogenesis, cancer, oral, heterogeneity, therapy
Introduction
It has been largely assumed that tumors of a given histological type induce angiogenesis via the same specific molecular mechanism(s). Such a concept is intellectually satisfying for a number of reasons. First, it implies that observations about a given mechanism or angiogenic factor made in one cell line/tumor will be applicable to all cell lines/tumors of that histological type. Secondly, it suggests that therapies designed to combat a specific mechanism of tumor angiogenesis will be effective on other tumors of that type. While such concepts neatly compartmentalize angiogenesis, they are not consistent with other tumor phenotypes. Heterogeneity of tumor phenotypes including cell proliferation, invasiveness, metastatic potential and response to therapies is a well-established principle in cancer biology (1–11). This prompted us to ask if there was evidence for angiogenic heterogeneity in HNSCC as well. While limited, there are data that support the concept of inter-tumoral angiogenic heterogeneity in HNSCC. VEGF expression has been reported to be elevated in both oral dysplasia and head and neck squamous cell carcinomas (HNSCC) (12–16). However, there are also data suggesting that there is interlesional angiogenic variation in HNSCC. For example, using in situ hybridization, Denhart et al, found that 50% of premalignant and 75% of malignant oral lesions expressed increased levels of either VEGF or its receptors (14). This implies that 50% of the premalignant and 25% of the malignant lesions in this study were inducing angiogenesis via an alternative mechanism that did not seem to involve VEGF. In addition, Tae et al found that levels of VEGF in premalignant and malignant oral tissue were lower than in normal tissue (17). However, they did not investigate the expression of other angiogenic factors that might be important. Using an unbiased approach to test the hypothesis of inter-tumoral angiogenic heterogeneity, we sought to determine the global expression profile of angiogenic factors in HNSCC using gene expression profiling in order to more fully characterize the neoplasm’s angiogenic phenotype. Our hypothesis was that, like other tumor phenotypes, the mechanism of how and the degree to which individual neoplasms of the same histologic type induce blood vessel growth is variable. Here, we report that there is a considerable amount of inter-tumoral heterogeneity with regard to the angiogenic factors produced by human HNSCC. In addition, we demonstrate the presence of two major angiogenesis-related clusters of samples, identifying two potentially distinct pathways by which HNSCC induce blood vessel growth. These findings may have profound implications on how we study, diagnose and ultimately design anti-angiogenic therapies for HNSCC as well as other malignancies.
Material and Methods
Cell Lines and Strains
The human HNSCC cell lines SCC-4, SCC-9, and SCC-25 were purchased from the ATCC (Manassas, VA). These cells were grown in DMEM/Ham’s F-12 (1:1) supplemented with 10% fetal bovine serum, hydrocortisone (0.4 μg/ml), penicillin (100 units/ml) and streptomycin (50 ug/ml). The human OSCC-3 HNSCC cell line was established as previously described (18) and grown in DMEM supplemented with 10% fetal bovine serum, penicillin (100 units/ml) and streptomycin (50 μg/ml). Human HNSCC cell lines JSQ-3, SQ20B, SCC-28, SCC-58 and SCC-61 (kindly provided by Ralph Weichselbaum) were grown in DMEM/Ham’s F-12 (1:1) with 20% FBS, hydrocortisone (0.4 μg/ml), penicillin (100 units/ml) and streptomycin (50 ug/ml). The UM SCC-17B HNSCC cell line (kindly provided by Jacques Nor) was grown in DMEM supplemented with 10% FBS, L-glutamine, penicillin and streptomycin. All tissue culture reagents were purchased from Invitrogen (Carlsbad, CA). Normal human keratinocytes were purchased from Cambrex, (San Diego, CA) and cultured in KGM-2. All keratinocytes were cultured at 37°C in a 5% CO2-95% air environment in humidified incubators.
Tissue Samples, Laser Capture Microdissection and RNA Extraction
Primary HNSCC samples were obtained with informed consent from patients undergoing surgery. All samples were immediately embedded in TissueTek OCT medium (Fisher Scientific, Pittsburgh, PA) and frozen at −80°C. Frozen sections were cut at 5–8 um thicknesses and Laser Capture Microdissection (LCM) was performed using the Arcturus PixCell II System (Arcturus, Mountain View, CA). In order to ensure a representative collection of tumor cells from each neoplasm, nests of tumor cells were harvested from multiple regions including the leading center of the tumor as well as the invasive front. Approximately 10,000 cells from a total of 6–10 slides were collected from each tumor sample. Total RNA was extracted from captured cells with the RNeasy Mini Kit (Qiagen, Valencia, CA), treated with DNAse to remove genomic DNA with DNA-Free (Ambion, Austin, TX), and stored at −80°C.
RNA Amplification
Approximately one third of the total RNA collected by LCM was amplified following the high fidelity amplification protocol as previously described (19). One round of amplification was performed to yield enough amplified RNA for microarray hybridization.
Labeling, Hybridization and Scanning of Microarray
The labeling and hybridization procedures were conducted as specified by the manufacturer of the microarray filters (Research Genetics/Invitrogen, Carlsbad, CA). cDNA probes were made from 500 ng of amplified RNA with [33P]-dATP (Amersham Biosciences, Piscataway, NJ) by oligo dT-primed polymerization using SuperScript II Reverse Transcriptase (Invitrogen, Carlsbad, CA). ResGen™ GeneFilters® microarray GF211 (Human ‘Named Genes’ GeneFilters Microarrays) from Research Genetics was used. The microarray filters were hybridized with denatured probe overnight, washed and exposed to phosphorimager screens. The images were scanned by a Molecular Dynamics Storm Imager (Packard, Meriden, CT) at 600 dpi resolution, and the raw intensity signal data was generated with Pathways II Software.
Data Analysis
Raw image files were converted into numerical values using Pathways II software (Research Genetics). Pre-processing of the raw expression data, which included normalization and filtering, was performed on all samples before any data analysis. This standardization was based on the intensity of internal control spots and genes with low overall variance across all of the samples were removed since they were of limited interest. The Kruskal-Wallis test, a non-parametric method, was used to determine those genes that were differentially expressed across the three groups, and the Wilcoxon rank-sum test was used for pairwise comparisons.
Hierarchical clustering was performed using Cluster software on standardized data and expression maps of clustered genes were created using TreeView (both available at http://rana.lbl.gov/EisenSoftware.htm). Clusters were created using the algorithm of Eisen et al. This algorithm sorts through all the data to find pairs of genes that behave most similarly in each experiment and then progressively adds other genes to the initial pairs to form clusters of potentially similar behavior. In the expression maps, each square represents the expression level of a single transcript in a single sample; red and green, transcript levels above and below, respectively, the median for that gene across all of the samples. Color saturation is proportional to the magnitude of the difference from the mean.
For the Principal Component Analysis (PCA) of the samples, the average background was subtracted from the raw intensity value for each gene. The total mean expression values were calculated for each microarray. The array with a mean expression value closest to the average of all 13 mean expression values was chosen as the reference array. The microarrays were normalized by fitting a linear regression between the expression values for each microarray and the expression values for the reference microarray and dividing by the value of each regression coefficient for that microarray. Either the entire gene list or the 114 angiogenesis-related genes on the microarray were selected, and the filtered data matrix was mean-centered and scaled and PCA performed using Matlab (Mathworks, Natick, MA).
Immunohistochemistry on Human Tumor Samples
For the original snap-frozen biopsy samples, tissues were sectioned at 5 μm thicknesses and fixed in cold acetone. Endogenous peroxidase activity was quenched in 3% hydrogen peroxide and proteins were blocked with 1% BSA/Tris-PBS. Rabbit polyclonal antibodies for VEGF (Santa Cruz Biotechnology, Santa Cruz, CA) and IL-8/CXCL8 (Endogen, Woburn, MA) were used at 1:75 and 1:50 dilutions, respectively. Antibody binding was visualized with anti-rabbit polymer labeled HRP bound secondary reagent (EnVision+, DAKO, Carpinteria, CA), developed with DAB chromogen and counterstained with Hematoxylin. For CD31 detection, the primary antibody PECAM (Santa Cruz Biotechnology, Santa Cruz, CA) was applied at 1:100 dilution. Antibody binding was visualized using the LSAB Kit (DAKO, Carpinteria, CA) and counterstained with Hematoxylin. Corresponding negative control experiments were performed by omitting the incubation step with the primary antibody. For the archival samples, formalin fixed paraffin embedded Tissue Microarrays (TMAs), immunohistochemistry was performed following the manufacturer’s recommendations with minor modifications. For the detection of VEGF and IL-8/CXCL8, deparaffinized sections were microwaved in citrate buffer, and primary antibody applied for 1 Hr at room temperature at dilutions of 1:100 and 1:50 respectively. For the detection of FGF-2 and HGF, deparaffinized slides were placed in a decloaking chamber using ET buffer, and primary antibody applied for 1 Hr at room temperature at a dilutions of 1:100 and 1:50 respectively. Antibody binding was visualized using the rabbit EnVision+ kit (DAKO, Carpinteria, CA). Corresponding negative control experiments were performed by omitting incubation with primary antibody. The primary antibodies VEGF, Catalog # sc-15, IL-8/CXCL8 Catalog # sc-7922, FGF-2 Catalog # sc-79, and HGF-Catalog # sc-7949 were purchased from Santa Cruz Biotechnology (Santa Cruz, CA).
Immunohistochemistry for Mouse Tumor Xenografts
CD31 detection was achieved using the primary antibody (Santacruz, Santa Cruz, California, USA; Catalog #: sc-1506). Retrieval was performed on the deparaffinized sections using citrate buffer in a microwave. The antibody was applied at a 1:200 dilution in PBS for 1 Hr at room temperature. The biotinylated secondary antibody (Dako Labeled Streptavidin-Biotin kit, Carpinteria, California, USA; Catalog #: x0590) was applied for 30 minutes, followed by incubations with Vectastain Elite ABC Reagents (Vector Laboratories, Burlingame, California, USA; Catalog # PK-6105). For determination of cell proliferation, sections were treated in citrate buffer using a decloaking chamber, incubating at a 1:1 dilution using PCNA antibody (Zymed, San Francisco, California, USA; Catalog #: 93-1143) for 1 hour followed by streptavidin-peroxidase. Apoptotic cells were detected using an antibody to cleaved caspase-3 (Biocare Medical, Walnut Creek, California, USA; Catalog #: CP229A). The detection of Caspase-3 was achieved by using deparaffinized sections in a decloaking chamber with citrate buffer, and primary antibody applied for 1 Hr at room temperature at a dilution of 1:25. Antibody binding was visualized with anti-rabbit polymer labeled HRP bound secondary reagent (EnVision+, DAKO, Carpinteria, CA). All three immunohistochemistry stains were developed with DAB chromogen and counterstained with Hematoxylin.
Scoring of Immunohistochemistry
A combined scoring method that accounts for intensity of staining as well as percentage of cells stained was employed for the evaluation of VEGF, IL-8/CXCL8, HGF, and FGF-2 as previously described (20). Strong, moderate, weak and negative staining intensities were scored as 3, 2, 1, and 0 respectively. For each of the intensity scores, the percentage of cells that stained at that level was estimated visually. The resulting combined score consisted of the sum of the percentage of stained cells multiplied by the intensity scores. For example, a case with 10% weak staining, 10% moderate staining and 80% strong staining would be assigned a score of 270 (10 x 1 + 10 x 2 + 80 x 3= 270) out of a possible score of 300.
The determination of microvessel density (MVD) using CD31 as a marker was performed as previously described (21–24). Briefly, using low power magnification, the region containing the most intense area of tumor neovascularization was chosen for counting in each of the tumors. For the normal control tissue, MVD was determined by finding the most intense area of neovascularization directly below the overlying mucosa. Individual microvessels were counted using a 100x field (10x objective lens and 10x ocular lens). Any brown staining endothelial cells that were clearly separate in appearance were counted as individual vessels. Ten random fields within this hotspot area were viewed and counted at 100x. Results were expressed as the total number of microvessels observed in the “hot spot” region of each individual tumor. The proliferating and apoptotic cells were counted at high power (400x) and expressed as a percentage of the total number of cells.
Generation of Conditioned Media and VEGF ELISA Assay
Conditioned media (CM) was generated from normal keratinocytes and HNSCC cell lines by rinsing cells with DME three times and then incubating the cells in DME/F-12 or DME with 1% FBS for 24 hours. The media was collected, centrifuged and the supernatant stored at −80°C until use. Protein concentrations were determined using the Coomassie Protein Assay Reagent 23200 (Pierce Biomedical Company, St. Louis, MO). The levels of VEGF present in the CM from each sample were determined in duplicate using the Quantikine Immunoassay kit (R&D Systems, Minneapolis, MN) according to the manufacturer’s instructions. Concentration of VEGF expression was interpolated from a standard curve derived from assaying recombinant VEGF. Each sample was tested in two separate experiments. The average of the two assays is presented. Individual assays of the same sample varied from one another by less than 10%.
In vivo Anti-angiogenic Therapy
Eight-week old athymic nude mice were injected subcutaneously with 5x10⁶ cells (OSCC-3 and SQ-20B) in the right hind leg. Prior to the initiation of anti-VEGF therapy, tumors were allowed to grow to an average volume of ~200 mm3 after which the mice were divided into three experimental groups (n= 10 animals per treatment group) and treatment started. Group one was treated with 100μg anti-human VEGF antibody (R&D Systems, Minneapolis, MN), group two with a nonspecific human IgG control antibody (Sigma, St. Louis, MO) and group three with PBS. Treatments were administered intra-peritoneally on Days 0, 3, 6, and 9, and tumor volumes were measured until Day 12 following protocols previously published (25).
Statistical Analysis
For the in vivo tumor studies, the data was analyzed using a repeated measures analysis of variance (ANOVA) with a Greenhouse-Geisser adjustment.
RESULTS
Distinct Angiogenic Subtypes in HNSCC
In order to characterize the global expression profile of angiogenic factors in HNSCC, malignant keratinocytes from 13 HNSCC specimens were harvested using LCM. The basic demographics for these patients are listed in Table 1. Total RNA was then extracted, labeled and used to probe nylon cDNA microarray filters that contained a total of ~4,000 genes. The analysis of the resultant data was based on an analysis of the entire gene set as well as a subset of 114 angiogenesis-related genes that were present on the filters (please see Supplemental Tables 1 and 2).
Table 1.
Clinical Characteristics of HNSCC Tissue Samples Used in This Study
| Specimen | Location | Age | Sex | TNM Stage | ||
|---|---|---|---|---|---|---|
| T | N | M | ||||
| 3-ca | Oral cavity-tongue | 50 | F | 2 | 0 | 0 |
| 8-ca | hypopharynx-pyriform | 77 | M | 4 | 0 | 0 |
| 9-ca | Oral cavity-floor of mouth | 76 | F | 2 | 2c | 0 |
| 10-ca | Oral cavity-floor of mouth | 70 | F | 4 | 0 | 0 |
| 11-ca | Oral cavity-floor of mouth | 81 | F | 4 | 0 | 0 |
| 12-ca | Oral cavity-retromolar | 55 | M | 4 | 0 | 0 |
| 13-ca | Base of tongue | 64 | M | 3 | 2c | 0 |
| 14-ca | Larynx-glottic | 76 | M | 3 | 0 | 0 |
| 15-ca | Oral cavity-floor of mouth | 56 | M | 2 | 0 | 0 |
| 16-ca | Oral cavity-retromolar | 78 | F | 2 | 0 | 0 |
| 20-ca | Oral cavity-floor of mouth | 48 | M | 4 | 1 | 0 |
| 22-ca | Oral cavity-floor of mouth | 65 | M | 4 | 0 | 0 |
| 30-ca | Base of tongue | 43 | M | 2 | 2a | 0 |
| 32-ca | Oral cavity-retromolar | 64 | F | 3 | 1 | 0 |
| 36-ca | Base of tongue | 38 | M | 3 | 2c | 0 |
Supervised hierarchical clustering using the 114-gene angiogenesis set was used to group the tumor expression profiles to one another on the basis of their overall similarity, resulting in the segregation of the patients into two major groups (Figure 1). A number of important secreted angiogenic factors segregated with each of the two clusters. For example, tumors in Cluster A tended to express higher levels of VEGF and FGF-2 and relatively low levels of IL-8/CXCL8 and HGF. Conversely, tumors within Cluster B tended to express low levels of VEGF and FGF-2, and higher levels of IL-8/CXCL8 and HGF.
Figure 1.
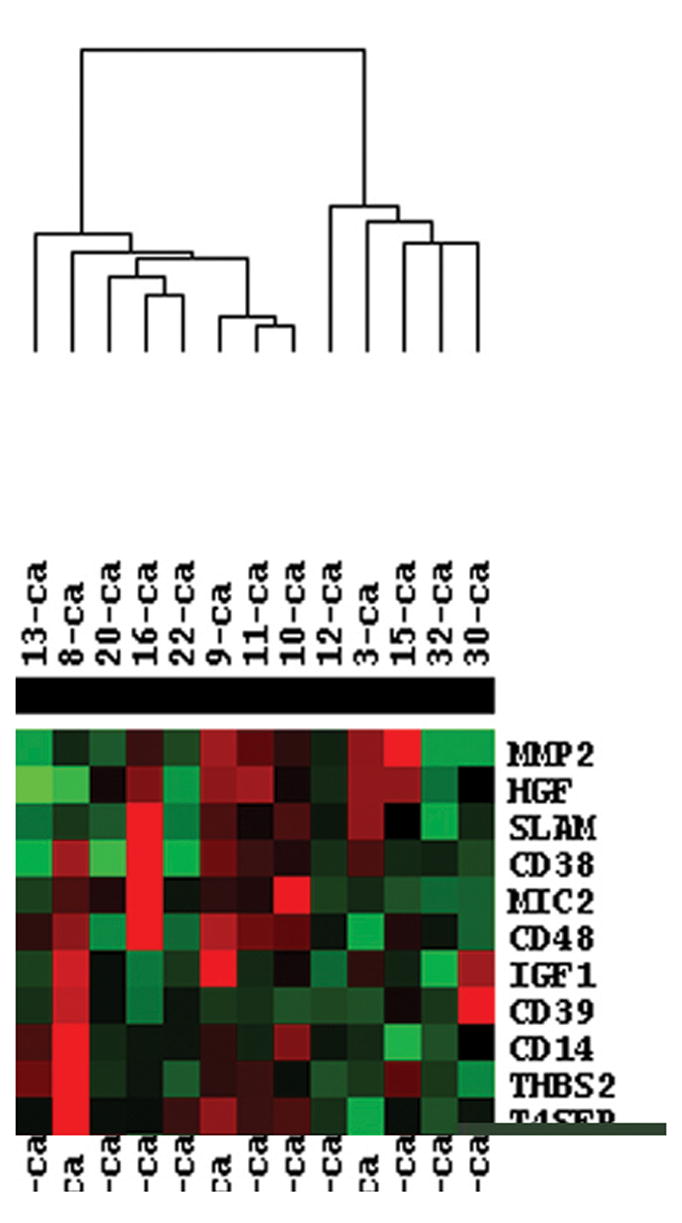
TreeView map of differentially expressed genes of LCM harvested HNSCC cells. CDNA from 13 HNSCC samples were hydridized to nylon microarray filters containing 9,184 genes. The data was then analyzed using the Kruskal-Wallis and Wilcoxon rank-sum tests, to identify differentially expressed genes. Hierarchical clustering was then performed using Cluster software on standardized data and expression maps of clustered genes were created using TreeView focussing specifically on the 114 angiogenesis related genes. Upregulated genes are shown in red, while downregulated genes are shown in green.
Using the same entire gene set and the 114 angiogenesis-related gene set, the tumors were then reclustered by PCA, which reduces the dimensionality of complex data and displays the structure of the data on a reduced space. The dimensional reduction is obtained through linear transformations of the original data into orthogonal “components”. The PCA clustering of the 13 HNSCC samples using the angiogenesis gene list revealed the presence of two major clusters of patient samples along with a third distinct, solitary sample (Figure 2A). PCA analysis was also performed on the entire data set to determine if the angiogenesis related genes represented a potentially key program for distinguishing between tumors. Contrary to the angiogenesis PCA analysis, the PCA clustering of the entire gene set demonstrated considerably less distinct clustering (Figure 2B). This result led to the hypothesis that the two unique clusters of tumors may be different in terms of their ability to stimulate angiogenesis in vivo. In order to test this hypothesis, we quantified the microvessel densities (MVD) of the neoplasms as a surrogate marker for their expression of the angiogenic phenotype. Tumors from Cluster A had a significantly higher level of MVD compared to Cluster B or control normal mucosa (Figure 3), with Cluster A tumors having a mean MVD of 85.6 ± 4.3, and Cluster B a mean of 52 + 3.6 (p<0.0001). Taken together, these data support the hypothesis that there is inter-tumoral heterogeneity with respect to the angiogenic factors being produced by a given HNSCC neoplasm. It also suggests that there are two potentially distinct pathways by which HNSCC may induce blood vessel growth. Finally, it suggests that there is a correlation between the type of angiogenic factors produced by a given tumor and the degree of in vivo angiogenesis observed in HNSCC.
Figure. 2.
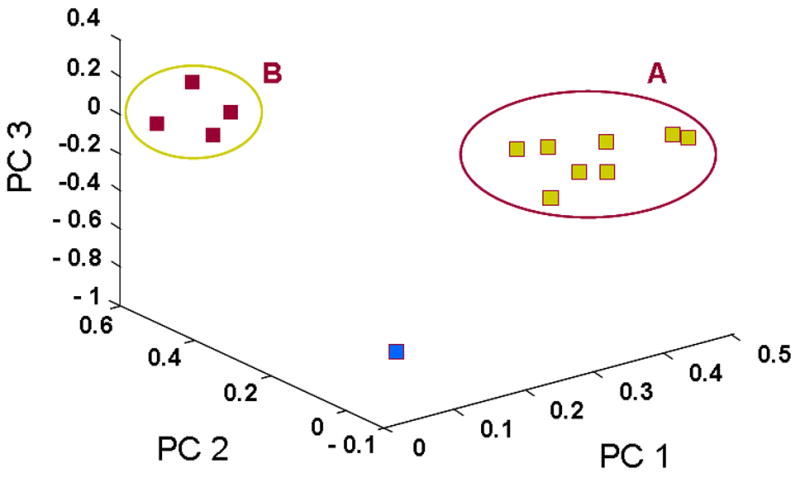
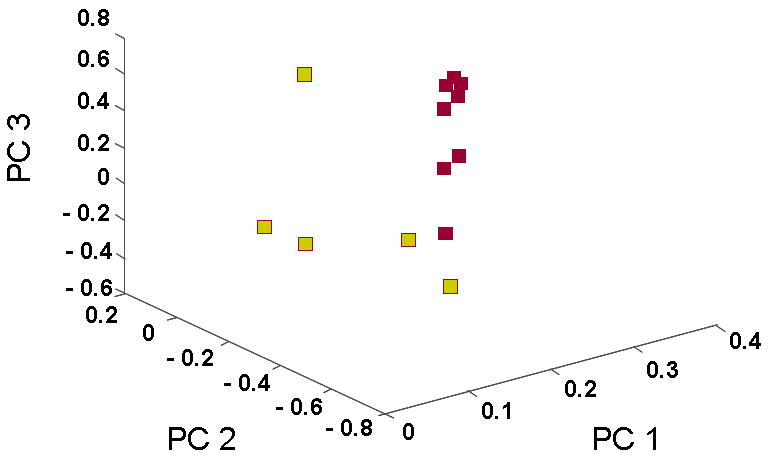
Principal Component Analysis (PCA) of HNSCC samples using the angiogenesis gene list or the entire gene list. The PCA clustering using the angiogenesis gene list revealed the presence of two major clusters of patient samples along with a third distinct, solitary sample (Figure 2A). PCA analysis using the entire data set demonstrated less distinct clustering suggesting that the angiogenesis related genes represented a potentially key program for distinguishing between tumors (Figure 2B).
Figure. 3.
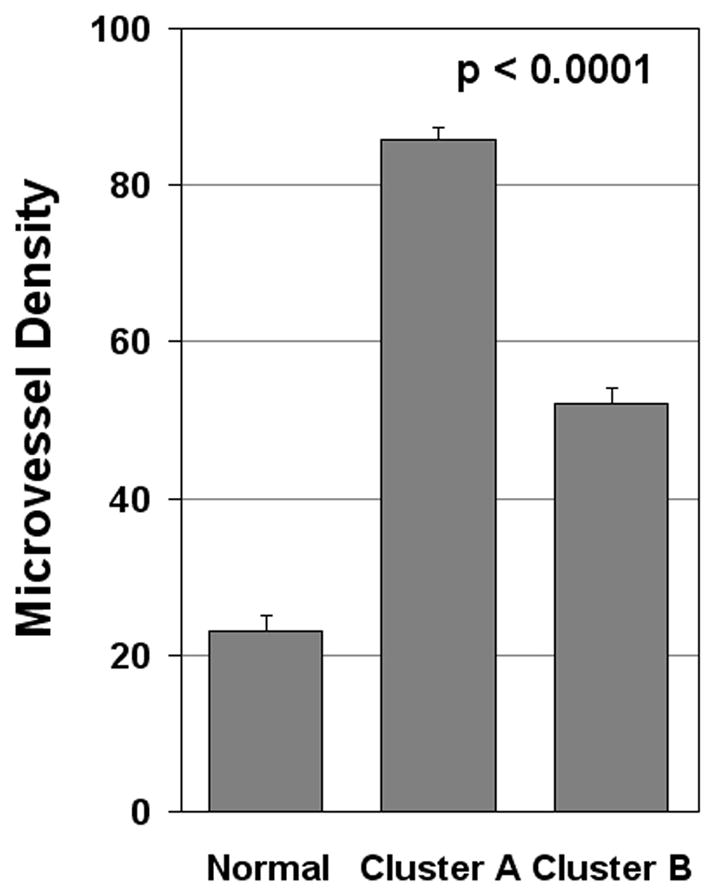
Variable in vivo angiogenic expression profiles by HNSCC samples as determined by microvessel density (MVD). HNSCC tumor samples were immunostained with anti-CD31, and MVD was quantified by counting the number of vessels present in the regions containing the most intense area of tumor neovascularization. Normal oral mucosa from patients who had biopsies for unrelated reasons were used as controls. Each column represents means ± SE.
Inter-tumoral Heterogeneity of Angiogenesis-Related Genes in HNSCC
In order to validate some of the microarray data and investigate the specific sources of the global angiogenic heterogeneity observed in HNSCC, we initially focused on IL-8/CXCL8, VEGF, FGF-2 and HGF for a number of reasons. First, these cytokines are known to play important roles in the induction of angiogenesis in HNSCC (reviewed in 26, 27). Secondly, the gene expression data from the HNSCC tumor samples suggested that there was a considerable amount of inter-tumoral variability in the production of message for these cytokines. In addition, each of the factors was elevated in one of the clusters, with VEGF and FGF-2 highly expressed in Cluster A, and IL-8/CXCL8 and HGF highly expressed in Cluster B. Validation of the initial microarray data was performed by determining the protein expression of these angiogenic factors in two different cohorts of HNSCC patients. First, immunohistochemistry was performed on frozen sections from the original 13 HNSCC samples that were used for the microarray studies. Because of the limited size of the original 13 frozen samples, immunohistochemical analysis was limited to VEGF and IL-8/CXCL8. The immunohistochemical analysis demonstrated considerable variability in the protein expression levels of VEGF and IL-8/CXCL8 among these initial tumor samples (Figure 4, Table 2). Importantly, the IHC data correlated with the array data for VEGF and IL-8/CXCL8 (Figure 4). To further validate the array findings, IHC was performed on additional formalin fixed paraffin embedded archival specimens assembled onto tissue microarrays (TMA) that contained a histologic diagnosis of normal (n=74), dysplasia (n=73), or HNSCC (n=223). For these TMAs, IHC was performed for VEGF, IL-8/CXCL8, HGF and FGF-2. Normal oral mucosa rarely expressed VEGF (5%), IL-8/CXCL8 (2%), FGF-2 (0%), and HGF (0%). In addition, when present, the relative levels of expression in the normal oral mucosa were low compared to the dysplastic and malignant oral mucosal lesions (Table 3). The dysplastic oral mucosa had a higher incidence of expression as well as higher levels of VEGF (42%), IL-8/CXCL8 (23%), FGF-2 (15%), and HGF (11%) expression (Table 3). Finally, the incidence of VEGF (72%), IL-8/CXCL8 (55%), FGF-2 (40%), and HGF (30%) protein expression as well as the intensity of expression was greatest in the HNSCC samples (Table 3). These data also validate the findings from the initial cohort of HNSCC samples and underscore the presence of heterogeneity of angiogenic factors secreted by HNSCC.
Figure. 4.
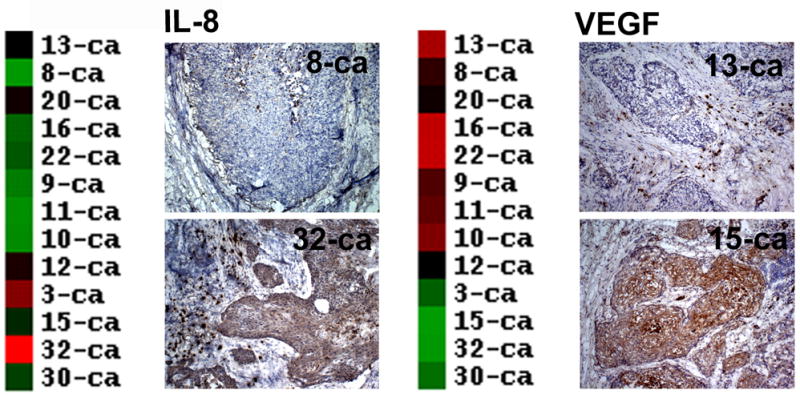
Validation of IL-8 and VEGF microarray expression in HNSCC tissue samples by immunohistochemistry. Panels represent examples of immunohistochemical staining for IL-8 (Panel A) and VEGF (Panel B), along with their corresponding cDNA microarray profiles. The results demonstrate the marked variability in the production of these two important angiogenic cytokines by different HNSCC samples.
Table 2.
Heterogeneity of Angiogenic Factor Expression in Normal, Dysplastic and Malignant Oral Mucosa.
| Specimen | IL-8/CXCL-8 | VEGF |
|---|---|---|
| Cluster A | ||
| 13-ca | 0 | 290 |
| 8-ca | 0 | 250 |
| 20-ca | 15 | 275 |
| 16-ca | 20 | 280 |
| 22-ca | 0 | 150 |
| 9-ca | 0 | 170 |
| 11-ca | 0 | 290 |
| 10-ca | 20 | 285 |
| Cluster B | ||
| 3-ca | 270 | 0 |
| 15-ca | 120 | 25 |
| 32-ca | 280 | 30 |
| 30-ca | 135 | 0 |
| Normal | ||
| NOM-1 | 15 | 0 |
| NOM-2 | 0 | 0 |
| NOM-3 | 0 | 20 |
| NOM-4 | 0 | 0 |
| NOM-5 | 0 | 0 |
Table 3.
Heterogeneity of Angiogenic Factor Expression in Normal, Dysplastic and Malignant Oral Mucosa.
| Specimen | Scoring | VEGF | IL-8/CXCL8 | HGF | FGF-2 |
|---|---|---|---|---|---|
| High* | 0 | 0 | 0 | 0 | |
| Normal (n = 74) | Medium* | 4 | 2 | 0 | 0 |
| Low* | 70 | 72 | 74 | 74 | |
| High* | 1 | 0 | 0 | 0 | |
| Dysplasia (n = 73) | Medium* | 30 | 17 | 8 | 11 |
| Low* | 42 | 56 | 65 | 62 | |
| High* | 101 | 71 | 30 | 41 | |
| HNSCC (n = 223) | Medium* | 60 | 51 | 36 | 48 |
| Low* | 62 | 101 | 157 | 134 |
Specimens were designated based upon their scoring as follows: Low = 0–100, Medium = 101–200, and High = 201–300. The scoring method, as described in the Material and Methods section, accounts for both intensity of staining as well as percentage of stained cells.
Angiogenesis Expression Profile and Therapeutic Outcome
In addition to raising mechanistic questions regarding the molecular differences underlying inter-tumoral variability of angiogenic phenotype between individual cases of HNSCC, these findings lead one to consider the potential clinical implications of this observation. Specifically, we hypothesized that anti-angiogenic therapies based upon the blockade/neutralization of a specific angiogenic molecule, such as VEGF, would result in the lack of or a muted clinical response in certain subsets of patients because the target of therapy was not the predominant angiogenic factor produced by a particular neoplasm. We chose VEGF as our proof of principle molecule because therapies targeted VEGF have been approved by the FDA for certain malignancies and is under extensive investigation in a myriad of clinical trials for other anatomic sites. To test our hypothesis, we screened a number of HNSCC cell lines using ELISA in order to identify HNSCC cell lines that were either high or low producers of VEGF. Compared to normal keratinocytes, the OSCC-3 cell line was found to be the highest, whereas the SQ20-B and SCC-17B cell lines produced some of the lowest levels of VEGF protein (Figure 5A). It was also known that these tumor cell lines were sufficiently capable of growing in nude mice. We therefore established tumor xenografts of OSCC-3, SQ20-B and SCC-17 B cells in eight-week old athymic nude mice in order to compare the ability of anti-VEGF antibodies to inhibit the growth of these tumors in vivo. Prior to the initiation of anti-VEGF therapy, tumors were allowed to grow to an average volume of 200 mm3 after which the mice were randomized into three experimental groups (n= 10 animals per treatment group) and treatment initiated. Group one was treated with 100μg anti-human VEGF antibody, group two with a nonspecific human IgG control antibody and group three with PBS. All treatments were administered intraperitoneally on Days 0, 3, 6, and 9, and tumor volumes were measured until Day 12. Treatment of mice with anti-VEGF antibodies markedly inhibited the growth of the OSCC-3 tumor xenografts (Figure 5B), while treatment with either PBS or the nonspecific IgG did not alter tumor growth rates. At day 12, the mean tumor volumes from the VEGF treated mice were 1531 mm3 ± 776 mm3, while tumor volumes for the PBS and IgG treated mice were 3287 mm3 ± 1202 mm3 and 3021 mm3 ± 1147 mm3 respectively. There was a statistically significant interaction between group and time (p<0.001). Comparisons between groups, at each time point separately, were then made using ANOVA. There was not a statistically significant difference between groups at Day 0 (p=0.96). There was a significant difference between groups at Day 3 (p=0.03) with even more significant differences at Day 6 (p=0.001), Day 9 (p=0.008), and Day 12 (p=0.004). The observed differences were due to the differences in tumor volume between the VEGF versus PBS and the VEGF versus IgG groups. These data suggest that the inability of the OSCC-3 bearing mice treated with anti-VEGF to grow beyond a certain threshold in size was not due to a direct inhibition of tumor cell proliferation itself. Rather, it was likely due to the direct inhibition of tumor angiogenesis. Conversely anti-VEGF treatment had limited effect on the growth of the SQ20-B xenografts compared to the PBS and IgG treated mice (Figure 5C). Tumor volumes from the VEGF treated mice were 1195 mm3 ± 785 mm3, while tumor volumes for the PBS and IgG treated mice were 1461 mm3 ± 551 mm3 and 1574 mm3 ± 821 mm3 respectively. There was weak evidence for an interaction between group and time (p=0.07). Comparisons between groups, at each time point separately, were then made using ANOVA. There was not a statistically significant difference between groups at Day 0 (p=0.98), Day 3 (p=0.50), Day 6 (p=0.08) and Day 9 (p=0.10) or Day 12 (p=0.37). Similarly, anti-VEGF treatment demonstrated a modest effect on the growth of the SCC-17B xenografts compared to the PBS and IgG treated mice on Day 12 (Figure 5D). Tumor volumes from the VEGF treated mice were 238.5 mm3 ± 76.9 mm3, while tumor volumes for the PBS and IgG treated mice were 432.5 mm3 ± 219.5 mm3 and 548.6 mm3 ± 284.6 mm3 respectively. The interaction between group and time was not statistically significant (p=0.19). Additionally, the group main effect was also not significant (p=0.31). Thus, there was no evidence found for a difference in tumor volume change, or in tumor volume averaged over time, between groups. Since there was not a significant interaction or group main effect, comparisons between groups at each time point separately were not performed. However, the change in tumor volume from day 0 to day 12 was also examined and no statistically significant difference between groups based on this summary measure was found (p=0.07 from ANOVA).
Figure. 5.
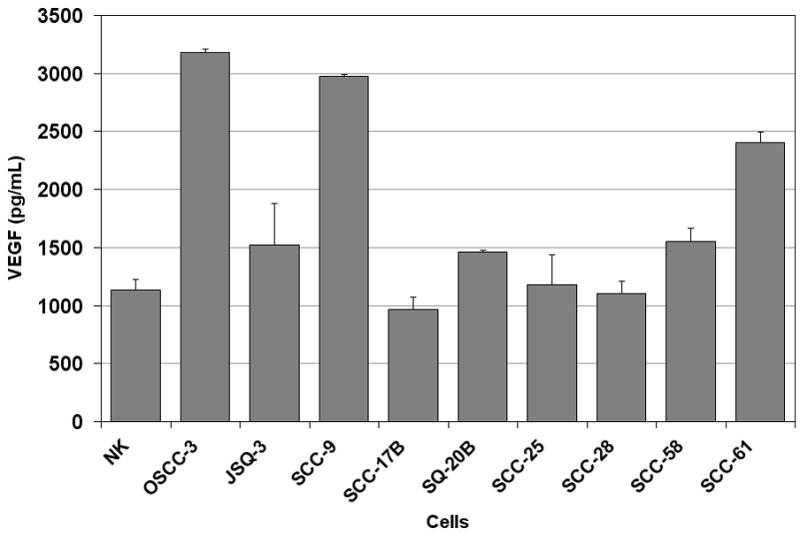
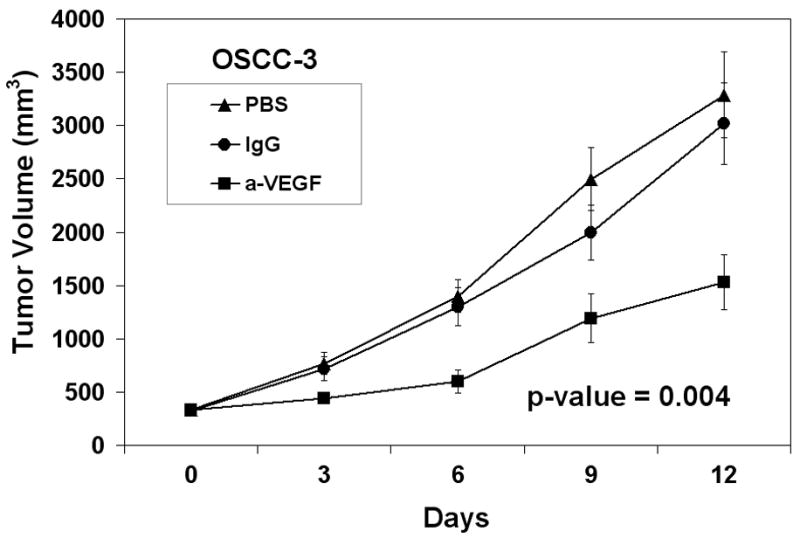
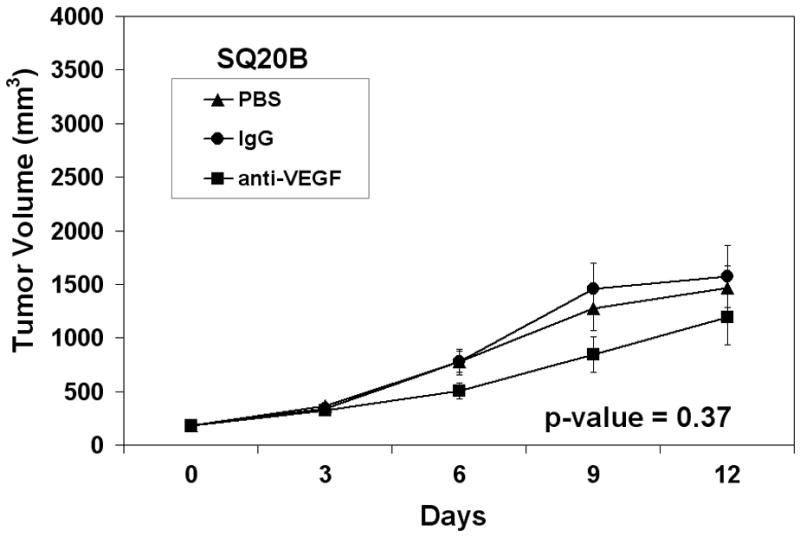
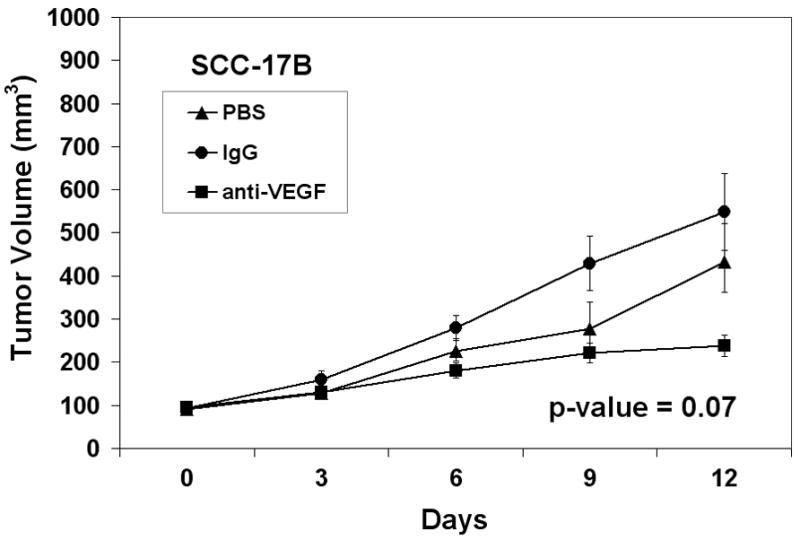
Therapeutic effect of in vivo anti-VEGF therapy on HNSCC tumor xenografts is dependent on the levels of VEGF expressed by the tumor cells. (A) ELISA data demonstrating the expression levels of VEGF protein from the serum free conditioned media from human oral squamous cell carcinoma cell lines as well as a keratinocyte cell strains. Panel B represents the growth curve of OSCC-3 (a high VEGF producing cell line) when treated with PBS, IgG or anti-VEGF. Panel C represents the growth curve of SQ20-B (a low VEGF producing cell line) when treated with saline, IgG, or anti-VEGF (n=10 animals per treatment group). Panel D represents the growth curve of SCC-17B (a low VEGF producing cell line) when treated with saline, IgG or anti-VEGF (n=10 animals per treatment group).
To confirm our hypothesis that the inhibition of tumor growth was due to a direct effect of anti-VEGF therapy on the tumor microvasculature, we used the surrogate markers of microvessel density, proliferation, and apoptosis indices of the tumor samples. For the OSCC-3 xenografts (a high VEGF secreter), tumors from all three treatments (PBS, IgG and anti-VEGF) had proliferation indices that were similar (Figure 6). However, the tumor treated with anti-VEGF demonstrated a significantly higher apoptotic index when compared to either the PBS or the IgG treated animals (Figure 6). Similarly, while the PBS and IgG treated animals demonstrated a robust microvessel density, the anti-VEGF treated animals were more sparsely located in the xenograft. For the SQ-20B xenografts (a low VEGF secreter), tumors from all three treatments had high rates of tumor cell proliferation and microvessel density counts with low apoptotic indices (Figure 6).
Figure 6.
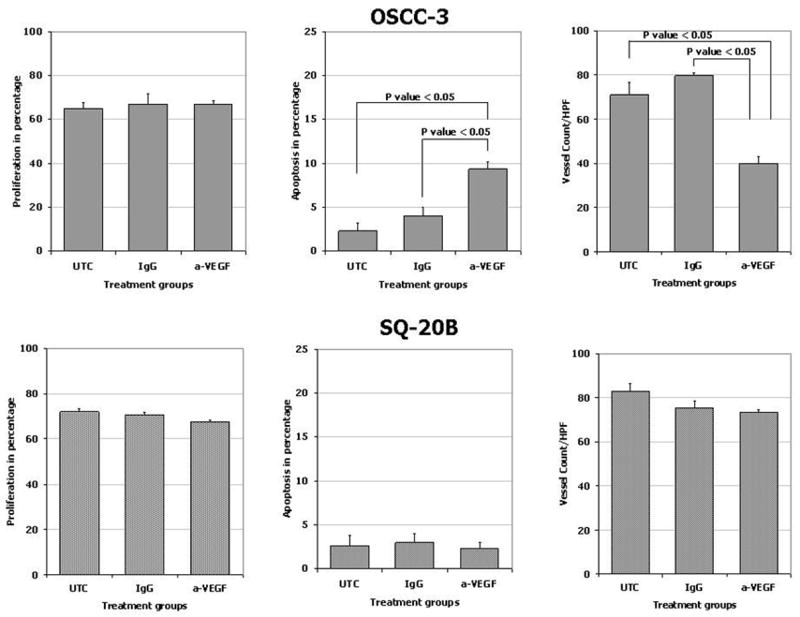
In vivo effects of anti-VEGF therapy on proliferation, apoptosis and microvessel density on HNSCC expressing different levels of VEGF. Tumor xenografts consisting of either OSCC-3 (a high VEGF producing cell line) or SQ20-B (a low VEGF producing cell line) were treated with either PBS, IgG or anti-VEGF. Tumor tissue was subsequently harvested, fixed in 10% buffered formalin, and paraffin embedded. Immunohistochemistry for CD31, PCNA and caspase 3 were performed to determine microvessel density, proliferation index and rate of apoptosis (n=10 animals per treatment group).
Taken together, these data underscore the need for a clearer understanding of angiogenic heterogeneity within HNSCC, particularly with the advent of targeted therapies. In addition, these data suggest that ongoing clinical trials may be observing less than optimal treatment outcomes and that these outcomes may be improved by prospectively determining if the molecular target of the therapy is produced at sufficient levels to warrant treatment with that specific therapy.
DISCUSSION
Like all solid tumors, HNSCC must develop direct and indirect mechanisms to induce the production of new blood vessels. Several dozen candidate angiogenic molecules are produced by keratinocytes and by HNSCC (reviewed in 26, 27). However, the majority of studies have only explored the expression of a single angiogenic factor in a cohort of HNSCC specimens or cell lines. To date, there are limited studies that have investigated the simultaneous expression of multiple angiogenic factors in HNSCC (18, 28–30). Furthermore, these studies have been done with relatively small sample sizes of cell lines or patients samples. Therefore, our knowledge of the spectrum and variability of angiogenic factors in this neoplasm is quite limited, and this may have a profound impact on our understanding of the tumor biology as well as our ability to develop well-designed targeted therapies. In this study, we performed gene expression profiling experiments on LCM harvested keratinocytes from HNSCC tumor samples in order to obtain global signatures of angiogenesis related genes. Here we report the finding of variability in the expression of 114 angiogenesis-related genes in HNSCC. In particular, a considerable amount of inter-tumoral variation in the expression of VEGF, IL-8/CXCL8, FGF-2 and HGF, important angiogenic factors in HNSCC, was observed. Given the relatively large number of different angiogenic factors that have been reported to be expressed by HNSCC (26,27) it was somewhat surprising that only four of these appeared to be the most commonly found to be over expressed. While this does not necessarily decrease the potential importance of other cytokines/growth factors in a given tumor, it does suggest that VEGF, IL-8, FGF-2 and HGF are critically important globally in the induction of HNSCC related angiogenesis. The changes observed in the gene expression profiling experiments involving the original tumor samples were subsequently validated by IHC in these samples as well as a larger cohort of 370 samples containing normal, dysplastic and malignant keratinocytes. In addition, we demonstrated by PCA the presence of tumors with two potentially distinct molecular subtypes, suggesting that there may be two unique global mechanisms by which HNSCC induce angiogenesis. Furthermore, evaluation of the in vivo angiogenesis index of these two clusters using MVD analysis demonstrated that there was a correlation between the angiogenesis gene profile of the tumors and their ability to stimulate blood vessel growth. Specifically, Cluster A, which expressed higher levels of VEGF and FGF-2, had a higher angiogenic index than Cluster B, which expressed lower levels of VEGF and FGF-2 and relatively higher levels of alternative angiogenesis related genes such as IL-8/CXCL8 and HGF. The co-expression of these cytokine groups may be related to common mechanisms regulating their expression in HNSCC (31–35). An important question is whether the differences in the angiogenesis-related genes expressed and the subsequent differences in MVD between the two clusters correlates with the clinical course. Unfortunately, owing to the fact that these were unlinked cases there was a lack of followup information and we were therefore unable to address this issue at this time. However, these questions are currently be pursued in a new cohort of patients in a prospective fashion at this time.
Whether or not angiogenesis occurs in a particular tissue depends upon the balance between the relative amounts of molecules that induce and molecules that inhibit angiogenesis (31). In normal tissues, blood vessels are usually quiescent and cells usually secrete low levels of inducers and high levels of inhibitors. As normal cells progress towards malignancy, they must develop the ability to induce angiogenesis. In order to achieve this switch, tumor cells usually increase the amount of inducers and decrease the amount of inhibitors they secrete. There is considerable interest in determining how cells, progressing from normal to tumorigenic, switch from being anti-angiogenic to angiogenic. In some animal models a distinct switch to the angiogenic phenotype is seen (32). In other cases the cells developing into tumors sequentially become more angiogenic in a step-wise fashion (33, 34). The exact mechanisms regarding how this occurs in most neoplasms is still unclear. However, a growing body of evidence suggests that the activation of oncogenes as well as the inactivation of tumor suppressor genes play an important role in this phenotypic switch. For example, expression of VEGF can be stimulated by various oncogenic stimuli such as ras, v-src, c-fos, and c-jun (35-38). Similarly, IL-8/CXCL8 expression can be induced by Ets-1 and ras (39, 40). Alternatively, inactivation of the p53, VHL and RB2/p130 TSGs results in increased VEGF production (36, 41 and 42), while p53 and MEF (ELF4) have been shown to down regulate the expression of IL-8/CXCL8 (43, 44). At this time, we do not know which of these genetic alterations may play a role in the modulation of VEGF and IL-8/CXCL8 in HNSCC. Additional investigation is required to provide a mechanistic link between alterations of various oncogenes and TSGs important in HNSCC and the angiogenic heterogeneity that is observed in this neoplasm. It was surprising to note in this study that we did not appreciate a significant alteration in the expression of known inhibitors of angiogenesis when comparing expression profiles between normal and malignant oral keratinocytes. The reasons for this are unclear. However, we are currently pursuing possible mechanistic explanations for this observation.
The in vivo animal studies reported here suggest that the clinical response of a given targeted anti-angiogenic therapy, such as VEGF, is largely dependent on the expression of the target by the tumor itself. Anti-VEGF treatment of HNSCC tumor xenografts secreting high levels of VEGF inhibited tumor growth, while anti-VEGF treatment had limited effect on the growth of xenograft tumors of HNSCC producing low levels of VEGF. Because the status of VEGF expression of the tumor cell lines used in these experiments was known prior to treatment, one may argue that the outcome of this treatment was predictable and we would agree. However, the key point to be made is that ongoing anti-angiogenic clinical trials typically do not include patient inclusion/exclusion criteria that require the prospective determination of whether or not a specific tumor is producing the angiogenic factor that is the target of the intended therapy.
In conclusion, our findings support the concept of inter-tumoral angiogenic heterogeneity. They imply individual tumors within the same histologic type can employ multiple mechanisms to induce angiogenesis. Moreover, they demonstrate the need for a more in depth understanding of the variability of the angiogenic phenotype within a given type of neoplasm as we begin to design targeted therapies aimed at blocking this critical phenotype. In addition, these data support the concept that one potential reason that anti-angiogenesis clinical trials, in which a specific angiogenic factor is targeted, may have lower than expected clinical response rates due to the fact that therapy may have been used on certain tumors that do not produce the targeted factor. Finally, these data support the need for studies that explore the correlation between target expression and clinical outcome to a given therapy in conjunction with ongoing clinical trials.
Supplementary Material
Acknowledgments
We thank Kristen Kasza from the University of Chicago Department of Health Studies for the stastistical support related to this manuscript.
This work was supported in part by the NIH grants: DE12322 and DE00470 (MWL).
References
- 1.Dexter DL, Calabresi P. Intraneoplastic diversity. Biochim Biophys Acta. 1982;695:97–112. doi: 10.1016/0304-419x(82)90019-1. [DOI] [PubMed] [Google Scholar]
- 2.Fidler IJ, Hart IR. Biological diversity in metastatic neoplasms: origins and implications. Science. 1982;217:998–1003. doi: 10.1126/science.7112116. [DOI] [PubMed] [Google Scholar]
- 3.Poste G, Greig R. On the genesis and regulation of cellular heterogeneity in malignant tumors. Invasion Metastasis. 1982;2:137–76. [PubMed] [Google Scholar]
- 4.Heppner GH, Miller BE. Tumor heterogeneity: biological implications and therapeutic consequences. Cancer Metastasis Rev. 1983;2:5–23. doi: 10.1007/BF00046903. [DOI] [PubMed] [Google Scholar]
- 5.Heppner GH. Tumor heterogeneity. Cancer Res. 1984;44:2259–65. [PubMed] [Google Scholar]
- 6.Heppner GH, Dexter DL, DeNucci T, Miller FR, Calabresi P. Heterogeneity in drug sensitivity among tumor cell subpopulations of a single mammary tumor. Cancer Res. 1978;38:3758–63. [PubMed] [Google Scholar]
- 7.Rubin H, Arnstein P, Chu BM. Tumor progression in nude mice and its representation in cell culture. J Natl Cancer Inst. 1986;77:1125–35. [PubMed] [Google Scholar]
- 8.Crouch EC, Stone KR, Bloch M, McDivitt RW. Heterogeneity in the production of collagens and fibronectin by morphologically distinct clones of a human tumor cell line: evidence for intratumoral diversity in matrix protein biosynthesis. Cancer Res. 1987;47:6086–92. [PubMed] [Google Scholar]
- 9.Vince GH, Wagner S, Pietsch T, Klein R, Goldbrunner RH, Roosen K, Tonn JC. Heterogeneous regional expression patterns of matrix metalloproteinases in human malignant gliomas. Int J Dev Neurosci. 1999;17:437–45. doi: 10.1016/s0736-5748(99)00018-0. [DOI] [PubMed] [Google Scholar]
- 10.Anzai H, Kitadai Y, Bucana CD, Sanchez R, Omoto R, Fidler IJ. Intratumoral heterogeneity and inverse correlation between expression of E-cadherin and collagenase type IV in human gastric carcinomas. Differentiation. 1996;60:119–27. doi: 10.1046/j.1432-0436.1996.6020119.x. [DOI] [PubMed] [Google Scholar]
- 11.Kuniyasu H, Troncoso D, Johnston D, Bucana CD, Tahara E, Fidler IJ, Pettaway CA. Relative expression of type IV collagenase, E-cadherin and vascular endothelial growth factor/vascular permeability factor in prostatectomy specimens distinguishes organ-confined from pathologically advanced prostate cancers. Clin Cancer Res. 2000;6:2295–308. [PubMed] [Google Scholar]
- 12.Moriyama M, Kumagai S, Kawashiri K, Kojima K, Kakihara K, Yamamoto E. Immunohistochemical study of tumor angiogenesis in oral squamous cell carcinoma. Oral Oncology. 1997;33:369–74. doi: 10.1016/s1368-8375(97)00025-0. [DOI] [PubMed] [Google Scholar]
- 13.Inoue K, Ozeki Y, Suganuma T, Sugiura Y, Tanaka S. Vascular endothelial cell growth factor expression in primary squamous cell carcinoma. Association with angiogenesis and tumor progression. Cancer. 1997;79:206–13. doi: 10.1002/(sici)1097-0142(19970115)79:2<206::aid-cncr2>3.0.co;2-i. [DOI] [PubMed] [Google Scholar]
- 14.Denhart BC, Guidi AJ, Tognazzi K, Dvorak HF, Brown LF. Vascular permeability factor/vascular endothelial growth factor and its receptors in oral and laryngeal squamous cell carcinoma and dysplasia. Laboratory Investigation. 1997;77:659–64. [PubMed] [Google Scholar]
- 15.Eisma RJ, Spiro JD, Kreutzer DL. Role of angiogenic factors: coexpression of interleukin-8 and vascular endothelial growth factor in patients with head and neck squamous carcinoma. Laryngoscope. 1999;109:687–93. doi: 10.1097/00005537-199905000-00002. [DOI] [PubMed] [Google Scholar]
- 16.Bancroft CC, Chen Z, Dong G, Sunwoo JB, Yeh N, Park C, Van Waes C. Coexpression of proangiogenic factors IL-8 and VEGF by human head and neck squamous cell carcinoma involves coactivation by MEK-MAPK and IKK-NF-kappaB signal pathways. Clin Cancer Res. 2001;7:435–42. [PubMed] [Google Scholar]
- 17.Tae K, El-Naggar AK, Yoo E, Feng L, Lee JJ, Hong WK, Hittelman N, Shin DM. Expression of vascular endothelial growth factor and microvessel density in head and neck tumorigenesis. Clin Cancer Res. 2000;6:2821–28. [PubMed] [Google Scholar]
- 18.Lingen MW, Polverini PJ, Bouck NP. Retinoic acid induces cultured cells from human squamous cell carcinomas to become antiangiogenic. Am J Pathol. 1996;149:247–58. [PMC free article] [PubMed] [Google Scholar]
- 19.Wang E, Miller LD, Ohnmacht GA, Liu ET, Marincola FM. High fidelity mRNA amplification for gene profiling. Nature Biotechnol. 2000;18:457–59. doi: 10.1038/74546. [DOI] [PubMed] [Google Scholar]
- 20.Hasina R, Hulett K, Bicciato S, Petruzzelli G, Lingen MW. Identification of PAI-2 as a predictor of progression in oral squamous cell carcinoma. Cancer Res. 2003;63:555–9. [PubMed] [Google Scholar]
- 21.Lingen MW, Polverini PJ, Bouck NP. Retinoic acid and interferon-alpha act synergistically to inhibit oral squamous cell carcinoma induced angiogenesis. Cancer Res. 1998;58:5551–8. [PubMed] [Google Scholar]
- 22.Weidner N, Folkman J, Pozza F, Bevilacqua P, Allred EN, Moore DH, Meli S, Gasparini G. Tumor angiogenesis: a new significant and independent prognostic indicator in early-stage breast carcinoma. Journal of the National Cancer Institute. 1992;84:1875–87. doi: 10.1093/jnci/84.24.1875. [DOI] [PubMed] [Google Scholar]
- 23.Kini AR, Peterson LC, Tallman MS, Lingen MW. All-trans retinoic acid (ATRA) inhibits vascular endothelial growth factor (VEGF)-mediated angiogenesis in acute promyelocytic leukemia (APL) Blood. 2001;97:3919–3924. doi: 10.1182/blood.v97.12.3919. [DOI] [PubMed] [Google Scholar]
- 24.Hasina R, Fekete MJ, Martin L, Qi X-M, Brigaudeau C, Pramanik R, Edith I Cline, Coignet L, Lingen MW. NOL7 is a Nucleolar Candidate Tumor Supressor Gene in Cervical Cancer that Modulates the Angiogenic Phenotype. Oncogene. 2006;25:588–598. doi: 10.1038/sj.onc.1209070. [DOI] [PubMed] [Google Scholar]
- 25.Gorski DH, Beckett MA, Jaskowiak N, Calvin DP, Mauceri HJ, Salloum RM, Seetharam S, Koons A, Hari DM, Kufe DW, Weichselbaum RR. Blockade of the Vascular Endothelial Growth Factor Stress Response Increases the Antitumor Effects of Ionizing Radiation. Cancer Res. 1999;59:3374–8. [PubMed] [Google Scholar]
- 26.Lingen MW. Angiogenesis in head and neck cancer and its inhibition by chemopreventive agents. Crit Rev Oral Biol Med. 1999;10:153–64. doi: 10.1177/10454411990100020301. [DOI] [PubMed] [Google Scholar]
- 27.Hasina R, Lingen MW. Angiogenesis in Oral Cancer. J Dent Educ. 2001;65:1282–90. [PubMed] [Google Scholar]
- 28.Petruzzelli GJ, Benefield J, Taitz AD, Fowler S, Kalkanis J, Scobercea S, West D, Young MR. Heparin-binding growth factor(s) derived from head and neck squamous cell carcinomas induce endothelial cell proliferations. Head Neck. 1997;19:576–82. doi: 10.1002/(sici)1097-0347(199710)19:7<576::aid-hed3>3.0.co;2-4. [DOI] [PubMed] [Google Scholar]
- 29.Chen Z, Malhotra PS, Thomas GR, Ondrey FG, Duffey DC, Smith CW, Enamorado I, Yeh NT, Kroog GS, Rudy S, McCullagh L, Mousa S, et al. Expression of proinflammatory and proangiogenic cytokines in patients with head and neck cancer. Clin Cancer Res. 1999;5:1369–79. [PubMed] [Google Scholar]
- 30.Ninck S, Reisser C, Dyckhoff G, Helmke B, Bauer H, Herold-Mende C. Expression profiles of angiogenic growth factors in squamous cell carcinomas of the head and neck. Int J Cancer. 2003;106:34–44. doi: 10.1002/ijc.11188. [DOI] [PubMed] [Google Scholar]
- 31.Bancroft C, Chen Z, Yeh J, Sunwoo J, Yeh N, Jackson S, Jackson C, Van Waes C. Effects of pharmacologic antagonists of epidermal growth factor receptor, PI3K and MEK signal kinases on NF-kappaB and AP-1 activation and IL-8 and VEGF expression in human head and neck squamous cell carcinoma lines. Int J Cancer. 2002;99:538–48. doi: 10.1002/ijc.10398. [DOI] [PubMed] [Google Scholar]
- 32.Dong G, Chen Z, Li Z, Yeh N, Bancroft C, Van Waes C. Hepatocyte growth factor/scatter factor-induced activation of MEK and PI3K signal pathways contributes to expression of proangiogenic cytokines interleukin-8 and vascular endothelial growth factor in head and neck squamous cell carcinoma. Cancer Res. 2001;61(15):5911–8. [PubMed] [Google Scholar]
- 33.Wolf JS, Chen Z, Dong G, Sunwoo JB, Bancroft CC, Capo DE, Yeh NT, Mukaida N, Van Waes C. IL (interleukin)-1alpha promotes nuclear factor-kappaB and AP-1-induced IL-8 expression, cell survival, and proliferation in head and neck squamous cell carcinomas. Clin Cancer Res. 2001;7:1812–20. [PubMed] [Google Scholar]
- 34.Bancroft CC, Chen Z, Dong G, Sunwoo JB, Yeh N, Park C, Van Waes C. Coexpression of proangiogenic factors IL-8 and VEGF by human head and neck squamous cell carcinoma involves coactivation by MEK-MAPK and IKK-NF-kappaB signal pathways. Clin Cancer Res. 2001;7:435–42. [PubMed] [Google Scholar]
- 35.Worden B, Yang XP, Lee TL, Bagain L, Yeh NT, Cohen JG, Van Waes C, Chen Z. Hepatocyte growth factor/scatter factor differentially regulates expression of proangiogenic factors through Egr-1 in head and neck squamous cell carcinoma. Cancer Res. 2005;65:7071–80. doi: 10.1158/0008-5472.CAN-04-0989. [DOI] [PubMed] [Google Scholar]
- 36.Bouck N, Stellmach V, Hsu H. How tumors become angiogenic. Adv Cancer Res. 1995;69:135–74. doi: 10.1016/s0065-230x(08)60862-3. [DOI] [PubMed] [Google Scholar]
- 37.Hanahan D, Folkman J. Patterns and emerging mechanisms of the angiogenic switch during tumorigenesis. Cell. 1996;86:353–64. doi: 10.1016/s0092-8674(00)80108-7. [DOI] [PubMed] [Google Scholar]
- 38.Volpert OV, Dameron KM, Bouck N. Sequential development of an angiogenic phenotype by human fibroblasts progressing to tumorigenicity. Oncogene. 1997;14:1495–1502. doi: 10.1038/sj.onc.1200977. [DOI] [PubMed] [Google Scholar]
- 39.Lingen MW, DiPietro LA, Solt DB, Bouck NP, Polverini PJ. H-ras stimulates anchorage independence but not TGFβ mediated angiogenesis in keratinocytes cultured from the in vivo hamster buccal pouch model of oral carcinogenesis. Carcinogenesis. 1997;18:329–38. doi: 10.1093/carcin/18.2.329. [DOI] [PubMed] [Google Scholar]
- 40.Rak J, Mitsuhashi Y, Bayko L, Filmus J, Shirasawa S, Sasazuki T, Kerbel RS. Mutant ras oncogenes upregulate VEGF/VPF expression: implications for induction and inhibition of tumor angiogenesis. Cancer Res. 1995;55:4575–80. [PubMed] [Google Scholar]
- 41.Mukhopadhyay D, Tsiokas L, Sukhatme VP. Wild-type p53 and v-Src exert opposing influences on human vascular endothelial growth factor gene expression. Cancer Res. 1995;55:6161–65. [PubMed] [Google Scholar]
- 42.Marconcini L, Marchio S, Morbidelli L, Cartocci E, Albini A, Ziche M, Bussolino F, Oliviero S. c-fos-induced growth factor/vascular endothelial growth factor D induces angiogenesis in vivo and in vitro. Proc Natl Acad Sci USA. 1999;96:9671–6. doi: 10.1073/pnas.96.17.9671. [DOI] [PMC free article] [PubMed] [Google Scholar]
- 43.Kraemer M, Tournaire R, Dejong V, Montreau N, Briane D, Derbin C, Binetruy B. Rat embryo fibroblasts transformed by c-Jun display highly metastatic and angiogenic activities in vivo and deregulate gene expression of both angiogenic and antiangiogenic factors. Cell Growth Differ. 1999;10:193–200. [PubMed] [Google Scholar]
- 44.Arora S, Kaur J, Sharma C, Mathur M, Bahadur S, Shukla NK, Deo SV, Ralhan R. Stromelysin 3, Ets-1, and vascular endothelial growth factor expression in oral precancerous and cancerous lesions: correlation with microvessel density, progression, and prognosis. Clin Cancer Res. 2005;11:2272–84. doi: 10.1158/1078-0432.CCR-04-0572. [DOI] [PubMed] [Google Scholar]
- 45.Sparmann A, Bar-Sagi D. Ras-induced interleukin-8 expression plays a critical role in tumor growth and angiogenesis. Cancer Cell. 2004;6(5):447–58. doi: 10.1016/j.ccr.2004.09.028. [DOI] [PubMed] [Google Scholar]
- 46.Gnarra JR, Zhou S, Merrill MJ, Wagner JR, Krumm A, Papavassiliou E, Oldfield EH, Klausner RD, Linehan WM. Post-transcriptional regulation of vascular endothelial growth factor mRNA by the product of the VHL tumor suppressor gene. Proc Natl Acad Sci USA. 1996;93:10589–94. doi: 10.1073/pnas.93.20.10589. [DOI] [PMC free article] [PubMed] [Google Scholar]
- 47.Claudio PP, Stiegler P, Howard CM, Bellan C, Minimo C, Tosi GM, Rak J, Kovatich A, De Fazio P, Micheli P, Caputi M, Leoncini L, et al. RB2/p130 gene-enhanced expression down-regulates vascular endothelial growth factor expression and inhibits angiogenesis in vivo. Cancer Res. 2001;61:462–8. [PubMed] [Google Scholar]
- 48.Seki Y, Suico MA, Uto A, Hisatsune A, Shuto T, Isohama Y, Kai H. The ETS transcription factor MEF is a candidate tumor suppressor gene on the X chromosome. Cancer Res. 2002;62:6579–86. [PubMed] [Google Scholar]
- 49.Yuan A, Yu CJ, Luh KT, Kuo SH, Lee YC, Yang PC. Aberrant p53 expression correlates with expression of vascular endothelial growth factor mRNA and interleukin-8 mRNA and neoangiogenesis in non-small-cell lung cancer. J Clin Oncol. 2002;20:900–10. doi: 10.1200/JCO.2002.20.4.900. [DOI] [PubMed] [Google Scholar]
Associated Data
This section collects any data citations, data availability statements, or supplementary materials included in this article.


