Abstract
A monitoring campaign was conducted in August-September 2005 to compare different experimental approaches quantifying school bus self-pollution. As part of this monitoring campaign, a detailed characterization of PM2.5 diesel engine emissions from the tailpipe and crankcase emissions from the road draft tubes was performed. To distinguish between tailpipe and crankcase vent emissions, a deuterated alkane, n-hexatriacontane-d74 (n-C36D74) was added to the engine oil to serve as intentional quantitative tracers for lubricating oil PM emissions. This paper focuses on the detailed chemical speciation of crankcase and tailpipe PM emissions from two school buses used in this study. We found that organic carbon emission rates were generally higher from the crankcase than from the tailpipe for these two school buses, while elemental carbon contributed significantly only in the tailpipe emissions. The n-C36D74 that was added to the engine oil was emitted at higher rates from the crankcase than the tailpipe. Tracers of engine oil (hopanes, and steranes) were present in much higher proportion in crankcase emissions. Particle-associated PAH emission rates were generally very low (< 1 μg/km), but more PAH species were present in crankcase than in tailpipe emissions. The speciation of samples collected in the bus cabins was consistent with most of the bus self-pollution originating from crankcase emissions.
Keywords: School bus self-pollution, tailpipe and crankcase emissions, organic speciation, tracers
Introduction
The U.S. Environmental Protection Agency’s recent regulations require all new on-road diesel vehicles to change to low emission engines and ultra-low-sulfur fuels by 2007 (1). The rule includes two components: 1) emission standards; and 2) diesel fuel regulation. The first component of the regulation introduces new, very stringent emission standards for diesel particulate matter (PM, 0.01 g/bhp-hr), oxides of nitrogen (NOx, 0.20 g/bhp-hr) and non methane hydrocarbons (NMHC, 0.14 g/bhp-hr). The diesel fuel regulation limits the sulfur content in on-highway diesel fuel to 15 ppm, down from 500 ppm. In spring 2003, the U.S. EPA announced a nationwide voluntary school bus retrofit initiative (see http://www.epa.gov/cleanschoolbus) that established a cost-shared grant program to assist school districts in retrofitting and upgrading their bus fleet. In July 2003, the state of Washington legislature enacted a statewide “Diesel Solutions” program (see http://www.pscleanair.org/programs/dieselsolutions) that provides 25 million dollars by 2008 to retrofit school diesel buses with cleaner-burning fuels and engines, making it the one of the largest and most active voluntary school bus retrofit programs in the country. This program may substantially reduce potential in-cabin exposures to bus’s self pollution, especially to students and drivers who ride school buses daily. Although recent work (2) suggests the possibility that PM emissions from the crankcase vent, in addition to tailpipe emissions, may contribute to in-cabin PM, no studies have examined detailed organic compositions of PM in these emission sources of the school bus.
We conducted a monitoring campaign in summer 2005 to compare different experimental approaches quantifying school bus self-pollution (3). As part of this monitoring campaign, a detailed characterization of PM2.5 diesel engine emissions from the tailpipe and from the crankcase via the road draft tube was performed. To distinguish between tailpipe and crankcase vent emissions, a deuterated alkane, n-hexatriacontane-d74 (n-C36D74) was added to the engine oil, and organometallic iridium (Ir) complex was added to the diesel fuel. These served as intentional quantitative tracers for lubricating oil and fuel combustion PM emissions, respectively. The results from this novel dual tracer method for bus self-pollution estimates are described in separate papers (3, 4). This paper focuses on the detailed chemical speciation of crankcase and tailpipe PM emissions from two school buses used in this study. These data served as important inputs for the accompanying papers (3,4,5) and demonstrated that crankcase and tailpipe emissions could be differentiated using specific organic tracers.
Experimental Section
Study Design
Two Seattle school buses equipped with diesel oxidation catalysts were monitored: Bus 1 was a newer 2002 model with 49,012 miles and Bus 2 was an older 1999 model with 79,482 miles. Source sampling used an on-board dilution tunnel (RAVEM) (6) to collect PM2.5 samples from the tailpipe or the crankcase of each bus. Buses were driven along regular routes, including stops, and three 30-minute isokinetic samples were collected for each bus from the tailpipe, followed by three 15 to 20-minute crankcase sampling runs in which all exhaust air from the road draft tube was directed into the dilution tunnel. The details of the on-board dilution tunnel sampling are provided in the Supplemental Material. Samplers equipped with 2.5 μm cutpoint impactor inlets and 47 mm Teflon® (Gelman, RPJ047) filters for mass and elements or quartz fiber (Pallflex, 2500 QAT-UP) filters for organic and elemental carbon and detailed organic speciation were used. An additional sampler was operated upstream of the exhaust inlet to the dilution system as the sampling tunnel blank, alternating between a Teflon ® and quartz filter for each run. Prior to sampling, 100 grams of n-C36D74 (Cambridge Isotope Laboratories, Inc.) were added to approximately 20 quarts of new lubricating oil, which was added to the first bus following an oil change, with additional oil added to bring the engine oil up to normal operating levels. This oil was drained from the first bus and used to refill the second bus prior to the testing of the second bus. An organo-metallic coordination complex of iridium was dissolved in a small amount of toluene and added to the fuel of each bus to yield an approximate concentration of 10 mg of Ir per gallon of fuel, as described by Ireson et al (4).
To quantify the levels and major sources of a bus’s self-pollution, we performed in-cabin sampling when buses were driven along their regular routes. In addition, we monitored on-road background levels using a lead vehicle that was driven approximately 5 min ahead of the bus with its windows wide open. The details of these sampling methods are described in an accompanying paper (3).
Sample Analysis
Teflon filters were analyzed for PM mass by gravimetry. Quartz filters were analyzed for “organic” and “elemental” carbon (OC/EC) and for potential organic marker compounds, which are key inputs into receptor models. A 0.56 cm2 punch from the pre-fired, quartz-fiber filters was analyzed by the Thermal - Optical Reflectance (TOR) method for OC/EC, using the IMPROVE (Interagency Monitoring of Protected Visual Environments) temperature/oxygen cycle (7,8). The minimum detection limit (MDL) for this method is 0.8 and 6.2 μg of EC and OC, respectively, per 47 mm filter.
After taking a punch for TOR analysis, quartz filters were spiked with the following deuterated internal standards: chrysene-d12, pyrene-d12, benz[a]anthracene-d12, benzo[a]pyrene-d12, benzo[e]pyrene-d12, benzo[k]fluoranthene-d-12, benzo[g,h,i]perylene-d12, coronene - d12, cholestane-d50, 1-nitropyrene-d9, n-hexadecane-d34, n-eicosane-d42, n-tetracosane-d50 , n-octacosane-d58, and n-triacontane-d62. The samples were extracted with dichloromethane followed by n-hexane utilizing pressurized fluid extraction method with Accelerated Solvent Extractor (Dionex Corporation, Sunnyvale, CA). The extracts were then concentrated by rotary evaporation at 20°C under gentle vacuum to ∼1 ml and filtered through 0.45 mm Acrodiscs (Gelman Scientific), rinsing the sample flask twice with 1 ml dichloromethane (CH2Cl2) each time. Approximately 100 μl of toluene was added to the sample and CH2Cl2 /hexane was evaporated under a gentle stream of nitrogen.
The extracts were analyzed for polycyclic aromatic hydrocarbons (PAH) and alkanes with a Varian Star 3400CX gas chromatograph equipped with an 8200CX Automatic Sampler interfaced to a Varian Saturn 4000 Ion Trap gas chromatograph/mass spectrometer (GC/MS), operated in an electron impact (EI) ionization mode and selective ion storage (SIS) analysis mode. Splitless injections (1 μL) were made onto a phenylmethylsilicone fused-silica capillary column (30 m, 0.25 mm id, 0.25 μm film thickness; DB-5 ms, J&W Scientific). The GC operating conditions were as follows: for PAH, 75°C for 2 min; 14°C/min to 300°C; 10°C/min to 325°C; hold at 325°C for 8 min, and for alkanes, 70°C to 300°C hold for 4.5 min; 40°C/min to 325°C; hold at 325°C for 12 min.
Hopanes and steranes were analyzed using the Varian 1200 triple quadrupole gas chromatograph/mass spectrometer (GC/MS/MS) system with CP-8400 autosampler, operating in EI and multiple ion detection (MID) mode. Splitless injections (1 μL) were made onto a phenylmethylsilicone fused-silica capillary column (30 m, 0.25 mm id, 0.25 μm film thickness; Chrompack Factor four VF-5ms). The GC operating conditions were as follows: 85°C for 2 min; 12°C/min to 200°C; 8°C/min to 320°C; hold at 320°C for 8 min.
1-Nitropyrene (1-NP) was quantified using Varian 1200 GC/MS/MS system operating in negative chemical ionization (NICI) mode. Injections (1 μL) were made in the cool-on-column mode (90°C injection temperature, 50°C/min to 320°C) onto a 30m long × 0.25 mm id, 0.25 μm film thickness 50% phenylmethylsilicone fused-silica capillary column (DB-17ms, J&W Scientific). The GC oven operating conditions were as follows: 90°C for 2 min; 12°C/min to 210°C; 10°C/min to 250°C; hold at 250°C for 2 min, 20°C/min to 320°C; hold at 320°C for 16 min. Methane was used as a CI reagent gas. The MS/MS method was used to detect 1-NP. The molecular ions of 1-NP and deuterated internal standard 1-NP-d9 (m/z 247 and 256, respectively) was isolated by the first quadrupole (Q1) and fragmented by collision with argon at 15 V in the collision cell. The second quad (Q2) was set to monitor [M-NO]+ fragment ion at m/z 217 and 226, respectively. The use of NICI GC/MS/MS technique allows for quantification of 1-NP without the necessity of rigorous sample pre-cleaning.
Samples were quantified by comparing the response of the deuterated internal standards to the analyte of interest. Analyte response was referenced to five-point calibration curves created from standard solutions made with certified PAH mixtures purchased from Sigma -Aldrich, Inc., ACCU Standards, Ultra SCI and CDN, Inc. The National Institute of Standards and Technology Standard Reference Materials (SRM 1941 and 2260a) served as reference standards for QA/QC purposes. Alkane calibration solutions were made from certified alkane mixtures obtained from Chiron (Norway), ACCU Standards and Ultra SCI. NIST SRM 2266, containing five hopanes and five steranes were used for preparing calibration solutions for hopanes/steranes. The remaining hopanes and steranes were identified based on comparison of their mass spectra and retention time with data available in the literature (9-11). Compounds for which authentic standards were not available were quantified based on the response factor of standards most closely matched in structure and retention characteristics. For 1-nitropyrene, calibration solutions were made from NIST SRM 2265. The MDL is approximately 20 pg/μl for PAH, alkanes and hopanes/steranes and 0.5 pg/μl for nitro-PAH.
Lubrication oil and fuel samples were obtained from the vehicles immediately after emissions sampling and were analyzed for PAH, alkanes and hopanes/steranes. The oils were cleaned and fractionated prior to analysis using the method described by Wang et al (9). Cleanup was conducted on a 12ml Supelco solid phase extraction (SPE) cartridge packed with 2g of SiOH. Cartridges were placed on a vacuum manifold and conditioned prior to cleanup with 14ml of hexane. Prior to cleanup, oils and fuels were diluted in hexane (100 μl/ml and 300 μl/ml, respectively). Three hundred microliters of the diluted oil or fuel were spiked onto a SPE cartridge along with 100 ul of deuterated internal standard mixture described above. Samples were eluted with 8ml of hexane followed by 10ml of benzene/hexane (1:1). Both fractions were combined, evaporated to 1 ml and analyzed for PAH, alkanes, hopanes and steranes by GC/MS, as described above.
Emission rates calculations
The measured source concentration from each filter sample was corrected for background air contaminants contained in the dilution air by subtracting the measured concentration of the corresponding dilution air filter samples. The dilution air concentrations were adjusted before subtraction to compensate for the fraction of air in the source samples that was produced by the engine, using the equation:
where DF ≡ dilution factor (ratio of diluted air volume to source volume)* for crankcase emissions source testing, when two dilution air samples were collected each day, the daily average concentration was subtracted from each source sample.
The resulting background-adjusted concentrations were then converted to total emissions for each test (mg per cycle) by multiplying by the total volume of air that passed through the dilution chamber (Vmix):
From this total emissions value (ET), emission rates in mg/km or mg/sec were calculated by dividing by the total distance driven or the total sampling time, respectively.
Results and Discussion
The crankcase and tailpipe emission rates of species measured during this study for Bus 1 and Bus 2 are presented in Table S1 included as supplementary data. The detailed speciations of in-cabin bus and lead vehicle samples are presented in supplementary Tables S2 and S3, respectively.
PM2.5 Mass and Organic/Elemental Carbon Emission Rates
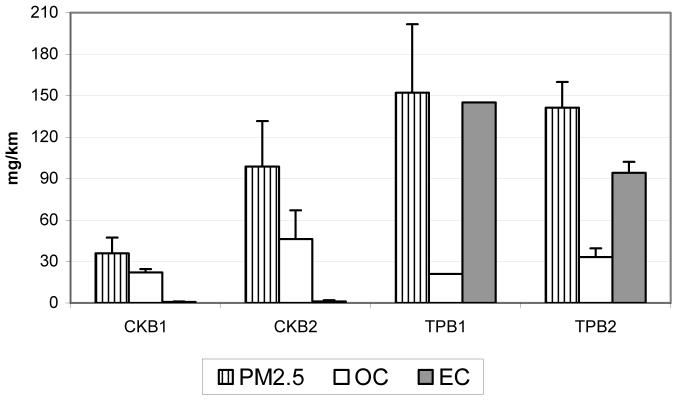
Figure 1 shows the average crankcase (CK) and tailpipe (TP) fine PM, organic and elemental carbon emission rates for Bus 1 (B1) and Bus 2 (B2). The data in this figure are averaged over three separate runs for each bus and the standard deviations between the runs are also shown. As described in Experimental, the buses were driven along their regular routes, including stops, and the crankcase and tailpipe emission samples were collected using an on-board dilution tunnel (6). Thus, the variation in PM, OC and EC emission rates are expected, since they are highly dependent on driving modes, which were not standardized but varied according to actual traffic conditions. Two OC/EC measurements from Bus 1 tailpipe emissions sample were invalidated, due to a suspected leak during sampling, and one PM value was lower than expected (4). Figure 1 illustrates that the OC/EC ratio is very different for crankcase and tailpipe emissions; while OC dominates crankcase emissions, both OC and EC are important for tailpipe emissions with EC a larger contributor to PM than OC.
Figure 1.
Average crankcase (CK) and tailpipe (TP) fine PM, organic (OC) and elemental (EC) carbon emission rates for Bus 1 (B1) and Bus 2 (B2). Error bars are standard deviations between the runs (only one valid OC/EC measurement for TPB1)
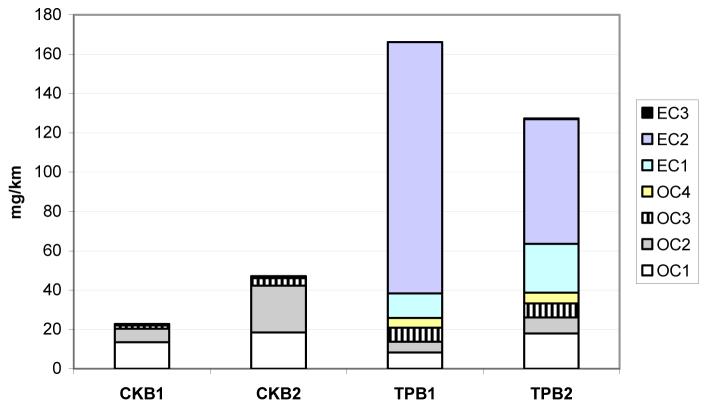
Figure 2 shows the OC and EC fractions for these samples. Carbon fractions in the IMPROVE method correspond to temperature steps of 120°C (OC1), 250°C (OC2), 450°C (OC3), and 550°C (OC4) in a nonoxidizing helium atmosphere, and at 550°C (EC1), 700°C (EC2), and 850°C (EC3) in an oxidizing atmosphere. The IMPROVE TOR method uses variable hold times of 150-580 seconds at each heating stage so that carbon responses return to baseline values (7). As Figure 2 shows, the crankcase emissions are composed mostly of OC1 and OC2 fractions, whereas tailpipe emissions contain all four OC fractions and EC1 and EC2 fractions.
Figure 2.
OC and EC fraction emission rates for crankcase (CK) and tailpipe (TP) samples. See text for definitions of EC and OC fractions.
All samples collected in the Bus 1 and 2 cabins contain a higher proportion of OC than EC (see Table S2, average OC/EC ratio 7 and 4 for Bus 1 and 2, respectively), which is consistent with the observation (2-5) that the majority of the self-pollution in the bus cabins is not due to tailpipe emissions.
Organic Tracer Emissions
Several classes of particle-associated organic compounds were analyzed for this study, including alkanes, n-alkylcyclohexanes, PAH, hopanes/steranes and nitro-PAH (1-nitropyrene) as potential tracers for crankcase and tailpipe emissions. The emission rates for individual species and their in-cabin and lead-vehicle concentrations are shown in the supplemental material (Tables S1, S2 and S3).
Hopanes and Steranes
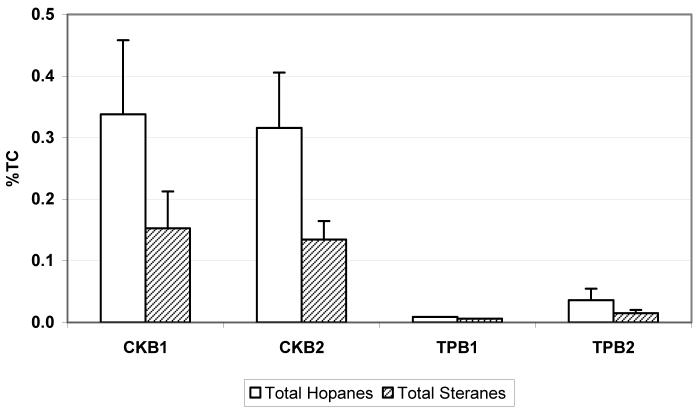
Hopanes and steranes are compounds present in crude oil as a result of the decomposition of sterols and other biomass and they are not by-products of combustion (10). They have been used as molecular markers for vehicle emissions and are higher in vehicles that emit oil (10-14). Figure 3 shows total hopane and sterane emissions as a percentage of total carbon (TC=OC+EC) measured by the IMPROVE protocol. Only one valid sample was available for TPB1, thus no standard deviations are shown. As expected, crankcase emissions contain much higher proportion of hopanes/steranes than tailpipe emissions.
Figure 3.
Total hopane and sterane emissions as a percentage of total carbon (TC) for crankcase (CK) and tailpipe (TP) samples. Error bars are standard deviations between the runs
The in-cabin concentrations of hopanes and steranes (Table S2) support the conclusion that the majority of the self-pollution in the buses originated from crankcase emissions (3-5). These concentrations are much higher (by a factor of 4 to 9) when the buses are driven with closed windows than with open windows. In addition, as Figure S1 (supplemental material) shows, the total concentrations of hopanes and steranes in background air (as measured by a lead vehicle, Table S3) are much lower than in-cabin concentrations with the windows closed.
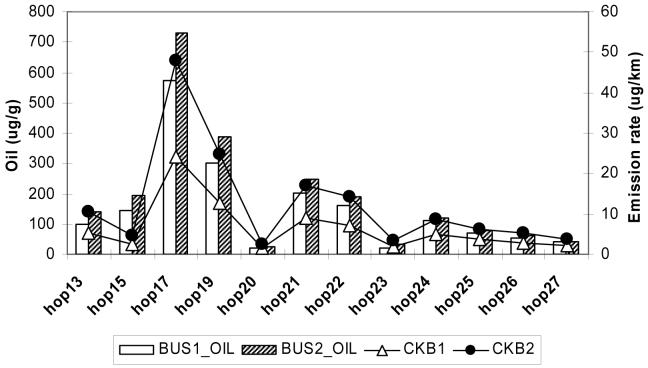
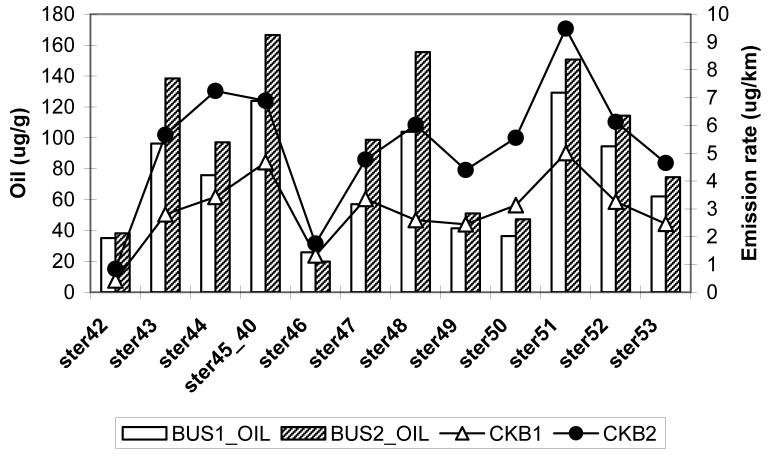
The lube oil and fuel samples from the two buses were analyzed for the same organic species (with exception of 1-nitropyrene) as emission samples. Figures 4a and 4b show the comparison of individual hopanes and steranes species, respectively, in the lube oil (in μg/g) and crankcase emissions (in μg/km) for Bus 1 and 2. (Table S1 provides mnemonics for the species listed). The composition of hopanes and steranes in crankcase emissions follow closely the lube oil composition. Although the concentrations of these species are much lower in tailpipe emissions, their profiles are essentially the same (see Table S1).
Figure 4.
Comparison of individual hopanes (4a) and steranes species (4b) in the lube oil (in μg/g) and crankcase emissions (in μg/km) for Buses 1 and 2. The abbreviations are: hop13=18α(H)-22,29,30-Trisnorneohopane; hop15=17α(H)-22,29,30-Trisnorhopane; hop17=17α(H),21ß(H)-29-Norhopane; hop19=17α(H),21ß(H)-Hopane; hop21=22S-17α(H),21ß(H)-30-Homohopane; hop22=22R-17α(H),21ß(H)-30-Homohopane; hop23=17ß(H),21ß(H)-Hopane; hop24=22S-17α(H),21ß(H)-30,31-Bishomohopane; hop25= 22R-17α(H),21ß(H)-30,31-Bishomohopane; hop26=22S-17α(H),21ß(H)-30,31,32-Trishomohopane; hop27=22R-17α(H),21ß(H)-30,31,32-Trishomohopane; ster42=20S-5α(H),14α(H),17α(H)-cholestane; ster43=20R-5α(H),14ß(H),17ß(H)-cholestane; ster44=20S-5α(H),14ß(H),17ß(H)-cholestane; ster45_40=20R-5α(H),14α(H),17α(H)-cholestane & 20S-13ß(H),17α(H)-diastigmastane; ster46=20S-5α(H),14α(H),17α(H)-ergostane; ster47=20R-5α(H),14ß(H),17ß(H)-ergostane; ster48_41=20S-5α(H),14ß(H),17ß(H)-ergostane & 20R-13α(H),17ß(H)-diastigmastane; ster49=20R-5α(H),14α(H),17α(H)-ergostane; ster50=20S-5α(H),14α(H),17α(H)-stigmastane; ster51=20R-5α(H),14ß(H),17ß(H)-stigmastane; ster52=20S-5α(H),14ß(H),17ß(H)-stigmastane; ster53=20R-5α(H),14α(H),17α(H)-stigmastane
Alkanes
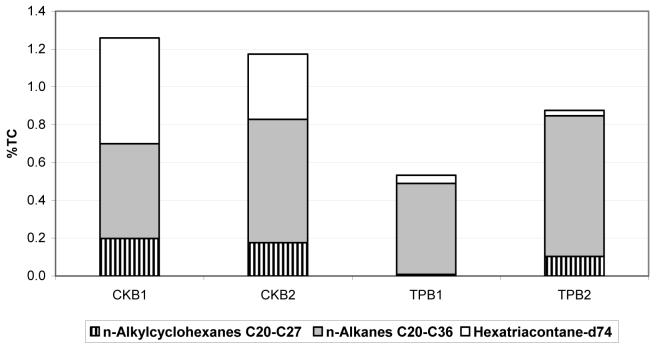
N-alkanes and n-alkylcyclohexanes constitute up to 1% of total carbon (TC=OC + EC) emissions, as shown in Figure 5. Deuterated n-hexatriacontane that was added to the lube oil as an intentional tracer is much more abundant in crankcase than tailpipe emissions. Since no solid adsorbent was used following the filter to account for the gas-phase portion of semi-volatile organic compounds (SVOC), only n-alkanes greater than C20 are shown, as those are predominantly distributed to the particle phase. However, the concentrations of alkanes from C14 up to C40 (including branched alkanes norfarnesene, farnesane, norpristane, pristane and phytane) were measured in emissions and diesel fuel/lube oil, as shown in Table S1 (supplemental material).
Figure 5.
N-alkanes and n-alkylcyclohexanes emissions as a percentage of total carbon (TC) for crankcase (CK) and tailpipe (TP) samples
The concentrations of n-alkanes and n-alkylcyclohexanes were also higher in the cabin of the buses driven with windows closed than open, by a factor of 2 to 3 (Table S2). Also, the concentrations of n-hexatriacontane-d74 were much higher in the cabin of buses driven with windows closed than measured by the lead vehicle (Table S3). The contribution of the crankcase and tailpipe emissions to the bus self-pollution is discussed in the accompanied papers (3-5).
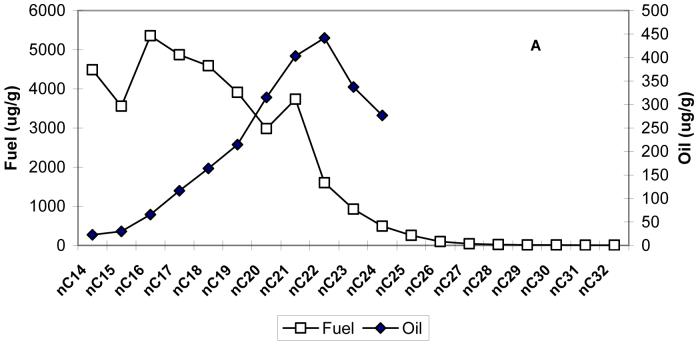
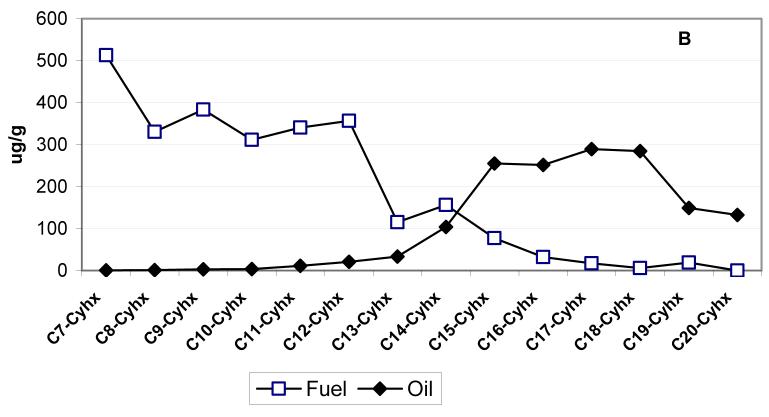
Figure 6a and 6b compare the distribution of n-alkanes and n-alkylcyclohexanes, respectively, in the fuel and lube oil obtained from both school buses after the sampling (the mean concentrations in fuel and lube oil are used). The concentrations of n-alkanes >C24 are not reported in the lube oil, since their identification is highly uncertain due to the presence of the large hump, known as the unresolved complex mixture (UCM) in the chromatograms, which interfere with the chromatographic separations of n-alkanes in the range of C25-C36. The UCM is due to the presence of many higher molecular weight (mw) branched alkanes and alkylated cycloalkanes that have very similar mass spectra. This complex mixture causes coelutions and the retention time shift of n-alkanes that is difficult to predict. It has been recently reported (15) that molecular sieve treatment of lube oil removes the superimposed UCM hump thus allowing the correct identification and quantifications of n-alkanes in the range of C25-C36, that were otherwise greatly overestimated.
Figure 6.
Distribution of n-alkanes (6a) and n-alkylcyclohexanes (6b), in the fuel and lube oil obtained from both school buses. nCx = n-alkane with x carbon numbers (i.e. nC14 = n-tetradecane); Cx-Cyhx = Cx: n-alkyl with x carbon numbers, Cyhx: cyclohexane (i.e. C7-Cyhx=n-heptylcyclohexane).
As shown in Figure 6, the concentrations of alkanes and n-alkylcyclohexanes peak at nC14 - nC16 and C7 - C8-cyclohexanes, respectively, for diesel fuel, whereas for the lube oil these concentrations peak at nC20 - nC23 and C17 - C18 cyclohexanes, respectively. The n-alkane and n-alkylcyclohexane profiles for crankcase emissions resemble more closely the lube oil profile than tailpipe emission profile (Figures S2, supplemental material). The carbon preference index (CPI), defined as the ratio of the sum of the odd carbon number n-alkanes homolog to the sum of even carbon number homolog should be close to 1 for materials of anthropogenic origin, such as fuel and oil. Consequently, for the n-alkanes in the C14-C40 range, the CPIs are 0.81, 0.86, 1.00 and 1.2 for fuel, oil, crankcase and tailpipe emissions, respectively. The CPIs for in-cabin n-alkanes, are 1.4 and 2.2 for the bus driven with closed and open windows, respectively. For lead vehicle measurements, the mean CPI is close to 2. This indicates the contribution of outside ambient air to in-cabin concentrations when the bus windows are open.
The concentrations of n-hexatriacontane-d74 in the lube oil were 2.2 and 1.4 mg/g for Bus 1 and 2, respectively. As mentioned in the Experimental Section, the oil from the first bus was drained and reused for the second bus. Since some oil was left in the first bus and more lube oil was added to the second bus, the concentration of n-hexatriacontane-d74 is lower for the second bus.
Polycyclic Aromatic Hydrocarbons
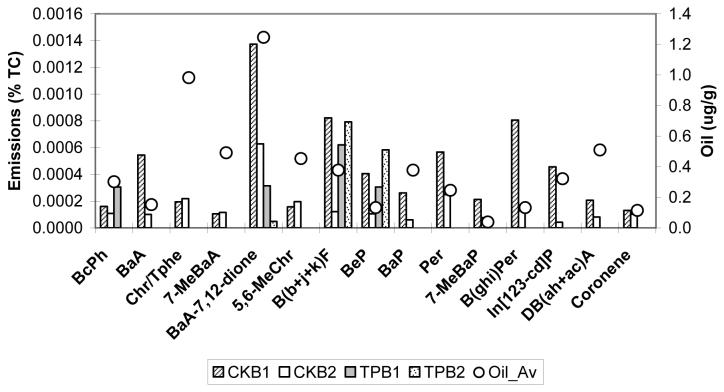
Since no solid adsorbent was used with the quartz filter, only 19 particle-associated PAH and oxy-PAH were quantified (see Table S1 for PAH emission rates). Figure 7 shows the crankcase and tailpipe emissions of selected PAH and oxy-PAH expressed as the percentage of total carbon and compares them with the average lube oil PAH concentrations. As seen from this figure and Table S1, the abundance of particle-associated PAH is very low in both diesel crankcase and tailpipe emissions. This is consistent with the previous reports (13,14). However, more PAH species are present in crankcase than tailpipe emissions; only benzo(e)pyrene (BeP) and benzo(b), (j), and (k)-fluoranthanes (due to the coelution problem these three isomers are quantified together) are consistently present in tailpipe emissions. In addition, benzo(c)phenanthrene (BcPh), benzanthrone, and benz(a)anthracene-7,12-dione (BaA-7,12-dione) are detected in some tailpipe emission samples. In contrast, all PAH species are consistently present (although in very low concentrations) in crankcase emissions.
Figure 7.
Comparison of crankcase (CK) and tailpipe (TP) emissions of selected PAH and oxy-PAH from Buses 1 and 2 (B1 and B2) expressed as the percentage of total carbon with the average lube oil PAH concentrations. The abbreviations are: BcPh= benzo(c)phenanthrene; BaA= Benz(a)anthracene; Chr/Tphe= chrysene/triphenylene; 7-MeBaA= 7-methylbenz(a)anthracene; BaA-7,12-dione =Benz(a)anthracene-7,12-dione; B(b+j+k)F =Benzo(b+j+k)fluoranthene; BeP= benzo(e)pyrene; BaP=benzo(a)pyrene; Per= Perylene; 7-MeBaP= 7-methylbenzo(a)pyrene; B(ghi)Per =Benzo(ghi)perylene; In[123-cd]P=Indeno[123-cd]pyrene; DB(ah+ac)A = Dibenzo(ah+ac)anthracene; Coronene
The same PAH species were detected in the lubricating oil samples from both buses and their concentrations were higher in the oil from Bus 2, as expected (since this oil was already used once in the Bus 1). However, as Figure 8 shows, the PAH patterns in the crankcase emissions and lube oil samples are not similar. The concentrations of the 19 PAH species in diesel fuel are negligible (see Table S1). Similarly, the in-cabin bus and lead vehicle PAH concentrations are very low (Table S2 and S3), although for Bus 2 these concentrations are significantly higher (by a factor of 3) when the bus windows are closed.
1-Nitropyrene
Because 1-nitropyrene is considered to be a tracer for diesel emissions, it was quantified in crankcase and tailpipe emission samples. It was not detected in quantifiable amount in crankcase emissions, but it was present in tailpipe emissions. 1-Nitropyrene emission rates were 0.34 μg/km and 1.0 μg/km for Bus 1 and 2, respectively. Similar emissions rates were reported for current technology diesel vehicles in the previous study (13). Since the sampling time was short (30 min) it is likely that 1-nitropyrene is the combustion product and not the artifact produced during sampling on the filter (16). The lube oil and fuel samples were not analyzed for this compound; however it would be rather unlikely to find it there. Although 1-nitropyrene was detected in several in-cabin bus and lead vehicle samples (Table S2 and S3), its concentrations were extremely low (in the range of 1 to 2 pg/m3), and no consistent pattern was observed.
Supplementary Material
Acknowledgments
Financial support for this work was provided by the DOE Office of FreedomCAR and Vehicle Technologies through the National Renewable Energy Laboratory (Dr. James Eberhardt, Chief Scientist) and by the National Institute of Environmental Health Sciences (#1R01ES12657-01A1). We thank Mr. Mark McDaniel and Mrs. Anna Cunningham of Organic Analytical Laboratory of DRI for help in sample collection and analyses.
References
- 1. Federal Register, US EPA, 40 CFR, Parts 69, 80 and 86, January 18, 2001.
- 2.Hill LB, Zimmerman NJ, Gooch JA. A Multi-city Investigation of the Effectiveness of Retrofit Emissions Controls in Reducing Exposures to Pariculate Matter in School Buses. Clean Air Task Force; Boston: 2005. available at: http://www.catf.us/publications/view/82) [Google Scholar]
- 3.Liu L-JS, Webber WL, Davey M, Lawson DR, Ireson RG, Zielinska B, Ondov JM, Weaver CS, Lapin CA, Easter M, Hesterberg TW, Larson T. Estimating Self-Pollution from Diesel School Buses Using Three Methods. submitted to Environ. Sci. Technol. 2007 doi: 10.1016/j.atmosenv.2010.06.005. [DOI] [PMC free article] [PubMed] [Google Scholar]
- 4.Ireson R, Ondov J, Zielinska B, Weaver C, Easter M, Lawson D, Hesterberg T, Davey M, Liu L-JS. Development and Demonstration of a Dual Intentional Tracer Method for Quantifying In-Cabin Concentrations of Tailpipe and Cranckcase PM2.5 in School Buses. submitted to Environ. Sci. Technol. 2007 [Google Scholar]
- 5.Larson T, Webber W, Zielinska B, Ireson R, Liu L-JS. Source apportionment of PM2.5 inside a diesel school bus: a comparison of weighted partial least squares regression and chemical mass balance with a synthetic tracer-based method. submitted to Environ. Sci. Technol. 2007 [Google Scholar]
- 6.Weaver CS, Petty LE. Reproducibility and accuracy of on-board emissions measurements using the RAVEM system. SAE International. 2004 SAE Paper No.2004-01-0965. [Google Scholar]
- 7.Chow JC, Watson JG, Pritchett LC, Pierson WR, Frazier CA, Purcell RG. The DRI Thermal/Optical Reflectance carbon analysis system: Description, evaluation and applications in U.S. air quality studies. Atmos.Environ. 1993;27A:1185–1201. [Google Scholar]
- 8.Chow JC, Watson JG, Crow D, Lowenthal DH, Merrifield T. Comparison of IMPROVE and NIOSH carbon measurements. Aerosol Sci.Technol. 2001;34:23–34. [Google Scholar]
- 9.Wang Z, Fingas M, Li K. Fractionation of a light crude oil and identification and quantification of aliphatic, aromatic, and biomarker compounds by GC-FID and GC-MS. J. of Chromatograph. Sci. 1994;32(Part II):367–382. [Google Scholar]
- 10.Simoneit BRT. Application of molecular marker analysis to vehicular exhaust for source reconciliation. International Journal of Environmental Analytical Chemistry. 1985;22:203–233. [Google Scholar]
- 11.Rogge WF, Hildemann LM, Mazurek MA, Cass GR, Simoneit BRT. Sources of Fine Organic Aerosol 2. Noncatalyst and Catalyst-Equipped Automobiles and Heavy-Duty Diesel Trucks. Environ. Sci. Technol. 1993;27:636–651. [Google Scholar]
- 12.Fraser MP, Cass GR, Simoneit BRT. Particle-Phase Organic Compounds Emitted from Motor Vehicle Exhaust and in Urban Atmosphere. Atmos. Environ. 1999;33:2715–2724. [Google Scholar]
- 13.Zielinska B, Sagebiel J, McDonald JD, Whitney K, Lawson DR. Emission Rates and Comparative Chemical Composition from Selected In-Use Diesel and Gasoline-Fueled Vehicles. J. Air & Waste Manage. Assoc. 2004;54:1138–1150. doi: 10.1080/10473289.2004.10470973. [DOI] [PubMed] [Google Scholar]
- 14.Fujita EM, Zielinska B, Campbell DE, Arnott WP, Sagebiel JC, Reinhart L, Chow JC, Gabele PA, Crews W, Snow R, Clark NN, Wayne WS, Lawson DR. Variations in speciated emissions from spark-ignition and compression-ignition motor vehicles in California’s South Coast Air Basin. J. Air Waste Manage. Assoc. 2007;57:705–720. doi: 10.3155/1047-3289.57.6.705. [DOI] [PubMed] [Google Scholar]
- 15.Caravaggio GA, Charland JP, Mcdonald P, Graham L. n-Alkane profiles of engine lubricating oils by molecular sieve extraction. Environ. Sci. Technol. 2007 doi: 10.1021/es062233h. in press. [DOI] [PubMed] [Google Scholar]
- 16.Schuetzle D, Perez JM. Factors influencing the emissions of nitrated-polynuclear aromatic hydrocarbons (nitro-PAH) from diesel engines. J. Air Pollut. Control. Assoc. 1983;33:751–755. [Google Scholar]
Associated Data
This section collects any data citations, data availability statements, or supplementary materials included in this article.


