

Abstract
Lupus nephritis is a frequent and serious complication of systemic lupus erythematosus (SLE). Treatment often requires the use of immunosuppression, and may be associated with severe side effects. The ability to predict relapse, relapse severity, and recovery could be used to more effectively implement therapy and reduce toxicity. We postulated that a proteomic analysis of the low-molecular weight urine proteome using serial urine samples obtained before, during, and after SLE nephritis flares would demonstrate potential biomarkers of SLE renal flare. This study was undertaken to test our hypothesis.
Urine from 25 flare cycles of 19 WHO Class III, IV, and V SLE nephritis patients was used. Urine samples included a baseline, and pre-flare, flare, and post-flare specimens. The urines were fractionated to remove proteins larger than 30 kDa, and spotted onto weak cation exchanger (CM10) protein chips for analysis by surface-enhanced laser desorption/ionization time-of-flight mass spectrometry (SELDI-TOF MS).
SELDI-TOF MS screening showed 176 protein ions between 2-20 kDa of which 27 were found to be differentially-expressed between specific flare intervals. On-chip peptide sequencing by integrated tandem mass spectrometry was used to positively identify selected differentially-expressed protein ions. The identified proteins included the 20 and 25 amino acid isoforms of hepcidin, a fragment of α1-antitrypsin, and an albumin fragment. Hepcidin 20 increased 4 months pre-flare and returned to baseline at renal flare, whereas hepcidin 25 decreased at renal flare and returned to baseline 4 months post-flare.
Using SELDI-TOF urine protein profiling in lupus nephritis, several candidate biomarkers of renal flare were found. To verify these candidates as true biomarkers, further identification and validation are needed in an independent SLE cohort.
Keywords: lupus nephritis, biomarker, SELDI
Introduction
Kidney involvement in patients with systemic lupus erythematosus (SLE) is a serious complication that often requires aggressive immunosuppressive therapy. Although current therapeutics are generally effective in controlling renal SLE, the morbidity associated with treatment can be severe (1). Therapy of SLE nephritis would be more effective, and treatment toxicities mitigated, if the onset, severity, or responsiveness of SLE renal flare could be predicted, and treatment modified accordingly for individual patients. Supporting this concept, renal survival is improved with early treatment and rapid induction of remission in lupus nephritis (2, 3). At present there are no biomarkers that reliably predict the onset of renal flare, flare phenotype, or how flare will respond to treatment (4-6). We postulated that proteomic analysis of serial urine samples taken before, during, and after lupus nephritis flares could screen for proteins or peptides that are differentially expressed during the initiation, maintenance, and resolution phases of the flare cycle. Some of these proteins could be clinically useful biomarkers for lupus nephritis. For example, a urine protein that changes between disease quiescence and a time point before flare is clinically evident could be a forecaster of impending renal flare. Urine proteins that are differentially-expressed during flare may be markers of flare severity and could have pathogenic or therapeutic implications. Finally, urine proteins that are differentially expressed during flare resolution may be biomarkers of prognosis or response to therapy.
The urine proteome has been studied by two main techniques. One technique involves 2-dimensional gel electrophoresis (2DE) to separate proteins by isoelectric point and size, followed by protein identification using mass spectrometry (MS) (7-10). The most significant disadvantage of 2DE for detecting candidate biomarkers is the limited resolution of low-molecular weight (LMW), low-abundance proteins (11). The LMW proteome is especially important for biomarker discovery in SLE, because it contains biologic mediators (cytokines, chemokines, growth factors) that are expected to be involved in disease pathogenesis. Some of these mediators are produced in the kidney and may reflect organ-specific injury. Nonetheless, 2DE followed by mass spectrometry was used to detect urine proteins that discriminate between ISN/RPS lupus nephritis classes (12). These putative biomarkers were serum glycoproteins mostly larger than 20 000 Daltons (Da).
The second major technique used in urine proteomics is surface-enhanced laser desorption/ionization time-of-flight mass spectrometry (SELDI-TOF-MS). This involves spotting urine samples on a solid-phase matrix (protein chip) that has specific binding properties. Because the surface chemistry of the protein chip influences the number and types of proteins that bind, several different chip types must be used to completely characterize a sample’s proteome. Protein spectra generated after laser ionization of the spotted samples (13) are characterized by their mass to charge (m/z) ratio. Relative abundance can be estimated by protein ion peak height (intensity). The advantage of SELDI-TOF-MS in SLE nephritis is sensitivity for detection of LMW proteins, especially below 20 000 Daltons (14, 15). For urine protein analysis, SELDI-TOF-MS is accurate to within 0.01% of the molecular mass, and has a sensitivity of 0.1 fmole (16). There are two main drawbacks associated with SELDI-TOF-MS. Most importantly, it cannot directly identify specific proteins, but rather patterns of protein expression (17). Although patterns can provide biomarker information, protein identities are required to advance the understanding of disease pathogenesis and to develop novel therapeutics. The identities of specific SELDI-derived candidate protein ions can be determined after chromatographic enrichment and protein sequencing by capillary liquid chromatography-nanospray tandem mass spectrometry (LC/MS/MS), or by on-chip protein sequencing using an LC/MS/MS system integrated with the SELDI-TOF mass spectrometer (9, 10, 18).
A second drawback of SELDI-TOF-MS is the reproducibility of relative protein abundance. Although SELDI-derived protein masses are consistent (intra- and interassay coefficients of variation of 0.07%), intra- and interassay coefficients of variation for protein peak intensities are on the order of 20%, and in the urine have ranged from 8-30% (17, 19). SELDI-TOF-MS is thus a semi-quantitative, high-throughput screening technique, and SELDI-derived candidate biomarkers need to be validated by another method.
SELDI-TOF-MS has been used for urine biomarker discovery in urological malignancies (20, 21), kidney transplant rejection (22, 23), intravenous contrast nephropathy (16), urolithiasis (15), ischemic acute kidney injury (15), and SLE nephritis (24). Five potential polypeptide biomarkers were identified for transitional cell carcinoma of the bladder, and one of them was subsequently shown to be a member of the defensin family (20). In acute allograft rejection there was no concordance of the results of three studies that used protein ion expression patterns to define biomarkers (22, 23, 25). One SELDI-TOF-MS evaluation of acute rejection produced a list of peaks that were later identified using microcapillary LC/MS/MS as proteolytic products of β2 -microglobulin, presumably reflecting damage to renal proximal tubular cells (26). Only two SLE nephritis studies used the SELDI platform to examine the urine proteome. One reported two protein ions at m/z 3340 and 3980 that together distinguished active nephritis from inactive nephritis with 92% sensitivity and specificity, but the actual peptides were not identified (24). The other investigation found 8 protein ions that correlated with renal disease activity (27). The majority of these were larger than 20 kDa and mainly unidentified, but one appeared to be albumin (27).
In the current study SELDI-TOF-MS was used to screen the LMW proteome of prospectively acquired, serial urine samples from a cohort of SLE patients with known renal involvement, to demonstrate the feasibility of candidate biomarker discovery for specific phases of the lupus nephritis flare cycle, according to the scheme outlined in Figure 1. Twenty seven peptide ions showed statistically significant differential expression over the flare cycle. Selected protein ions were characterized further by on-chip peptide sequencing and were identified as hepcidin, α1-antitrypsin (A1AT) and a fragment of albumin. These data show that urine proteomic screening with SELDI-TOF-MS followed by MS peptide sequencing can positively identify peptides that can then be validated as lupus nephritis biomarkers.
Figure 1.

Analysis scheme for urine protein phenotyping of SLE nephritis flare cycle.
Results
The LMW urine proteome from 25 moderate-severe SLE nephritis flare cycles in 19 patients was studied. These patients were all female, 53% were Caucasian, 42% African American, and 5% Asian. The patients’ initial kidney biopsies showed class III (n=5), class IV (n=11), and class V (n=3) nephritis, and 27% of the flares were adjudicated as severe, while 73% were considered moderate.
SELDI-TOF-MS identified 176 protein peaks (m/z protein ions) between 2000 and 20 000 m/z, using a weak cation exchanger protein chip. Ninety-six protein ions were present in over 30% of the flare cycles, and 43 peaks were present in over 60% of the flare cycles. A typical SELDI-TOF-MS spectrum from a whole flare cycle is shown in Figure 2A, illustrating how SELDI-TOF-MS spectra can capture dynamic changes in urine protein expression during the evolution of a lupus nephritis flare. As illustrated, more protein ions progressively appear between 2000 and 4000 m/z as the flare develops, from an average of 18 peaks at baseline to 23 peaks at flare (p < 0.0001). These proteins peaks disappear when the flare is effectively treated and renal SLE activity returns to baseline. Importantly, changes in the urine proteome can occur in either direction during the evolution of a flare, as shown by the decrease in some protein ions between pre-flare and flare (Fig 2B).
Figure 2.

Urine SELDI spectra of class IV SLE nephritis flare cycles. A. The spectra of a whole flare cycle are presented between the 2000 and 10 000 Dalton region. The LMW urine proteome shows an overall increase in peaks between 2000 and 4000 Dalton as flare approaches, which then decrease during flare treatment. Peak intensity (relative protein abundance) is given on the y-axis. B. The spectra from 4 months pre-flare and flare of a Class IV GN patient showing that some protein ions decrease at the flare.
Differentially expressed protein ions
Twenty-seven protein ions showed significant differential expression between specific flare intervals (Table 1). To minimize false-positive results, candidate biomarkers were arbitrarily chosen from those protein ions that showed a change in expression of ≥1.5-fold. Of the 27 differentially-expressed protein ions, 25 met this criterion, were present in 32-92% of the flares, and were between 2000 and 10 000 m/z (Table 1). Of the 27 protein ions in Table 1, 16 fell between the baseline and pre-flare phases, 5 peaks between the pre-flare and flare phases, 7 peaks between the flare and post-flare phases, and 6 peaks were differentially-expressed over multiple intervals. Although no single peak appears in all of the SLE renal flares, several combinations of two peaks were observed in 100% of the flare cycles between remission and pre-flare, and between flare and post-flare (Table 2).
Table 1.
SELDI protein ions showing differential expression between SLE renal flare states
| No | Peak | M/Z1 | ID | Frequency3 | Fold Change Between Groups4 | ||||||||
|---|---|---|---|---|---|---|---|---|---|---|---|---|---|
| 4-/B2 | 2-/B | 2+/B | 4+/B | F/4- | F/2- | F/2+ | F/4+ | 2+/4+ | |||||
| 1 | M1 | 2010 | 0.32 | 2.7 | 2.1 | ||||||||
| 2 | M4 | 2094 | 0.48 | 1.6 | |||||||||
| 3 | M8 | 2198 | Hepcidin | 0.72 | 1.5 | ||||||||
| 4 | M11 | 2274 | 0.36 | 3.7 | 2.8 | ||||||||
| 5 | M15 | 2364 | 0.48 | 3.1 | 1.4 | ||||||||
| 6 | M16 | 2380 | 0.76 | 1.2 | 1.6 | ||||||||
| 7 | M17 | 2395 | A1AT | 0.84 | 2.1 | 2.1 | 2.3 | ||||||
| 8 | M18 | 2411 | 0.52 | 2.4 | |||||||||
| 9 | M21 | 2500 | 0.64 | 1.8 | |||||||||
| 10 | M26 | 2648 | Albumin | 0.76 | 1.94 | ||||||||
| 11 | M28 | 2686 | 0.84 | 1.7 | |||||||||
| 12 | M34 | 2797 | Hepcidin | 0.6 | 0.6 | ||||||||
| 13 | M58 | 3398 | 0.72 | 2.0 | |||||||||
| 14 | M70 | 3712 | 0.92 | 1.7 | |||||||||
| 15 | M74 | 3827 | 0.44 | 1.9 | |||||||||
| 16 | M77 | 3886 | 0.32 | 1.9 | |||||||||
| 17 | M85 | 4058 | 0.6 | 1.7 | |||||||||
| 18 | M87 | 4096 | 0.4 | 0.7 | |||||||||
| 19 | M89 | 4132 | 0.72 | 1.7 | |||||||||
| 20 | M93 | 4248 | 0.32 | 0.6 | |||||||||
| 21 | M95 | 4293 | 0.56 | 2.3 | 1.6 | ||||||||
| 22 | M101 | 4427 | 0.56 | 1.1 | |||||||||
| 23 | M105 | 4540 | 0.4 | 1.5 | |||||||||
| 24 | M123 | 5080 | 0.36 | 0.4 | |||||||||
| 25 | M125 | 5225 | 0.36 | 0.5 | |||||||||
| 26 | M137 | 5700 | 0.36 | 1.6 | |||||||||
| 27 | M161 | 8018 | 0.72 | 1.4 | |||||||||
All protein ions are statistically significant with p < 0.05, and the highlighted numbers denote p<0.01
B stands for Baseline, F for Flare, 4- for 4 months pre-flare, 2- for 2 months pre-flare, 2+ for 2 months post-flare, and 4+ for 4 months post-flare.
Frequency indicates the percent of patients having the peak in the urine.
Fold change between groups is done in the indicated time order, for example, e.g. 4-/ B stands for relative peak intensity at 4 months pre-flare divided by the intensity at baseline.
Table 2.
Frequency of combined protein ions in SLE flare states
| Comparison Groups | Individual Protein Ion with Frequency | Combined Frequency | ||||||||
|---|---|---|---|---|---|---|---|---|---|---|
| M15 48% |
M16 76% |
M17 84% |
M28 84% |
M34 60% |
M58 72% |
M70 92% |
M95 56% |
M161 72% |
||
| Remission and Pre-flare | √ | √ | 100% | |||||||
| √ | √ | 100% | ||||||||
| √ | √ | 100% | ||||||||
| √ | √ | 100% | ||||||||
| √ | √ | 100% | ||||||||
| Flare and Post-flare | √ | √ | 100% | |||||||
| √ | √ | 100% | ||||||||
| √ | √ | 100% | ||||||||
The qualitative expression pattern of each candidate biomarker was examined throughout the flare cycle. Nineteen protein ions varied in parallel with the cycle, increasing or decreasing in intensity as flare approached, and then returning to baseline expression. Protein ions that fluctuated randomly over the flare cycle were not considered further as candidate biomarkers. The time-dependent expression of 4 representative candidate proteins is shown in Figure 3. Protein ions M1, M11 and M17 increased over the flare cycle while M87 decreased.
Figure 3.

Expression of candidate urine biomarkers over time. The mean relative intensities of 4 differentially expressed protein ions (log-transformed data for M87) are plotted at several points of the renal flare cycle. Error bars indicate standard errors (A-D).
Effect of immunosuppressive medications
To determine if immunosuppressive medications affected urine SELDI-TOF-MS profiles, the correlations of prednisone, mycophenolate mofetil, and azathioprine dose to protein peak intensity 2 months pre-flare, at flare, and 2 months post-flare were calculated for 6 high frequency protein peaks (M8, M16, M17, M26, M28, M70). Of the 54 possible linear regressions for this data set, 50 showed no significant correlation between medication dose and urine peptide level. Minor correlations between peak M16 at flare (r2=0.24, p=0.034) and post-flare (r2=0.28, p=0.025), and peak M70 post-flare (r2=0.24, p=0.022) were observed with prednisone dose. Peak M26 displayed a strong positive correlation with prednisone dose at flare (r2=0.54, p=0.0004), suggesting its urinary expression may have been enhanced by corticosteroids.
Peptide identification
To demonstrate that candidate LMW urine biomarkers found by SELDI-TOF-MS screening can be positively identified, direct on-chip peptide sequencing was done for selected protein ions with a m/z less than 5000, that were expressed at high frequency, changed equal to or more than 1.5 fold between at least two phases of the flare cycle, and varied in parallel with the flare cycle. Using this technique, protein ions M8, M34, M17 and M26 were positively identified.
M8 and M34 correspond to the 20 and 25 amino acid (aa) isoforms of hepcidin (Fig 4A). A 22 aa hepcidin isoform was also found in the urine of SLE patients (Fig. 4A), but was not differently expressed between any 2 phases of the flare cycle, and thus not considered a candidate biomarker. The time course of hepcidin expression is shown in Figure 4B. Hepcidin 20 (m/z 2198) increased 4 months pre-flare and then slowly returned to baseline by 4 months post-flare. Hepcidin 25 (m/z 2432) decreased at flare and returned to baseline by 4 months post-flare. There was no correlation between the 20 and 25 aa isoforms. There was no correlation between hepcidin 20 or 25 and eGFR (r2=0.18, p=0.08; r2=0.07, p=0.35, respectively). The presence of hepcidin in urine was further confirmed by LC/MS/MS from patients in whom hepcidin was identified by on-chip sequencing. Figure 4C shows the on-chip CID fragmentation of urine hepcidin 25. Figures 4D - 4E demonstrate LC/MS/MS detection of an internal peptide of hepcidin 25 (y-ions labeled) in the urine of an SLE patient.
Figure 4.
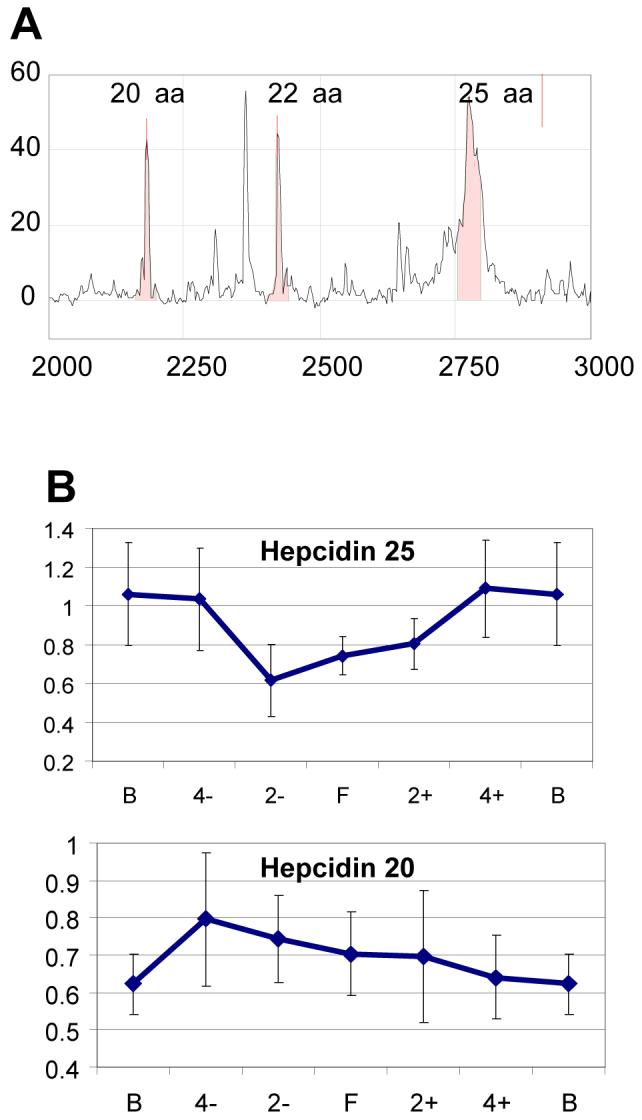

Urine Hepcidin Expression in SLE Nephritis. A. A typical urine SELDI spectrum in a class IV LN urine showing three hepcidin isoforms of 20, 22 and 25 at m/z of 2197, 2432 and 2798, respectively. B. Time course of hepcidin 20 and 25 expression (mean relative intensities) during the SLE nephritis flare cycle. Error bars indicate standard errors. C. On-chip CID fragmentation of peak 34, used to identify the ion as hepcidin 25. D. MS fragments of trypsin-digested hepcidin 25 standard. E. LC/MS/MS detection of the internal peptide of hepcidin 25 (y-ions are labeled) in the urine of an SLE nephritis patient.
M17 (m/z 2395) and M26 (m/z 2648) correspond to a fragment of the 46 kDa precursor of α1-antitrypsin (A1AT), and a fragment of the N-terminal region of albumin, respectively. Both are abundant serum proteins. The A1AT fragment increased at flare, while the albumin fragment increased 4 month pre-flare compared to baseline (Fig 5A). Corresponding SELDI spectra for A1AT and albumin are shown in Figure 5B-5C.
Figure 5.

Urine expression of A1AT and an albumin fragment during SLE renal flare. A. SELDI relative intensity of M17 (A1AT) and M26 (Albumin) between baseline and flare, and baseline and 4 month pre-flare. B. SELDI spectrum of M17 at flare; C. SELDI spectrum of M26 pre-flare.
Renal Expression of hepcidin
Biopsies from patients with SLE nephritis were stained for hepcidin, and infiltrating interstitial leukocytes were shown to express hepcidin (Fig. 6). There was virtually no staining of renal parenchymal cells. Similarly, in a normal kidney the only cell stained was an interstitial cell, likely a resident macrophage. Hepcidin expression was minimal in the control kidney compared to SLE nephritis.
Figure 6.

Intrarenal expression of hepcidin. Immunohistochemical staining for hepcidin is shown for renal biopsy material from a normal kidney (Cont), and three patients with class IV SLE nephritis (SLE). The positive cells are infiltrating interstitial leukocytes.
Discussion
This investigation demonstrates the feasibility of using SELDI-TOF-MS as a screening technique to examine serial changes in the urine proteome of SLE patients during lupus nephritis flares. By understanding how specific urine proteins change as a renal flare develops, becomes clinically apparent, and is treated and resolves, it is likely that clinically relevant biomarkers will be identified that can provide diagnostic, pathogenic, and therapeutic information on each phase of the flare cycle. Although SELDI-TOF-MS has been used to examine the urine proteome in a variety of conditions, including lupus nephritis, peptide expression patterns have mainly been described that differentiate between static disease states (23-25). Few studies have used a longitudinal proteomic approach to identify specific proteins that can be verified and then validated in an independent sample set. As proof-of-concept, we examined the dynamic changes in the urine proteome over the SLE renal flare cycle and showed that hepcidin, A1AT, and an albumin fragment are differentially expressed during different phases of a nephritis flare. Interestingly, immunosuppressive medications had little effect on the expression of urine peptides detected by SELDI.
Hepcidin as a candidate biomarker may be our most interesting finding. It is a LMW peptide hormone that has antimicrobial activity, regulates iron homeostasis, and has been implicated in the pathogenesis of the anemia of chronic inflammation, including that of chronic kidney disease (28-32). Hepcidin is mainly produced in the liver as pro-hepcidin, and undergoes N-terminal modification to yield the active C-terminal peptides of 20-25 aa, however other investigators have also found hepcidin in urine, and hepcidin 20 and 25 were dominant (28). Recent studies suggest that hepcidin may be made by renal tubular cells (33). While we could not verify this, we did demonstrate intrarenal expression of hepcidin by infiltrating leukocytes in patients with SLE nephritis, raising the possibility that during renal flare hepcidin is produced within the kidney, rather than simply being filtered.
Urine hepcidin has been shown to increase during inflammation, and decline as inflammation resolved (34-36). Hepcidin expression is induced by interleukin-6 (IL-6) and is suppressed by TNF-α (31, 37), cytokines that are implicated in the pathogenesis of SLE (38-40). Therefore measurement of urine hepcidin isoforms during lupus flare may reflect the complex balance and changing expression of proinflammatory cytokines in lupus kidneys. It is intriguing to speculate that because expression of hepcidin 20 is altered pre-flare, it may be a biomarker of impending renal flare. In contrast, and consistent with our data that hepcidin 20 and 25 may be regulated independently, hepcidin 25 decreases at flare and increases during treatment, suggesting it may be a useful marker for following response to therapy. In this regard, urine hepcidin will need to be verified as a lupus nephritis biomarker, and shown to be a better indicator of SLE activity than urine cytokines such as IL-6 or TNF-α (41, 42).
A1AT and albumin fragments were also found to be differentially expressed in the urine during SLE renal flare. Although the parent proteins are not from the LMW proteome, these findings still may be important in SLE nephritis. For example, A1AT is made in the kidney, and can be induced by cytokines such as IL-6 (43, 44). Thus, A1AT could be a marker of proinflammatory cytokine production. Furthermore, specific albumin and A1AT fragments have been found in the serum and urine of patients with glomerulonephritis (45). It is conceivable that the fragmentation pattern of these proteins reflects pathogenic proteolytic activity during kidney disease, and the appearance of specific fragments in the urine could thus serve as a biomarker of this process. Conversely, charge variants of A1AT and albumin were found to be part of a group of urine proteins that could be used to distinguish between SLE and other proteinuric glomerular diseases (46). It will thus be important to characterize the fragments of A1AT and albumin present throughout the SLE renal flare cycle, and see whether fragments or charge variants of intact proteins, provide the most diagnostic information in SLE nephritis.
Despite the large number of protein peaks detected in raw urine, only 19 differentially expressed protein ions survived our moderately stringent criteria arbitrarily established for biomarker relevance to lupus nephritis. Furthermore, certain combinations of two candidate protein ions were found in all flare cycles, suggesting that validated biomarkers will be useful in most lupus patients, and that 2 or more biomarkers may be necessary to fully characterize phases of the flare cycle. These findings are consistent with other SELDI studies that showed only a few protein ions (3-13) were needed to separate disease from control groups, or predict kidney injury with high sensitivity and specificity (15, 16, 22, 23, 25). When SELDI-TOF-MS was used to distinguish between active and inactive SLE nephritis, it was reported that of 32 protein ions which varied significantly between active and quiescent SLE, a combination of two protein ions provided the most power for diagnosing active nephritis (24). Most of these studies used only one or two types of protein chips. To interrogate the entire proteome will require using a wide variety of protein chip binding surfaces. Nonetheless, this technique appears to be capable of delivering a manageable number of candidate protein peaks. This is important, considering the need to identify and validate each potential biomarker.
In conclusion, this work demonstrates the feasibility of using SELDI-TOF-MS to screen for differential protein expression during the evolution of SLE renal flares. This technique yields a testable number of biomarker candidates that can then be specifically identified. This eliminates the need for protein patterns as biomarkers, and allows validation and testing of candidate proteins in independent patient cohorts. Of three potential biomarkers identified in this study, hepcidin appears to have a significant relationship to proinflammatory cytokines thought to mediate lupus nephritis, and is presently undergoing further evaluation in SLE in our laboratories.
Methods
Urine samples
A total of 145 urine samples were obtained from the Ohio SLE Study (OSS) specimen bank. The OSS is a prospective, longitudinal study of patients with 4 or more American College of Rheumatology criteria for SLE, and has been described previously (47). The OSS was approved by the local IRB, and all patients gave informed consent to participate. Urine samples were from 19 patients with SLE nephritis who experienced 25 moderate to severe renal flares. The criteria used to adjudicate and classify the severity of renal flares in the OSS have been published (47). Urine was collected prospectively at 2 month intervals over several years from the OSS cohort. Fresh urine from each patient visit was centrifuged to remove cellular debris and rapidly frozen at -80°C in small aliquots until use. Urine creatinine and protein concentrations were measured using the Roche Creatinine Reagent (Roche Diagnostic Corporation, Indianapolis, IN) and the Bio-Rad RC-DC Protein Assay (BioRad Laboratories, Hercules, CA), respectively.
Urine proteomes were examined from 4 phases of the SLE renal flare cycle: pre-flare, flare, treatment, and baseline. Pre-flare specimens were from 4 and 2 months before flare diagnosis, flare specimens were obtained at flare diagnosis, and treatment specimens were from 2 and 4 months after flare diagnosis. Baseline urines were chosen from specimens obtained more than 6 months away from any renal flare, and when patients had a stable serum creatinine and no proteinuria, or proteinuria values that had returned to pre-flare levels. Baseline samples could have preceded or followed the flare cycle under investigation, and in cases where both were available their data were combined to give a composite baseline.
To isolate the LMW urine proteome, urine protein size fractionation was done using VIVASPIN 500 spin columns (Vivascience, Carlsbad CA) having a molecular weight cut off of 30,000 Da to remove abundant, high-molecular weight proteins such as albumin. To avoid loss of LMW proteins bound to albumin, the urine was first denatured by adding 200 μl of urine to 300 μl of denaturing buffer (9M urea/2% CHAPS) for 30 min at 4°C. The denatured urine was then added to the spin columns and the flow-through was used for SELDI-TOF-MS analyses.
SELDI-TOF-MS Screening of the LMW Urine Proteome
Pilot experiments included protein chip selection and optimization of protein chip binding conditions. Among all the protein chips tested the best spectral data were obtained using a weak cation exchanger (CM10 chip, Ciphergen, Fremont, CA), which was subsequently used for this proof-of-concept study. All of the CM10 chips used in this investigation were from the same lot, samples were placed on the chips in random order, and as much as possible samples from the same patient were placed on a single chip. All data were acquired within 3 days, except for 2 chips that were read within 2 weeks. Fifty μl of urine sample mix (5 μl fractionated, denatured urine and 45 μl of 40 mM ammonium acetate pH 4.0, 0.1 % Triton-X 100 buffer containing 10 fmol bovine insulin (Sigma, St. Louis, MO)) was added to each spot. The bovine insulin served as an internal standard for protein mass accuracy and was used to control for intra- and inter-chip variance of peak intensity. The linear binding range for insulin on CM10 ProteinChip is 1-50 fmol, and correlated to peak height with an r2 of 0.99 at pH 4.0, a pH well below the insulin pI of 5.65 (data not shown). Using endogenous urine protein ions normalized to bovine insulin, the intra-chip coefficient of variation (CV) for peak height was 11% and inter-chip CV was 19.7%, values compatible to or better than those previously reported (18, 24). After binding, chips were washed, dried and 1.0 ul of an energy absorbing molecule (30% CHCA in 50% Acetonitrile (ACN) and 0.5% Trifluoroacetic Acid (TFA)), was added.
Urine protein spectra were acquired with a Protein Chip PBS II Reader (Ciphergen) set to an optimum mass range of 500-20 000 Da, a laser intensity of 195 with 2 warming shots (not collected), a sensitivity of 9, and collection of 50 transient shots across the spot surface. To minimize the protein chip spot variance, each urine sample was done on duplicate spots. External calibration of the Protein Chip Reader was performed using the Ciphergen Biosystem All-in-1 peptide standard C100-0005, and the calibration equation was applied to each spectrum before analysis to ensure the peak accuracy.
Data Analysis
Protein peaks were detected by second-pass peak selection and restricted to a signal-to-noise ratio of ≥ 2, minimum valley depth of 2 and sensitivity of 100%. The mass range from 2000-20 000 Da was selected for analysis since this range contained the majority of the resolved protein/peptides. The detected peaks from different patients were aligned manually according to the peak accuracy variance, which was less than 0.5% for the internal insulin calibration standard (data not shown). Only peaks present in more than 30% of the flares were analyzed further, in an effort to screen for biomarkers of general applicability to SLE nephritis. The spectra were normalized to the total ion current within duplicates to minimize the protein chip spot variance. The intensity of each peak in the spectra was then further normalized to the internal insulin control, and urine creatinine concentration to account for urine dilution. Protein peaks were compared stepwise between 2 phases of the renal flare cycle, as illustrated in Figure 1. Data were analyzed by the paired t-test or the Wilcoxon matched pairs test, based on whether they were or were not normally distributed. These statistical tests rather than repeated measures ANOVA were used because the standard deviation of the data was not stable over time. A two-tailed alpha level of < 0.05 was considered significant.
Peptide identification
For direct on-chip peptide sequencing and identification (48) the CM10 chip was reduced by with DTT and selected, differentially-expressed peptide ions less than 5000 Da were sequenced. Sequence data were obtained using a Protein Chip Tandem MS Interface with a front-end SELDI ion source for the Applied Biosystem/MDS Sciex QStar Hybrid LC/MS/MS System (Ciphergen, Fremont, CA). The protein chip interface used a 337 nm nitrogen laser with a lensed fiber optic, delivering 150mJ of energy per pulse at 30 pulses/second. Peptides underwent collision-induced dissociation (CID) by applied collision energy of 50eV/kDa. Sample spot scanning was controlled via Protein Chip Interface Control Software (Bio-Rad Laboratories), while data analysis and acquisition were carried out using the QStar System’s Analyst software (Applied Biosystems, Inc. Foster City, CA). This system is capable of high amole-low fmole MS and MS/MS sensitivity. The sequences resulting from spectral data were submitted to the database mining tool Mascot (49) for identification.
Results of on-chip identification were further confirmed using Nano-LC/MS/MS at the Ohio State Mass Spectrometry and Proteomics Facility. Briefly urine samples and human hepcidin 20 and 25 peptide standards (Alpha Diagnostics International Inc, San Antonio, TX) were digested in trypsin and Nano-LC/MS/MS was performed on a Thermo Finnigan LTQ mass spectrometer (Waltham, MA) equipped with a nanospray source operated in positive ion mode. The LC system was an UltiMate™ Plus system from LC-Packings A Dionex Co (Sunnyvale, CA) with a Famos autosampler and Switchos column switcher. The scan sequence of the mass spectrometer was based on the TopTen™ method. Analysis was programmed for a full scan recorded between 350 - 2000 Da, and a MS/MS scan to generate product ion spectra to determine amino acid sequence in consecutive instrument scans of the ten most abundant peaks in the spectrum. Sequence information from the MS/MS data was converted to a merged file and then was searched using Mascot Daemon version 2.2.1 by Matrix Science (Boston, MA) and the database searched against the full SwissProt database version 54.1 (283454 sequences; 104030551 residues). Protein identifications were checked manually and proteins with a Mascot score of 50 or higher with a minimum of two unique peptides from one protein having a -b or -y ion sequence tag of five residues or better were accepted.
Immunohistochemistry
Renal biopsy material from 3 cases of class IV lupus nephritis, and one normal transplant donor kidney were stained with a rabbit anti-hepcidin polyclonal antibody (ABCAM), and visualized with DAB. Paraffin embedded tissue was used, endogenous peroxidase was quenched with hydrogen peroxide, and antigen retrieval was done with citric acid (pH 6.1) for 25 minutes at 94°C before incubation with the primary antibody (1:500) overnight at 4°C. No staining was observed with a non-immune control antibody.
Acknowledgement
This work was presented in abstract form at the 2007 American Society of Nephrology Meeting in San Francisco.
This work was supported in part by NIDDK grant P01 DK55546 (BHR, DJB, CYY, LAH).
Footnotes
Disclosure
The authors have no interests to disclose relevant to this publication.
References
- 1.Brown FG, Nikolic-Paterson DJ, Hill PA, et al. Urine macrophage migration inhibitory factor reflects the severity of renal injury in human glomerulonephritis. J Am Soc Nephrol. 2002;13:S7–S13. [PubMed] [Google Scholar]
- 2.Fiehn C, Hajjar Y, Mueller K, et al. Improved clinical outcome of lupus nephritis during the past decade: importance of early diagnosis and treatment. Ann Rheum Dis. 2003;62:435–9. doi: 10.1136/ard.62.5.435. [DOI] [PMC free article] [PubMed] [Google Scholar]
- 3.Houssiau FA, Vasconcelos C, D’Cruz D, et al. Early response to immunosuppressive therapy predicts good renal outcome in lupus nephritis. Arthritis Rheum. 2004;50:3934–40. doi: 10.1002/art.20666. [DOI] [PubMed] [Google Scholar]
- 4.Illei GG, Tackey E, Lapteva L, Lipsky PE. Biomarkers in systemic lupus erythematosus: General overview of biomarkers and their applicability. Arthritis Rheum. 2004;50:1709–20. doi: 10.1002/art.20344. [DOI] [PubMed] [Google Scholar]
- 5.Illei GG, Tackey E, Lapteva L, Lipsky PE. Biomarkers in systemic lupus erythematosus: Markers of disease activity. Arthritis Rheum. 2004;50:2048–65. doi: 10.1002/art.20345. [DOI] [PubMed] [Google Scholar]
- 6.Schiffenbauer J, Hahn B, Weisman MH, Simon LS. Biomarkers, surrogate markers, and design of clinical trials of new therapies for systemic lupus erythematosus. Arthritis Rheum. 2004;50:2415–22. doi: 10.1002/art.20353. [DOI] [PubMed] [Google Scholar]
- 7.Harry JL, Wilikins MR, Herbert BR, et al. Proteomics: Capacity versus utility. Electrophoresis. 2000;21:1071–81. doi: 10.1002/(SICI)1522-2683(20000401)21:6<1071::AID-ELPS1071>3.0.CO;2-M. [DOI] [PubMed] [Google Scholar]
- 8.James P. Protein identification in the post-genome era: the rapid rise of proteomics. Q Rev Biophys. 1997;30(4):279–331. doi: 10.1017/s0033583597003399. [DOI] [PubMed] [Google Scholar]
- 9.Piubelli C, Galvani M, Hamdan M, et al. Proteome analysis of rat polymorphonuclear leukocytes: A two-dimensional electrophoresis/mass spectormetry approach. Electrophoresis. 2002;23:298–310. doi: 10.1002/1522-2683(200202)23:2<298::AID-ELPS298>3.0.CO;2-I. [DOI] [PubMed] [Google Scholar]
- 10.Rai AJ, Zhang Z, Rosenzweig J, et al. Proteomic approaches to tumor marker discovery: Identification of biomarkers for ovarian cancer. Arch Pathol Lab Med. 2002;126:1518–26. doi: 10.5858/2002-126-1518-PATTMD. [DOI] [PubMed] [Google Scholar]
- 11.Knepper MA. Porteomics and the kidney. J Am Soc Nephrol. 2002;13:1398–408. doi: 10.1097/01.asn.0000014782.37591.c7. [DOI] [PubMed] [Google Scholar]
- 12.Oates JC, Varghese S, Bland AM, et al. Prediction of urinary protein markers in lupus nephritis. Kidney Int. 2005;68:2588–92. doi: 10.1111/j.1523-1755.2005.00730.x. [DOI] [PMC free article] [PubMed] [Google Scholar]
- 13.Reddy G, Dalmasso EA. SELDI ProteinChip array technology: Protein-based predictive medicine and drug discovery applications. J Biomed Biotech. 2003;4:237–41. doi: 10.1155/S1110724303210020. [DOI] [PMC free article] [PubMed] [Google Scholar]
- 14.Stone JH, Rajapakse VN, Hoffman GS, et al. A serum proteomic approach to gauging the state of remission in Wegener’s granulomatosis. Arthritis Rheum. 2005;52:902–10. doi: 10.1002/art.20938. [DOI] [PubMed] [Google Scholar]
- 15.Voshol H, Brendlen N, Muller D, et al. Evaluation of biomarker discovery approaches to detect protein biomarkers of acute renal allograft rejection. J Prot Res. 2005;4:1192–9. doi: 10.1021/pr050060+. [DOI] [PubMed] [Google Scholar]
- 16.Hampel DJ, Sansome C, Sha M, et al. Toward proteomics in uroscopy: Urinary protein profiles after radiocontrast medium administration. J Am Soc Nephrol. 2001;12:1026–35. doi: 10.1681/ASN.V1251026. [DOI] [PubMed] [Google Scholar]
- 17.Schaub S, Wilkins J, Weiler T, et al. Urine protein profiling with surface-enhanced laser-desorption/ionization time-of-flight mass spectrometry. Kidney Int. 2004;65:323–32. doi: 10.1111/j.1523-1755.2004.00352.x. [DOI] [PubMed] [Google Scholar]
- 18.Ranganathan S, Williams E, Ganchev P, et al. Proteomic profiling of cerebrospinal fluid identifies biomarkers for amyotrophic lateral sclerosis. J Neurochem. 2005;95:1461–71. doi: 10.1111/j.1471-4159.2005.03478.x. [DOI] [PMC free article] [PubMed] [Google Scholar]
- 19.Soltys SG, Le Q-T, Shi G, Tibshirani R, et al. The use of plasma surface-enhanced laser desorption/ionization time-of-flight mass spectrometry proteomic patterns for detection of head and neck sequamous cell cancers. Clin Can Res. 2004;10:4806–12. doi: 10.1158/1078-0432.CCR-03-0469. [DOI] [PubMed] [Google Scholar]
- 20.Vlahou A, Schellhammer P, Mendrinos S, et al. Development of a novel proteomic approach for the detection of transitional cell carcinoma of the bladder in urine. Am J Pathol. 2001;158:1491–502. doi: 10.1016/S0002-9440(10)64100-4. [DOI] [PMC free article] [PubMed] [Google Scholar]
- 21.Rogers MA, Clarke P, Noble J, et al. Proteomic profiling of urinary proteins in renal cancer by surface enhanced laser desorption ionization and neural-network analysis: identification of key issues affecting potential clinical utility. Can Res. 2003;63:6971–83. [PubMed] [Google Scholar]
- 22.Clark W, Silverman BC, Zhang Z, et al. Characterization of renal allograft rejection by urinary proteomic analysis. Ann Surg. 2003;237:660–4. doi: 10.1097/01.SLA.0000064293.57770.42. [DOI] [PMC free article] [PubMed] [Google Scholar]
- 23.Schaub S, Rush D, Wilkins J, et al. Proteomic-based detection of urine proteins associated with renal allograft rejection. J Am Soc Nephrol. 2004;15:219–27. doi: 10.1097/01.asn.0000101031.52826.be. [DOI] [PubMed] [Google Scholar]
- 24.Mosley K, Tam FWK, Edwards RJ, Crozier J, et al. Urinary proteomic profiles distinguish between active and inactive SLE nephritis. Rheumatol. 2006 doi: 10.1093/rheumatology/kel351. in press. [DOI] [PubMed] [Google Scholar]
- 25.O’Riordan E, Orlova TN, Mei J, et al. Bioinformatic analysis of the urine proteome of acute allograft rejection. J Am Soc Nephrol. 2004;15:3240–8. doi: 10.1097/01.ASN.0000145241.83482.68. [DOI] [PubMed] [Google Scholar]
- 26.Schaub S, Wilkins JA, Antonovici M, et al. Proteomic-based identification of cleaved urinary beta2-microglobulin as a potential marker for actue tubular injury in renal allografts. Am J Transplant. 2005;5:729–238. doi: 10.1111/j.1600-6143.2005.00766.x. [DOI] [PubMed] [Google Scholar]
- 27.Suzuki M, Ross GF, Wiers K, et al. Identification of a urinary proteomic signature for lupus nephritis in children. Pediatr Nephrol. 2007;22:2047–57. doi: 10.1007/s00467-007-0608-x. [DOI] [PubMed] [Google Scholar]
- 28.Yang CW, Ahn HJ, Han HJ, et al. Phapracological preconditioning with low-dose cyclosporine or FK506 reduces subsequent ischemia/reperfusion injury in rat kidney. Transplantation. 2001;72:1753–9. doi: 10.1097/00007890-200112150-00008. [DOI] [PubMed] [Google Scholar]
- 29.Malyszko J, Malyszko JS, Brzosko S, et al. Adiponectin is related to CD146, a novel marker of endothelial cell activation/injury in chronic renal failure and peritoneally dialyzed patients. J Clin Endo Metab. 2004;89:4620–7. doi: 10.1210/jc.2004-0387. [DOI] [PubMed] [Google Scholar]
- 30.Deicher R, Horl WH. Hepcidin: a molecular link between inflammation and anaemia. Nephrol Dial Transplant. 2004;19:521–4. doi: 10.1093/ndt/gfg560. [DOI] [PubMed] [Google Scholar]
- 31.Nemeth E, Rivera S, Gabayan V, et al. IL-6 mediates hypoferremia of inflammation by inducing the synthesis of the iron regulatory hormone hepcidin. J Clin Invest. 2004;113:1271–6. doi: 10.1172/JCI20945. [DOI] [PMC free article] [PubMed] [Google Scholar]
- 32.Andrews NC. Anemia of inflammation: the cytokine-hepcidin link. J Clin Invest. 2004;113:1251–3. doi: 10.1172/JCI21441. [DOI] [PMC free article] [PubMed] [Google Scholar]
- 33.Kulaksiz H, Theilig F, Bachmann S, et al. The iron-regulatory peptide hormone hepcidin: expression and cellular localization in the mammalian kidney. J Endo. 2005;184:361–70. doi: 10.1677/joe.1.05729. [DOI] [PubMed] [Google Scholar]
- 34.Kemna EHJM, Pickkers P, Nemeth E, et al. Time-course analysis of hepcidin, serum iron, and plasma cytokine levels in humans injected with LPS. Blood. 2005;106:1864–6. doi: 10.1182/blood-2005-03-1159. [DOI] [PubMed] [Google Scholar]
- 35.Kemna EHJM, Tjalsma H, Laarakkers C, et al. Novel urine hepcidin assay by mass spectrometry. Blood. 2005;106:3268–70. doi: 10.1182/blood-2005-05-1873. [DOI] [PubMed] [Google Scholar]
- 36.Nemeth E, Valore EV, Territo M, et al. Hepcidin, a putative mediator of anemia of inflammation, is a type II acute-phase protein. Blood. 2003;101:2461–3. doi: 10.1182/blood-2002-10-3235. [DOI] [PubMed] [Google Scholar]
- 37.Lee P, Peng H, Gelbart T, et al. Regulation of hepcidin transcription by interleukin-1 and interleuking-6. Proc Natl Acad Sci USA. 2005;102:1906–10. doi: 10.1073/pnas.0409808102. [DOI] [PMC free article] [PubMed] [Google Scholar]
- 38.Tackey E, Lipsky PE, Illei GG. Rationale for interleukin-6 blockade in systemic lupus erythematosus. Lupus. 2004;13:339–43. doi: 10.1191/0961203304lu1023oa. [DOI] [PMC free article] [PubMed] [Google Scholar]
- 39.Mongan AE, Ramdahin S, Warrington RJ. Interleukin-10 response abnormalities in systemic lupus erythematosus. Scand J Immunol. 1997;46(4):406–12. doi: 10.1046/j.1365-3083.1997.d01-140.x. [DOI] [PubMed] [Google Scholar]
- 40.Aringer M, Smolen JS. Cytokine expression in lupus kidneys. Lupus. 2005;14:13–8. doi: 10.1191/0961203305lu2053oa. [DOI] [PubMed] [Google Scholar]
- 41.Li Y, Tucci M, Narain S, et al. Urinary biomarkers in lupus nephritis. Autoimmunity Rev. 2006;5:383–8. doi: 10.1016/j.autrev.2005.10.006. [DOI] [PubMed] [Google Scholar]
- 42.Tesar V, Masek Z, Rychlik I, et al. Cytokines and adhesion molecules in renal vasculitits and lupus nephritis. Nephrol Dial Transplant. 1998;13:1662–7. doi: 10.1093/ndt/13.7.1662. [DOI] [PubMed] [Google Scholar]
- 43.Drew PD, Franzoso G, Carlson LM, et al. Interferon regulatory factor-2 physically interacts with NF-kappaB in vitro and inhibits NF-kappaB induction of majory histocompatability class I and beta-2-microglobulin gene expression in transfected human neuroblastoma cells. J Neuroimmunol. 1995;63:157–62. doi: 10.1016/0165-5728(95)00140-9. [DOI] [PubMed] [Google Scholar]
- 44.Perlmutter DH, May LT, Sehgal PB. Interferon beta 2/interleukin 6 modulates synthesis of alpha 1 antitrypsin in human mononuclear phagocytes and in human hepatoma cells. J Clin Invest. 1989;84:138–44. doi: 10.1172/JCI114133. [DOI] [PMC free article] [PubMed] [Google Scholar]
- 45.Candiano G, Musante L, Bruschi M, et al. Repetitive fragmentation products of albumin and alpha1-antitrypsin in glomerular diseasses associated with nephrotic syndrome. J Am Soc Nephrol. 2006;17:3139–48. doi: 10.1681/ASN.2006050486. [DOI] [PubMed] [Google Scholar]
- 46.Varghese SA, Powell TB, Budisavljevic MN, et al. Urine biomarkers predict the cause of glomerular disease. J Am Soc Nephrol. 2007;18:913–22. doi: 10.1681/ASN.2006070767. [DOI] [PMC free article] [PubMed] [Google Scholar]
- 47.Rovin BH, Song H, Birmingham DJ, et al. Urine chemokines as biomarkers of human systemic lupus erythematosus activity. J Am Soc Nephrol. 2005;16:467–73. doi: 10.1681/ASN.2004080658. [DOI] [PubMed] [Google Scholar]
- 48.Caputo E, Moharram R, Martin BM. Methods for on-chip protein analysis. Anal Biochem. 2003;321:116–24. doi: 10.1016/s0003-2697(03)00361-0. [DOI] [PubMed] [Google Scholar]
- 49.Kemna EHJM, Tjalsma H, Podust VN, Swinkels DW. Mass spectrometry-based hepcidin measurements in serum and urine: Analytical aspects and clinical implications. Clin Chem. 2007;53:620–8. doi: 10.1373/clinchem.2006.079186. [DOI] [PubMed] [Google Scholar]