

Abstract
The transcription factor Nanog is essential for mammalian embryogenesis, as well as the pluripotency of embryonic stem (ES) cells. Work with ES cells and embryonal carcinoma (EC) cells previously identified positive and negative cis-regulatory elements that influence the activity of the Nanog promoter, including adjacent cis-regulatory elements that bind Sox2 and Oct-3/4. Given the importance of Nanog during mammalian development, we examined the cis-regulatory elements required for Nanog promoter activity more closely. In this study, we demonstrate that two positive cis-regulatory elements previously shown to be active in F9 EC cells are also active in ES cells. We also identify a novel negative regulatory region that is located in close proximity to two other positive Nanog cis-regulatory elements. Although this negative regulatory region is active in F9 EC cells and ES cells, it is inactive in P19 EC cells. Furthermore, we demonstrate that one of the positive cis-regulatory elements active in F9 EC cells and ES cells is inactive in P19 EC cells. Together, these and other studies suggest that Nanog transcription is regulated by the interplay of positive and negative cis-regulatory elements. Given that P19 appears to be more closely related to a later developmental stage of mammalian development than F9 and ES cells, differential utilization of cis-regulatory elements may reflect mechanisms used during development to achieve the correct level of Nanog expression as embryogenesis unfolds.
Keywords: Nanog, Oct-3/4, Sox2, enhancer, differentiation, stem cells, UTF1, FGF-4
INTRODUCTION
Interest in the transcription factor Nanog has grown considerably with the demonstration that Nanog null embryos do not form an epiblast, and fail to develop after the 4th or 5th day of gestation (Mitsui et al., 2003). Nanog expression is first detected at the morula stage. By the blastocyst stage its expression is restricted to the inner cell mass (Mitsui et al., 2003; Chambers et al., 2003; Hatano et al., 2005). As the embryo develops, Nanog continues to be expressed in the epiblast (E6.5 and E7.5), but not in the primitive endoderm. Later in development (E11.5), Nanog expression is detected in the genital ridge, and recent studies argue that Nanog is essential for the formation of germ cells (Chambers et al., 2007). To gain a better understanding of how Nanog influences mammalian embryogenesis, the regulation and function of Nanog has been studied in embryonic stem (ES) cells and embryonal carcinoma (EC) cells. The expression of Nanog shuts off at both the RNA and protein levels when ES cells and EC cells undergo differentiation (Mitsui et al., 2003; Chen et al., 2006). Elevating Nanog expression in both human and mouse ES cells sustains their ability to self-renew. Human ES cells with elevated Nanog expression can be maintained without a feeder layer (Darr et al., 2006), and elevating Nanog in mouse ES cells eliminates their need for LIF even in the absence of a feeder layer (Mitsui et al., 2003). Interestingly, although early studies argued that Nanog null mouse ES cells exhibit a tendency in vitro to differentiate into cells that exhibit the properties of parietal endoderm (Mitsui et al., 2003), a recent study has found that Nanog null ES cells can self-renew indefinitely in culture, and give rise to multiple cell types in mouse chimera studies (Chambers et al., 2007).
Nanog is a 305 amino acid homeodomain transcription factor that contains a strong transactivation domain in the C-terminal portion of the molecule (containing two potent subdomains), as well as a weaker transactivation domain in the N-terminal region of the molecule (Pan and Pei, 2003; Pan and Pei, 2005). Thus far, few genes have been shown to be regulated directly by Nanog. However, ChIP-chip studies (chromatin immunoprecipitation followed by microarray analysis of the immunoprecipitated DNA) have identified a large number of putative Nanog target genes (Boyer et al., 2005; Loh et al., 2006). Interestingly, many of the Nanog-associated genes are also co-occupied by the transcription factors Sox2 and Oct-3/4. This is of particular interest, because Sox2 and Oct-3/4 work together cooperatively to regulate an essential gene regulatory network that appears to orchestrate mammalian embryogenesis, as well as the pluripotency and self-renewal of ES cells (Nichols et al., 1998; Avilion et al., 2003; Chambers et al., 2003). More recently, affinity purification of Nanog from mouse ES cells has shown that it associates with a large number of nuclear proteins, including Oct-3/4 and Sall4 (Wang et al., 2006). This study also demonstrated that Nanog (∼34 kDA) may be present in multiple, high molecular weight complexes that range in size from 158 kDa to well over 700 kDa (Wang et al., 2006). Additional studies have confirmed the association between Nanog and Sall4 (Wu et al., 2006), and other studies have identified additional Nanog associated factors, including Smad1 (Suzuki et al., 2006). Remarkably, other studies argue that Nanog can self-associate to form to form dimers (Mullin et al., 2008).
Over the past several years, efforts have been undertaken to examine how the Nanog gene is regulated in ES cells, as well as their tumor-derived counterparts, EC cells. Importantly, differentiation of ES and EC cells is accompanied by loss of Nanog at both the protein and RNA level. Thus far, the specific pathways responsible for downregulating Nanog expression have not been well defined. To help understand how this gene is regulated, several studies have begun to identify the cis-regulatory elements that control Nanog expression in ES and EC cells. One of the regulatory regions identified in the 5′ flanking region of the Nanog gene contains binding sites for Sox2 and Oct-3/4, which are located ∼180 bp upstream of the transcription start site (Kuroda et al., 2005; Rodda et al., 2005; Boer et al., 2006). More specifically, the binding sites for Sox2 and Oct-3/4, which are collectively referred to as an HMG/POU cassette (Boer et al., 2006; Boer et al., 2007), are directly adjacent to one another (Kuroda et al., 2005; Rodda et al., 2005). HMG/POU cassettes with similar DNA sequences have been found in at least six other Sox2:Oct-3/4 target genes, which appear to make up a critical gene regulatory network (Boyer et al., 2005; Loh et al., 2006; Boer et al., 2007). In each of these genes, disruption of the HMG/POU cassette strongly impairs the activity of their promoters (Dailey et al., 1994; Yuan et al., 1995; Nishimoto et al., 1999; Nowling et al., 2003; Tokuzawa et al., 2003; Tomioka et al., 2002; Okumura-Nakanishi et al., 2005; Nakatake et al., 2006; Boer et al., 2007). In addition to the HMG/POU cassette, several other positive cis-regulatory elements have been identified in the 5′ flanking region of the Nanog gene. A STAT3 site and a FoxD3 site have been identified ∼ 5kb and ∼270 bp, respectively, upstream of the transcription start site of the Nanog gene (Suzuki et al., 2006; Pan et al., 2006). In addition, two Sp1/Sp3 binding sites located just upstream of the Nanog transcription start site have shown to activate the Nanog promoter (Wu and Yao, 2006), and other studies argue that Sall4 stimulates Nanog expression by binding to an enhancer located approximately 5 kb upstream of the Nanog promoter (Wu et al., 2006). Given the need to maintain Nanog within normal physiological levels (Mitsui et al., 2003; Chambers et al., 2003), it is not surprising that the Nanog gene has also been reported to be regulated by negative cis-regulatory elements (NREs). These include several putative p53 (Lin et al., 2005) and Tcf sites (Pereira et al., 2006) located approximately 600 to 900 bp and 3 to 5 kb, respectively, upstream of the transcription start site of the Nanog gene. Equally intriguing, ectopic expression of Nanog in EC and ES cells has been shown to inhibit the activity of its own promoter (Boer et al., 2007; Pan et al., 2006). Thus, the Nanog gene, like the Oct-3/4 and Sox2 genes, is regulated by a negative feedback loop.
To better understand how the Nanog gene is regulated, the work described in this study addressed three questions: 1) How does the time-course of Nanog downregulation, which takes place during differentiation, compare with the downregulation of other Sox2:Oct-3/4 target genes? 2) Does the proximal region of the Nanog promoter contain additional cis-regulatory elements? 3) Is the transcription of the Nanog gene controlled by the same cis-regulatory elements in ES and EC cells?
MATERIALS AND METHODS
Cell Culture Conditions
Stock cultures of mouse F9 EC cells and P19 EC cells were maintained in Dulbecco's modified Eagle's medium (DMEM, Invitrogen, Carlsbad, CA) supplemented with 10% fetal bovine serum (FBS, HyClone, Logan, UT) as reported previously (Rizzino et al., 1983). Where indicated, differentiation of F9 cells was induced by treatment with 5 μM retinoic acid (Acros Organics, Fisher Scientific, Pittsburg, PA). KH2 and D3 ES cells were maintained in DMEM supplemented with 15% FBS, 0.1 mM ß-mercaptoethanol (Sigma, St. Louis, MO), and 5 ng/ml LIF (Chemicon, Temecula, CA) as described previously (Ma et al., 1992). Stock cultures and all experimental cultures were maintained at 37°C in a moist atmosphere of 95% air and 5% CO2.
Transient Transfection Assays
F9 and P19 EC cells were seeded at 500,000 cells per 100-mm dish and transfected in duplicate the following day using the calcium phosphate precipitation method as described previously (Ma et al., 1992). Differentiated cells were seeded at 100,000 cells per 100-mm dish and transfected in duplicate 72 hours later using the calcium phosphate precipitation method. In addition to 18 μg of the promoter/reporter construct, the cells were co-transfected with 1 μg of the internal standard pCMV-ß-gal (Clontech, Palo Alto, CA) to normalize for any differences in transfection efficiency. Where indicated, either 1 or 3 μg of CMV-Nanog was co-transfected with the promoter/reporter construct. The cells were incubated overnight with the DNA-CaPO4 precipitate before being washed twice with serum-free medium and refed with DMEM supplemented with 10% FBS. KH2 ES cells were seeded at 150,000 cells per 60-mm dish and transfected in duplicate the following day using the Lipofectamine™ 2000 Transfection Reagent (Invitrogen), as described previously (Nowling et al., 2002), using 6 μg of the promoter/reporter construct and 1 μg of the internal standard pCMV-ß-gal. For all transfections, DNA from the empty vector, CMV5, was added where needed to ensure that all cells were transfected with the same amount of DNA. Chloramphenicol acetyltransferase (CAT) and ß-galactosidase activities were determined 48 hours after transfection for EC and ES cells, and 72 hours after transfection for differentiated cells, as described previously (Ma et al., 1992). The mean (average) and standard deviations were determined using the Excel spreadsheet. The Excel spreadsheet calculates standard deviations using the “nonbiased” or “n-1” method.
Plasmid Constructs
The plasmid construct Nanog −812/+171, also known as Nanog+E, has been described previously (Boer et al., 2007) and contains the Nanog promoter from −812 to +171 (relative to its transcription start site) cloned immediately upstream of a CAT reporter gene. The Nanog promoter/reporter constructs Nanog −580/+171, Nanog −460/+171, and Nanog −340/+171 were created by amplifying their respective promoter fragments from the Nanog −812/+171 construct, using the common lower primer for all three constructs: 5′-tgcAGATCTAAGGGATTTCTGAAAAGGTTTTAGGC-3′in conjunction with the following upper primers: −580: 5′-cctcGTCGACTTACTAAGGTAGCCCGAGTCTTAAGC-3′, −460: 5′-cctcGTCGACACGCTGAGTGCTGAAAGGAAAGCCG-3′, and −340: 5′-cctcGTCGACTCCCACTAGAGATCGCCAGGGTCTG-3′. The lower primer contains a BglII site (italics) and the upper primers contain a SalI site (italics), allowing for efficient cloning of the promoter fragments into the previously described pBLCAT7 reporter plasmid (Rosfjord et al., 1994). The Nanog −221/+171 promoter/reporter construct was constructed by HindIII restriction enzyme digest of Nanog −812/+171, which releases the −812 to −221 fragment, followed by ligation to create Nanog −221/+171.
The construct Nanog −812/+171(HP mut) was created from Nanog −812/+171 by replacing the HMG/POU cassette with a DNA sequence able to bind the DBD of the yeast transcription factor GAL4. This change was made by the cassette exchange method (Boer et al., 2006), using the following primers: 5′-ttctGGATCCGGTGGACTGTCCTCCGTCCATGGTGGACCCTGCAGGTGGG-3′ and 5′-ctatGGATCCGAAGCTGTAAGGTGACCCAGACTGG-3′ where the GAL4 site is underlined, the BamHI sites are in italics, and a small piece of extra DNA is in lowercase (to facilitate restriction enzyme digestion). Nanog −812/+171(HP mut) was then subjected to HindIII digestion (releasing −821 to −221 fragment) and ligation to create Nanog −221/+171(HP mut).
The construct Nanog −812/+171(PRE-1 mut) was created by site-directed mutagenesis of Nanog −812/+171 with the primer 5′-GTCTTCCCTCCCTCCCAGgtcGacTCACCTTACAGCTTCTTTTGC-3′ and its complement, where the PRE-1 site is underlined, a new SalI site is in italics, and the mutated sequence is lowercase. The construct Nanog −812/+171(PRE-2 mut) was created by site-directed mutagenesis with the primer 5′-GGTGGACCCTGCAGGTGGGtaccACTGTGAATTCACAGGG-3′ and its complement, where the PRE-2 site is underlined, a new KpnI site is in italics, and the mutated PRE-2 core is in lowercase. The construct Nanog −221/+171(PRE-2 mut) was created by HindIII digestion and ligation of Nanog −812/+171(PRE-2 mut), releasing the −812 to −221 fragment. The Nanog promoter/reporter constructs containing mutations in or adjacent to the NRE-1 site were created by site-directed mutagenesis. The construct Nanog −812/+171 (−241/−237 mut) was created with the primer 5′-GGGGGGGGGGGATGTCTTgtcgaCAGAGGATGCCCCCTAAGCTTTCC-3′ and its complement; Nanog −812/+171 (−235/−230 mut) (also known as the NRE-1 mut) used the primer 5′-GGGGATGTCTTTAGATCgtcGacTGCCCCCTAAGCTTTCCCTCC-3′ and its complement; Nanog –812/+171 (−227/−222 mut) used the primers 5′-GATGTCTTTAGATCAGAGGATGgtCgacAAGCTTTCCCTCCCTCCCAGTC-3′ and its complement. In each primer, the −241 to −222 region is underlined, a new SalI site is shown in italics, and mutations are in lowercase. The Nanog −236/+171 promoter/reporter construct was created from Nanog −812/+171(−241/−237 mut) by SalI digestion and ligation, which removes the −812 to −236 fragment. The Nanog −229/+171 promoter/reporter construct was created by SalI digestion and ligation of Nanog −812/+171(−235/−230 mut), which releases the −812 to −229 fragment.
RNA Isolation and Northern Blot Analysis
Poly(A)+RNA was isolated from nearly confluent cultures of D3 ES cells, P19 EC cells, F9 EC cells, and F9 differentiated cells using the FastTrack 2.0 Kit (Invitrogen). Preparation of northern blots was performed as described previously, using 2.5 μg of RNA per lane (Kelly et al., 1998). RNA was fixed to the nylon membrane by UV crosslinkage. cDNA probes were obtained as follows: The ∼800 bp FGF-4 cDNA fragment was derived by SalI restriction digestion of plasmid pk-FGF-SalI-ins (Miller and Rizzino, 1996). The ∼2 kb fragment containing Sox2 cDNA was derived by NotI and XhoI restriction digestion of plasmid pCMV-Sox2 (Nowling et al., 2000). The ∼1 kb Nanog cDNA fragment was derived by HindIII and XbaI restriction digestion of plasmid pCMV-Nanog (Boer et al., 2007). The ∼1.1 kb Oct-3/4 cDNA fragment was derived by EcoRI restriction digestion of plasmid pCMV-Oct-3/4 (Nowling et al., 2000). The ∼1 kb UTF1 cDNA fragment was derived by EcoR1 and BamHI restriction digestion of plasmid pCMV-UTF1 (Boer et al., 2006). The 780 bp hGAPDH fragment was obtained by PstI and XbaI digestion of the plasmid, HcGAP (ATCC, Rockville, MD). cDNA probes were radioactively labeled with [α-32P]dCTP using the Rediprime II Random Prime Labeling System (GE Healthcare, UK). The blots were hybridized with labeled cDNA probes and washed according to the ExpressHyb™ Hybridization Solution protocol (Clontech). Following hybridization, the Northern blots were placed in a phosphorimager cassette overnight. Bands were visualized by a STORM phosphorimager (Molecular Dynamics, Sunnyvale, CA). The blots were stripped with 0.5% SDS (in DEPC H2O) and rehybridized with subsequent probes, and finally the GAPDH cDNA probe for normalization using ImageQuant software (Molecular Dynamics).
RESULTS
Nanog and other Sox2:Oct-3/4 target genes turn off with different kinetics during differentiation of EC cells
As in the case of other Sox2:Oct-3/4 target genes, Nanog is expressed in EC and ES cells, but is barely detectable after these cells differentiate (Mitsui et al., 2003; Chambers et al., 2003). Although it is widely assumed that the downregulation of these genes is linked directly to the downregulation of Sox2 and Oct-3/4, it has not been determined whether the Nanog, Sox2 and Oct-3/4 genes turn off with similar kinetics. Thus, we examined this issue by performing northern blot analysis using RNA isolated from F9 EC cells and F9 EC cells undergoing differentiation over a five day period in the presence of 5 μM retinoic acid. Retinoic acid has been used extensively to induce the differentiation of F9 EC cells into cells that exhibit the properties of extraembryonic endoderm (Strickland and Mahdavi, 1978; Rizzino, 2002). FGF-4 and UTF1 were included in this analysis, because they are required for embryogenesis and the differentiation of ES cells, respectively (Feldman et al, 1995; van den Boom et al., 2007). It should be noted that for this study we tested mRNA samples previously used to demonstrate that mRNA for two markers of differentiation, the ETS protein Elf3 and the type II TGF-beta-receptor, turn-on when F9 EC cells are induced to differentiate over a 5 day period (Kim et al, 2002). As expected, there was a progressive decrease in Nanog mRNA levels during differentiation of F9 EC cells (Figure 1A). Remarkably, sequential analysis of mRNA for Nanog and four other Sox2:Oct-3/4 target genes, Sox2, Oct-3/4, FGF-4 and UTF1, indicated that these genes do not turn off with the same kinetics (Figure 1B). Sox2, FGF-4 and UTF1 mRNA decreased with similar kinetics, especially during the initial 24 hr of differentiation. For these three genes, mRNA levels decreased to approximately 50% one day after the induction of differentiation. In contrast, Nanog and Oct-3/4 mRNA decreased more slowly (Figure 1B). A 50% reduction in Nanog and Oct-3/4 mRNA did not occur until the third and fourth day, respectively, after the induction of differentiation. Currently, the mechanisms responsible for the differences in the downregulation of these five Sox2:Oct-3/4 target genes are not understood. This may reflect differences in the transcription of these genes or the stability of their mRNA during the differentiation of F9 EC cells. As discussed earlier, the expression of these genes, including the Sox2 and Oct-3/4 genes themselves, is believed to be heavily dependent on the cooperative action of the transcription factors Sox2 and Oct-3/4 (Dailey et al., 1994; Yuan et al., 1995; Nishimoto et al., 1999; Nowling et al., 2003; Tokuzawa et al., 2003; Tomioka et al., 2002; Okumura-Nakanishi et al., 2005; Kuroda et al., 2005; Rodda et al., 2005; Nakatake et al., 2006). However, the findings described here suggest that the effects of differentiation on the function of other transcription factors, which bind to cis-regulatory elements that are unique to each of these genes, account for differences in the downregulation of Sox2:Oct-3/4 target genes when F9 EC cells differentiate. To better understand the transcriptional regulation of the Nanog gene, the remainder of this study focused on the identification of additional cis-regulatory elements that control the activity of the Nanog promoter.
Figure 1. Expression of Nanog mRNA in mouse EC cells.

(A) Poly(A)+ RNA was isolated from F9 EC and F9 differentiated cells (days 1-5) and northern blot analyses of Nanog and GAPDH mRNA was performed as described in Materials and Methods. Relative Nanog expression values were normalized to GAPDH expression. Nanog and GAPDH transcripts were approximately 2.2 kb and 1.4 kb in size, respectively. The expression of Nanog mRNA in F9 EC cells was set to one. (B) Time course of FGF-4, Sox2, Nanog, Oct-3/4, and UTF1 expression in F9 EC and F9 differentiated cells based on northern blot analyses. The relative expression of each transcript was normalized to GAPDH expression. The expression of each mRNA in F9 EC cells was set to one.
The proximal region of the Nanog promoter contains multiple closely-spaced cis-regulatory elements
Previous studies identified several cis-regulatory elements in the proximal Nanog promoter (Kuroda et al., 2005; Rodda et al., 2005; Wu and Yao, 2006; Pan et al., 2006). Importantly, we and others have shown that the Nanog gene contains an HMG/POU cassette located between −180 to −166 upstream of the Nanog transcription start site. Moreover, approximately 40 bp upstream and 40 bp downstream of the HMG/POU cassette there is strong conservation between human and mouse Nanog genes (Figure 2A). Within this 100 bp region, two other putative cis-elements in a Nanog promoter/reporter gene construct have been reported to be active in F9 EC cells (Rodda et al., 2005). One is located approximately 20 bp upstream of the HMG/POU cassette (referred to in this study as positive regulatory element 1, PRE-1) and a second is located approximately 20 bp downstream of the HMG/POU cassette (referred to in this study as positive regulatory element 2, PRE-2) (Figure 2A). To better understand the roles of PRE-1 and PRE-2, we initially tested the effects of individually disrupting these two cis-regulatory elements on the activity of Nanog promoter/reporter gene constructs in ES cells. For this purpose, we used a promoter/reporter gene construct that contained the region −812 to +171, relative to the Nanog transcription start site. As shown previously in F9 EC cells (Rodda et al., 2005), disruption of either PRE-1 or PRE-2 caused a significant reduction in the activity of the Nanog promoter in ES cells (Figure 2B). However, the reduction of PRE-2 observed here in ES cells (∼90%) is far greater than the reduction (∼35%) reported previously in F9 EC cells (Rodda et al., 2005). This is unlikely to be due to differences in the sizes of promoter/reporter gene constructs used in the two studies. Although our promoter/reporter construct contains a larger 5′ flanking region, which extends to −812 rather than to −289, we show below that similar reductions are observed in F9 EC cells using our −812 to +171 Nanog promoter reporter gene construct when PRE-2 is disrupted. In contrast, the differences observed are likely to be due to the number of base pairs disrupted. In our study, 5 base pairs were altered; whereas in the earlier study only 3 base pairs were altered. Thus, disrupting only 3 base pairs may have only partially disrupted PRE-2. As expected, disruption of the HMG/POU cassette and PRE-2 in the −221 to +171 Nanog promoter/reporter gene construct drastically reduced expression of the reporter gene (Figure 2B). More importantly, when we tested the activity of a Nanog promoter/reporter gene construct that contained the region that extended from only −221 to +171, a large increase in promoter activity was observed. Each of these findings, including elevated reporter activity of the shorter Nanog promoter/reporter gene construct, was confirmed in an unrelated ES cell line, D3 (data not shown). Thus, in addition to determining that PRE-1 and PRE-2 function as positive cis-regulatory elements in ES cells, we have now identified a region between −812 and −221 that negatively regulates the activity of the Nanog promoter in ES cells. Below, we examine the function of this negative regulatory region and map a new negative cis-regulatory element.
Figure 2. Regulation of the Nanog promoter by multiple cis-regulatory elements in ES cells.

(A) Schematic diagram of the Nanog promoter indicating relative position of known (HMG/POU cassette) and putative cis-regulatory elements (PRE-1 and PRE-2) within the region −241 to −121 relative to the Nanog transcription start site. The human and mouse Nanog promoter sequence from −241 through −121 is shown in an alignment, where the shaded regions are conserved and the regulatory elements are underlined. Changes to the regulatory sites in our mutant promoter/reporter constructs are indicated by lowercase letters. (B) Nanog promoter cis-element function in KH2 ES cells. KH2 ES cells were transiently transfected and assayed as described in Materials and Methods. Reporter activity was normalized to that of ß-galactosidase and the activity of Nanog −812/+171 was set to 1. Mutant promoter/reporter construct activity is shown relative to Nanog −812/+171. The data shown represents the mean and standard deviation of duplicate samples from a representative experiment. Each experiment was repeated twice and similar results were obtained.
The Nanog gene is regulated differently in F9 and P19 EC cells
Previous studies have shown that the Sox2:Oct-3/4 target genes, FGF-4 and Oct-3/4, are regulated differently in F9 and P19 EC cells (Boer et al., 2006; Mallanna et al., 2007). To determine whether this is true for other Sox2:Oct-3/4 target genes, we compared mRNA expression of five different Sox2:Oct-3/4 genes in P19 EC cells to that in F9 EC cells and D3 ES cells. As reported previously, the expression of Sox2 and Oct-3/4 mRNA are similar in F9 and P19 EC cells (Figure 3), and this has been confirmed at the protein levels for Sox2 and Oct-3/4 in these two EC cell lines (Boer et al., 2006). However, mRNA expression for Nanog and two other Sox2:Oct-3/4 target genes, FGF-4 and UTF1, is lower in P19 EC cells than in F9 EC cells and D3 ES cells. This suggested that the Nanog promoter may be regulated differently in P19 EC cells than in F9 EC cells and D3 ES cells. In this regard, although disruption of the HMG/POU cassette and PRE-2 reduced the activity of the Nanog promoter in both F9 and P19 EC cells (Figure 4A) as they do in ES cells (Figure 2), disruption of PRE-1 had no effect on the activity of Nanog promoter activity in P19 EC cells (Figure 4B). In addition, we did not observe a difference in the activity between the longer (−812 to +171) and shorter (−221 to +171) promoter/reporter gene constructs in P19 cells. To examine the function of this negative regulatory region, we also examined whether this region influences the residual activity of the Nanog promoter after EC cells undergo differentiation. As in the case of their parental cells, the negative regulatory region is inactive in P19-differentiated cells, but remains active in F9-differentiated cells (Figure 4C).
Figure 3. Relative expression of Nanog and other Sox2:Oct-3/4 target genes in D3 ES cells, F9 EC cells and P19 EC cells.
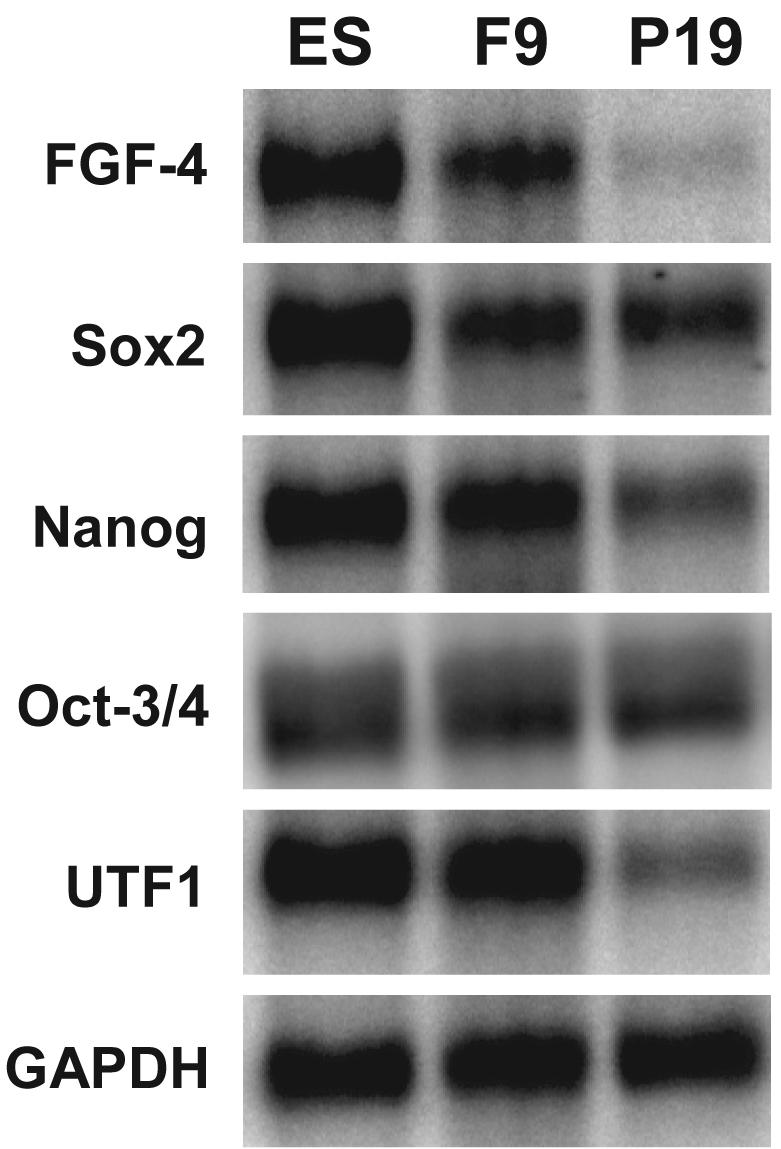
Poly(A)+ RNA was isolated from D3 ES, F9 EC, and P19 EC cells and northern blot analyses were performed as described in Materials and Methods. Relative transcript sizes: FGF-4 ∼3.2 kb, Sox2 ∼2.3 kb, Nanog ∼2.2 kb, Oct-3/4 ∼1.5 kb, UTF1 ∼1.2 kb, GAPDH ∼1.4 kb.
Figure 4. Differential utilization of Nanog cis-regulatory elements in F9 and P19 EC cells.

(A) Effect of mutation of the HMG/POU (HP) cassette and PRE-2 on Nanog promoter activity in both F9 and P19 EC cells. (B) Effect of PRE-1 mutation or −812 to −221 truncation of the 5′ flanking region of the Nanog on Nanog promoter in both F9 and P19 EC cells. (C) Effect of − 812 to −221 truncation on Nanog promoter activity in differentiated F9 and P19 cells. In (A), (B), and (C) the cells were transiently transfected and assayed as described in Materials and Methods. Reporter activity was normalized to that of ß-galactosidase and the activity of Nanog −812/+171 was set to 1. Mutant or truncated promoter/reporter construct activity is shown relative to Nanog −812/+171. The data shown represents the mean and standard deviation of duplicate samples from a representative experiment. Each experiment was repeated twice and similar results were obtained.
The proximal region of the Nanog promoter contains a negative cis-regulatory element, NRE-1, immediately upstream of other cis-regulatory elements
Given that F9 EC cells and two different ES cells respond to a negative regulatory element(s) located within the region between −812 and −221, we decided to map the location of this negative cis-regulatory element, NRE-1. We amplified progressively shorter Nanog promoter fragments and cloned them into our CAT promoter/report construct, pBLCAT7, and tested their activities in F9 EC cells (Figure 5A). There was no difference in activities of constructs ranging from −812 to −340, suggesting that the NRE-1 resides within the −340 to −221 region. Additional promoter/reporter constructs mapped the NRE-1 to the −241 to −221 region. Again, progressively shorter Nanog promoter fragments were cloned into pBLCAT7 and tested in F9 EC cells to help define the precise location of NRE-1 (Figure 5B). There was a 2-fold increase in activity when we compared the −236/+171 construct to the −812/+171 construct, suggesting that some repressor function exists within the region −340 to −236. However, truncation to −229 had the most pronounced increase in reporter gene expression, similar to levels exhibited by the −221 construct, suggesting that the region −235 to −230 comprises NRE-1. To verify its location, we used site-directed mutagenesis to sequentially alter 5-6 bp within the −241 to −221 region in the context of the full-length Nanog promoter/reporter construct (−812/+171) and tested these constructs in F9 EC cells (Figure 5C). Mutation of the region −241 to−236 had no discernable effect on Nanog promoter activity, and the −227 to −222 mutant caused only a modest increase in reporter gene expression. As predicted, altering the −235 to −230 DNA sequence caused a significant increase in activity (∼3-fold). Moreover, we determined that this mutation had no effect on the activity of the Nanog promoter/reporter gene construct in P19 EC cells (Figure 5D). Taken together, these results argue that the cis-regulatory element, NRE-1, located in the region −235 to −230 is a significant component of the negative regulatory activity located between −340 and −221.
Figure 5. Mapping the Nanog negative regulatory element, NRE-1.

(A) Effect of progressive shortening of the 5′ flanking region of the Nanog gene in F9 EC cells. Promoter schematics indicating coordinates are shown. (B) Effect of additional promoter deletions in F9 EC cells. (C) Effect of site-directed mutagenesis of NRE-1 (−235 to −230) and adjacent regions in F9 EC cells. (D) Effect of site-directed mutagenesis of NRE-1 (−235 to −230) in P19 EC cells. In (A), (B), (C), and (D) the cells were transiently transfected and assayed as described in Materials and Methods. Reporter activity was normalized to that of ß-galactosidase and the activity of Nanog −812/+171 was set to 1. Truncated and mutant promoter/reporter construct activity is shown relative to Nanog −812/+171. The data shown represents the mean and standard deviation of duplicate samples from a representative experiment. Each experiment was repeated twice and similar results were obtained.
Currently, it is unclear which transcription factor is responsible for the activity of the NRE-1. Initially, we considered the possibility that Nanog may be the factor that mediates the effect of NRE-1, because Nanog has been shown to inhibit its own promoter (Boer et al., 2007). However, this is unlikely to be the case. We determined that Nanog inhibits both the −812/+171 Nanog promoter/reporter gene construct and the shorter −221/+171 Nanog promoter/reporter gene construct equally well (data not shown). Interestingly, the effect of Nanog on the −221/+171 construct is lost when either the HMG/POU cassette or PRE-2 is disrupted. Although these cis-regulatory elements may mediate the inhibitory effect of Nanog, the inhibitory effect of Nanog could be masked by its inability to reduce the residual activity of the construct any further. In light of these results, we used TFSEARCH (cbrc.jp/research/db/TFSEARCH) in an effort to identify factors that may be able to bind to NRE-1. Since the sequence located between −235 and −230 does not appear to be conserved between mouse and human (Figure 2A), we probed the sequence between −241 and −205 of the mouse gene. This search identified a possible binding site for GATA transcription factors located between −234 and −226, with a moderate TFSEARCH score of 87.4 out of 100. To test the possible role of GATA factors in the activity of the NRE-1, two studies were conducted. First, we tested the ability of GATA-6 to bind in an EMSA to DNA probe that contained the region of NRE-1. However, GATA-6 does not appear to bind to this DNA probe (data not shown). Second, we individually overexpressed GATA-6 and GATA-4 in F9 EC cells along with either the wild-type −821/+171 Nanog promoter/reporter gene construct or the NRE-1 mutant −821/+171(−235/−230 mut) Nanog promoter/reporter gene construct. GATA-6 and GATA-4 each acted similarly on these two promoter/reporter constructs regardless of whether NRE-1 was intact or mutated. Thus, GATA transcription factors do not appear to be responsible for the activity of NRE-1 in F9 EC cells. Clearly additional studies will be needed to identify the factor responsible for the inhibitory effect of NRE-1.
DISCUSSION
This study demonstrates that the downregulation of mRNA for Nanog and Oct-3/4 occurs more slowly when F9 EC cells undergo differentiation than the downregulation of mRNA for Sox2 and two other Sox2:Oct-3/4 target genes, FGF-4 and UTF1. Although the downregulation of each of the Sox2:Oct-3/4 target genes examined here has been linked to the downregulation of Sox2 and Oct-3/4 themselves, other cis-regulatory elements and transcription factors involved in the control of these genes are likely to account for the differences in the downregulation of this set of Sox2:Oct-3/4 target genes. However, because Sox2 is downregulated more rapidly than Oct-3/4, at least at the mRNA level, it is also possible that the continued expression of the five Sox2:Oct-3/4 target genes during differentiation may reflect different levels of Sox2 protein required for the expression of these genes. Indeed, previous studies have noted subtle differences in the dependence of the HMG/POU cassettes of the FGF-4 and UTF1 genes, which bind Sox2 and Oct-3/4, when F9 EC cells begin to differentiate (Boer et al., 2006).
Our work also demonstrates that several cis-regulatory elements in the 5′ flanking region of the Nanog gene are utilized differentially in P19 EC cells when compared with their activity in F9 EC cells and ES cells. Although the HMG/POU cassette and PRE-1 are both functional when tested in two different ES cells, as well as both EC cell lines, PRE-1 is active in F9 EC cells and ES cells, but not in P19 EC cells. Furthermore, the negative regulatory region, which is active in F9 EC cells and ES cells, is not functional in P19 EC cells. Currently, it is unclear why P19 EC cells behave differently. P19 EC cells differ from F9 EC cells and ES cells in several respects. In the case of their tumorigenicity, P19 EC cells, like ES cells, can form tumors containing multiple cell types typically derived from each of the three embryonic germ layers, whereas F9 EC cells form undifferentiated embryonal carcinomas (Rossant and McBurney, 1982; Artzt et al., 1973). Moreover, several lines of evidence suggest that P19 EC cells may more closely represent a later stage of mammalian development than ES cells and F9 EC cells. Based on utilization of two enhancers of the Oct-3/4 gene, P19 EC cells appear to be more closely related to the epiblast stage; whereas F9 and ES cells appear to be more closely related to an earlier stage of development (Boer et al., 2006; Mallanna et al., 2007; Yeom et al., 1996; Tesar et al., 2007). Furthermore, previous studies have identified differences in the function of the HMG/POU cassette of the FGF-4 gene when tested in F9 EC cells and P19 EC cells (Boer et al., 2006). In the case of F9 EC cells, as well as ES cells, the FGF-4 promoter is strongly activated by an enhancer that contains an essential HMG/POU (Dailey et al., 1994; Ma et al., 1992). In contrast, this FGF-4 enhancer is far less active in P19 EC cells (Boer et al., 2006), which appears to account for the lower level of FGF-4 mRNA expressed in P19 EC cells than in F9 EC cells and ES cells (Figure 3).
Our studies clearly show that in P19 EC cells Nanog mRNA is expressed at levels lower than that observed in F9 EC cells and D3 ES cells. However, in view of the fact that the negative regulatory region is active in F9 EC cells and ES cells, but not active in P19 EC cells, one might have anticipated that Nanog mRNA would be expressed at a level significantly higher in P19 EC cells than that observed in F9 EC cells and D3 ES cells. We suspect that this is due, at least in part, to lack of activity of PRE-1 in P19 cells, which contributes significantly to Nanog promoter activity in F9 EC cells and ES cells. Currently, the factor(s) responsible for the inhibitory activity of the Nanog promoter remains unknown, but this factor(s) appears to continue to function after F9 EC cells are induced to differentiate. Similarly, the factors responsible for the action of PRE-1 and PRE-2 are unknown. Interestingly, we noted that the PRE-2 sequence comprised a possible Nanog-binding element, based on the previously published Nanog DNA recognition motif determined by SELEX (Mitsui et al., 2003). Despite its similarity to a Nanog-binding element, our EMSA analyses suggest Nanog does not bind a PRE-2 probe in vitro, although it does bind a probe containing the SELEX sequence (data not shown). Furthermore, we observed that removal of the Nanog C-terminal domains, WR and CD2, which function as transactivation domains (Pan and Pei, 2005), greatly enhances its binding to the SELEX probe in vitro, suggesting Nanog contains an autoinhibitory domain (data not shown). In view of the finding that Nanog appears to contain an autoinhibitory domain, we used chromatin immunoprecipitation to probe for the binding of Nanog to the region that comprises PRE-2. Although we were unable to detect Nanog association with the PRE-2 containing region in the endogenous Nanog gene in F9 EC cells, we noted that mutation of PRE-2 in a promoter/reporter construct caused a decrease in the binding of Sox2 to this construct, suggesting that PRE-2 influences the binding of Sox2 to the nearby HMG/POU cassette (data not shown). Given their close proximity (Figure 2A), it is likely that Sox2 and Oct-3/4, which bind to the HMG/POU cassette, interact with the factor that binds to PRE-2.
In summary, the work described in this study indicates that several Nanog cis-regulatory elements, including PRE-1 and NRE-1, function differently in P19 EC cells than in F9 EC cells and ES cells. Importantly, our studies, in conjunction with earlier reports, argue that the Nanog gene is regulated by a complex interplay of both positive and negative cis-regulatory elements that are distributed over a large region of the 5′ flanking region of the Nanog gene (Figure 6). Given that P19 appears to represent a different stage of mammalian development than F9 EC cells and ES cells, the differential utilization of cis-regulatory elements may reflect mechanisms used during development to achieve the correct level of Nanog expression as mammalian embryogenesis unfolds. Furthermore, we predict that activation of the correct set of Nanog cis-regulatory elements plays an important role during the reprogramming of somatic cells to a pluripotent stem cell state where improper regulation of the endogenous Nanog gene has been linked to incomplete reprogramming (Takahashi et al., 2007).
Figure 6. Schematic diagram of identified Nanog cis-regulatory elements.

The Nanog gene has been shown, in this and other studies, to be regulated by a complex array of positive and negative cis-regulatory element located over 5 kb in the 5′ flanking region of the Nanog gene. These cis-regulatory elements and their relative locations include: STAT, SALL4, Tcf, p53, FoxD3, NRE-1, PRE-1, HMG/POU cassette (H/P) and PRE-2, Sp1/Sp3 cis-regulatory elements.
Acknowledgments
This work was funded by a grant from the National Institutes of General Medical Sciences (GM 080751). BB and DC were supported in part by a training grant from the National Cancer Institute (CA 009476). Core facilities were supported in part by a Cancer Center Support Grant from the National Cancer Institute (CA 36727).
Abbreviations
- CAT
chloramphenicol acetyl transferase
- EC
embryonal carcinoma
- ES
embryonic stem
- FBS
fetal bovine serum
- LIF
leukemia inhibitory factor
- TSS
transcription start site
REFERENCES
- Avilion AA, Nicolis SK, Pevny LH, Perez L, Vivian N, Lovell-Badge R. Multipotent cell lineages in early mouse development depend on SOX2 function. Genes Dev. 2003;17:126–140. doi: 10.1101/gad.224503. [DOI] [PMC free article] [PubMed] [Google Scholar]
- Artzt K, Dubois P, Bennett D, Condamine H, Babinet C, Jacob F. Surface antigens common to mouse cleavage embryos and primitive teratocarcinoma cells in culture. Proc Nat Acad Sci USA. 1973;70:2988–2992. doi: 10.1073/pnas.70.10.2988. [DOI] [PMC free article] [PubMed] [Google Scholar]
- Boer B, Bernadt CT, Desler M, Wilder PJ, Kopp JL, Rizzino A. Differential activity of the FGF-4 enhancer in F9 and P19 embryonal carcinoma cells. J Cell Physiol. 2006;208:97–108. doi: 10.1002/jcp.20635. [DOI] [PubMed] [Google Scholar]
- Boer B, Kopp J, Mallanna S, Desler M, Chakravarthy H, Wilder PJ, Bernadt C, Rizzino A. Elevating the levels of Sox2 in embryonal carcinoma cells and embryonic stem cells inhibits the expression of Sox2 : Oct-3/4 target genes. Nucleic Acids Research. 2007;35:1773–1786. doi: 10.1093/nar/gkm059. [DOI] [PMC free article] [PubMed] [Google Scholar]
- Boyer LA, Lee TI, Cole MF, Johnstone SE, Levine SS, Zucker JP, Guenther MG, Kumar RM, Murray HL, Jenner RG, Gifford DK, Melton DA, Jaenisch R, Young RA. Core Transcriptional Regulatory Circuitry in Human Embryonic Stem Cells. Cell. 2005;122:947–956. doi: 10.1016/j.cell.2005.08.020. [DOI] [PMC free article] [PubMed] [Google Scholar]
- Chambers I, Colby D, Robertson M, Nichols J, Lee S, Tweedie S, Smith A. Functional expression cloning of Nanog, a pluripotency sustaining factor in embryonic stem cells. Cell. 2003;113:643–655. doi: 10.1016/s0092-8674(03)00392-1. [DOI] [PubMed] [Google Scholar]
- Chambers I, Silva J, Colby D, Nichols J, Nijmeijer B, Robertson M, Vrana J, Jones K, Grotewold L, Smith A. Nanog safeguards pluripotency and mediates germline development. Nature. 2007;450:1230–1234. doi: 10.1038/nature06403. [DOI] [PubMed] [Google Scholar]
- Chen Y, Du Z, Yao Z. Roles of the Nanog protein in murine F9 embryonal carcinoma cells and their endoderm-differentiated counterparts. Cell Res. 2006;16:641–650. doi: 10.1038/sj.cr.7310067. [DOI] [PubMed] [Google Scholar]
- Dailey L, Yuan HB, Basilico C. Interaction Between A Novel F9-Specific Factor and Octamer-Binding Proteins Is Required for Cell-Type-Restricted Activity of the Fibroblast Growth-Factor-4 Enhancer 1. Molecular and Cellular Biology. 1994;14:7758–7769. doi: 10.1128/mcb.14.12.7758. [DOI] [PMC free article] [PubMed] [Google Scholar]
- Darr H, Mayshar Y, Benvenisty N. Overexpression of NANOG in human ES cells enables feeder-free growth while inducing primitive ectoderm features. Development. 2006;133:1193–1201. doi: 10.1242/dev.02286. [DOI] [PubMed] [Google Scholar]
- Feldman B, Poueymirou W, Papaioannou VE, DeChiara TM, Goldfarb M. Requirement of FGF-4 for postimplanation mouse development. Science. 1995;267:246–249. doi: 10.1126/science.7809630. [DOI] [PubMed] [Google Scholar]
- Hatano SY, Tada M, Kimura H, Yamaguchi S, Kono T, Nakano T, Suemori H, Nakatsuji N, Tada T. Pluripotential competence of cells associated with Nanog activity. Mech Dev. 2005;122:67–79. doi: 10.1016/j.mod.2004.08.008. [DOI] [PubMed] [Google Scholar]
- Kelly D, Kim SJ, Rizzino A. Transcriptional activation of the type II transforming growth factor-beta receptor gene upon differentiation of embryonal carcinoma cells. J Biol Chem. 1998;273:21115–21124. doi: 10.1074/jbc.273.33.21115. [DOI] [PubMed] [Google Scholar]
- Kim JH, Wilder PJ, Hou J, Nowling T, Rizzino A. Activation of the murine type II transforming growth factor receptor gene: up regulation and function of the transcription factor Elf-3/Ert/Esx/Ese-1. J Biol Chem. 2002;277:17520–17530. doi: 10.1074/jbc.M110434200. [DOI] [PubMed] [Google Scholar]
- Kuroda T, Tada M, Kubota H, Kimura H, Hatano SY, Suemori H, Nakatsuji N, Tada T. Octamer and Sox elements are required for transcriptional cis regulation of Nanog gene expression. Mol Cell Biol. 2005;25:2475–2485. doi: 10.1128/MCB.25.6.2475-2485.2005. [DOI] [PMC free article] [PubMed] [Google Scholar]
- Lin T, Chao C, Saito S, Mazur SJ, Murphy ME, Appella E, Xu Y. p53 induces differentiation of mouse embryonic stem cells by suppressing Nanog expression. Nat Cell Biol. 2005;7:165–171. doi: 10.1038/ncb1211. [DOI] [PubMed] [Google Scholar]
- Loh YH, Wu Q, Chew JL, Vega VB, Zhang W, Chen X, Bourque G, George J, Leong B, Liu J, Wong KY, Sung KW, Lee CW, Zhao XD, Chiu KP, Lipovich L, Kuznetsov VA, Robson P, Stanton LW, Wei CL, Ruan Y, Lim B, Ng HH. The Oct4 and Nanog transcription network regulates pluripotency in mouse embryonic stem cells. Nat Genet. 2006;38:431–440. doi: 10.1038/ng1760. [DOI] [PubMed] [Google Scholar]
- Ma YG, Rosfjord E, Huebert C, Wilder P, Tiesman J, Kelly D, Rizzino A. Transcriptional regulation of the murine k-FGF gene in embryonic cell lines. Dev Biol. 1992;154:45–54. doi: 10.1016/0012-1606(92)90046-j. [DOI] [PubMed] [Google Scholar]
- Mallanna S, Boer B, Desler M, Rizzino A. Differential regulation of the Oct-3/4 gene in cell culture model systems that parallel different stages of mammalian development. Mol Reprod Dev. 2007 doi: 10.1002/mrd.20871. in press. [DOI] [PubMed] [Google Scholar]
- Miller K, Rizzino A. Constitutive expression of fibroblast growth factor-4 does not alter the growth or the differentiation of embryonal carcinoma cells. Cell Growth Differ. 1996;7:203–211. [PubMed] [Google Scholar]
- Mitsui K, Tokuzawa Y, Itoh H, Segawa K, Murakami M, Takahashi K, Maruyama M, Maeda M, Yamanaka S. The homeoprotein Nanog is required for maintenance of pluripotency in mouse epiblast and ES cells. Cell. 2003;113:631–642. doi: 10.1016/s0092-8674(03)00393-3. [DOI] [PubMed] [Google Scholar]
- Mullin NP, Yates A, Rowe AJ, Nijmeijer B, Colby D, Barlow PN, Walkinshaw MD, Chambers I. The pluripotency rheostat Nanog functions as a dimer. Biochem J. 2008;411:227–231. doi: 10.1042/BJ20080134. [DOI] [PubMed] [Google Scholar]
- Nakatake Y, Fukui N, Iwamatsu Y, Masui S, Takahashi K, Yagi R, Yagi K, Miyazaki J, Matoba R, Ko MS, Niwa H. Klf4 cooperates with Oct3/4 and Sox2 to activate the Lefty1 core promoter in embryonic stem cells. Mol Cell Biol. 2006;26:7772–7782. doi: 10.1128/MCB.00468-06. [DOI] [PMC free article] [PubMed] [Google Scholar]
- Nichols J, Zevnik B, Anastassiadis K, Niwa H, Klewe-Nebenius D, Chambers I, Scholer H, Smith A. Formation of pluripotent stem cells in the mammalian embryo depends on the POU transcription factor Oct4. Cell. 1998;95:379–391. doi: 10.1016/s0092-8674(00)81769-9. [DOI] [PubMed] [Google Scholar]
- Nishimoto M, Fukushima A, Okuda A, Muramatsu M. The gene for the embryonic stem cell coactivator UTF1 carries a regulatory element which selectively interacts with a complex composed of Oct-3/4 and Sox-2. Mol Cell Biol. 1999;19:5453–5465. doi: 10.1128/mcb.19.8.5453. [DOI] [PMC free article] [PubMed] [Google Scholar]
- Nowling T, Bernadt C, Johnson L, Desler M, Rizzino A. The Co-activator p300 Associates Physically with and Can Mediate the Action of the Distal Enhancer of the FGF-4 Gene. J Biol Chem. 2003;278:13696–13705. doi: 10.1074/jbc.M207567200. [DOI] [PubMed] [Google Scholar]
- Nowling T, Desler M, Kuszynski C, Rizzino A. Transfection of embryonal carcinoma cells at high efficiency using liposome-mediated transfection. Mol Reprod Dev. 2002;63:309–317. doi: 10.1002/mrd.90014. [DOI] [PubMed] [Google Scholar]
- Nowling TK, Johnson LR, Wiebe MS, Rizzino A. Identification of the transactivation domain of the transcription factor Sox-2 and an associated co-activator. J Biol Chem. 2000;275:3810–3818. doi: 10.1074/jbc.275.6.3810. [DOI] [PubMed] [Google Scholar]
- Okumura-Nakanishi S, Saito M, Niwa H, Ishikawa F. Oct-3/4 and Sox2 regulate Oct-3/4 gene in embryonic stem cells. J Biol Chem. 2005;280:5307–5317. doi: 10.1074/jbc.M410015200. [DOI] [PubMed] [Google Scholar]
- Pan G, Li J, Zhou Y, Zheng H, Pei D. A negative feedback loop of transcription factors that controls stem cell pluripotency and self-renewal. FASEB J. 2006;20:1730–1732. doi: 10.1096/fj.05-5543fje. [DOI] [PubMed] [Google Scholar]
- Pan G, Pei D. The stem cell pluripotency factor NANOG activates transcription with two unusually potent subdomains at its C terminus. J Biol Chem. 2005;280:1401–1407. doi: 10.1074/jbc.M407847200. [DOI] [PubMed] [Google Scholar]
- Pan GJ, Pei DQ. Identification of two distinct transactivation domains in the pluripotency sustaining factor nanog. Cell Res. 2003;13:499–502. doi: 10.1038/sj.cr.7290193. [DOI] [PubMed] [Google Scholar]
- Pereira L, Yi F, Merrill BJ. Repression of Nanog gene transcription by Tcf3 limits embryonic stem cell self-renewal. Mol Cell Biol. 2006;26:7479–7491. doi: 10.1128/MCB.00368-06. [DOI] [PMC free article] [PubMed] [Google Scholar]
- Rizzino A, Orme LS, De Larco JE. Embryonal carcinoma cell growth and differentiation. Production of and response to molecules with transforming growth factor activity. Exp Cell Res. 1983;143:143–152. doi: 10.1016/0014-4827(83)90116-7. [DOI] [PubMed] [Google Scholar]
- Rizzino A. Embryonic Stem Cells Provide a Powerful and Versalite Model System. Vitamins and Hormones. 2002;64:1–42. doi: 10.1016/s0083-6729(02)64001-4. [DOI] [PubMed] [Google Scholar]
- Rodda DJ, Chew JL, Lim LH, Loh YH, Wang B, Ng HH, Robson P. Transcriptional regulation of nanog by OCT4 and SOX2. J Biol Chem. 2005;280:24731–24737. doi: 10.1074/jbc.M502573200. [DOI] [PubMed] [Google Scholar]
- Rosfjord E, Lamb K, Rizzino A. Cryptic promoter activity within the backbone of a plasmid commonly used to prepare promoter/reporter gene constructs. In Vitro Cell Dev Biol Anim. 1994;30A:477–481. doi: 10.1007/BF02631317. [DOI] [PubMed] [Google Scholar]
- Rosant J, McBurney MW. The developmental potential of a euploid male teratocarcinoma cell line after blastocyst injection. J Embryol Exp Morphol. 1982;70:99–112. [PubMed] [Google Scholar]
- Strickland S, Mahdavi V. The induction of differentiation in teratocarcinoma stem cells by retinoic acid. Cell. 1978;15:393–403. doi: 10.1016/0092-8674(78)90008-9. [DOI] [PubMed] [Google Scholar]
- Suzuki A, Raya A, Kawakami Y, Morita M, Matsui T, Nakashima K, Gage FH, Rodriguez-Esteban C, Izpisua Belmonte JC. Nanog binds to Smad1 and blocks bone morphogenetic protein-induced differentiation of embryonic stem cells. Proc Natl Acad Sci U S A. 2006;103:10294–10299. doi: 10.1073/pnas.0506945103. [DOI] [PMC free article] [PubMed] [Google Scholar]
- Takahashi K, Tanabe K, Ohnuki M, Narita M, Ichisaka T, Tomoda K, Yamanaka S. Induction of pluripotent stem cells from adult human fibroblasts by defined factors. Cell. 2007;131:861–872. doi: 10.1016/j.cell.2007.11.019. [DOI] [PubMed] [Google Scholar]
- Tesar PJ, Chenoweth JG, Brook FA, Davies TJ, Evans EP, Mack DL, Gardner RL, McKay RD. New cell lines from mouse epiblast share defining features with human embryonic stem cells. Nature. 2007;448:196–199. doi: 10.1038/nature05972. [DOI] [PubMed] [Google Scholar]
- Tokuzawa Y, Kaiho E, Maruyama M, Takahashi K, Mitsui K, Maeda M, Niwa H, Yamanaka S. Fbx15 is a novel target of Oct3/4 but is dispensable for embryonic stem cell self-renewal and mouse development. Mol Cell Biol. 2003;23:2699–2708. doi: 10.1128/MCB.23.8.2699-2708.2003. [DOI] [PMC free article] [PubMed] [Google Scholar]
- Tomioka M, Nishimoto M, Miyagi S, Katayanagi T, Fukui N, Niwa H, Muramatsu M, Okuda A. Identification of Sox-2 regulatory region which is under the control of Oct-3/4-Sox-2 complex. Nucleic Acids Res. 2002;30:3202–3213. doi: 10.1093/nar/gkf435. [DOI] [PMC free article] [PubMed] [Google Scholar]
- Van den Boom V, Kooistra SM, Boesjes M, Geverts B, Houtsmuller AB, Monzen K, Komuro I, Essers J, Drenth-Diephuis LJ, Eggen BJ. UTF-1 is a chromatin-associated protein involved in ES cell differentiation. J Cell Biol. 2007;178:913–924. doi: 10.1083/jcb.200702058. [DOI] [PMC free article] [PubMed] [Google Scholar]
- Wang J, Rao S, Chu J, Shen X, Levasseur DN, Theunissen TW, Orkin SH. A protein interaction network for pluripotency of embryonic stem cells. Nature. 2006;444:364–368. doi: 10.1038/nature05284. [DOI] [PubMed] [Google Scholar]
- Wu DY, Yao Z. Functional analysis of two Sp1/Sp3 binding sites in murine Nanog gene promoter. Cell Res. 2006;16:319–322. doi: 10.1038/sj.cr.7310040. [DOI] [PubMed] [Google Scholar]
- Wu Q, Chen X, Zhang J, Loh YH, Low TY, Zhang W, Zhang W, Sze SK, Lim B, Ng HH. Sall4 interacts with Nanog and co-occupies Nanog genomic sites in embryonic stem cells. J Biol Chem. 2006;281:24090–24094. doi: 10.1074/jbc.C600122200. [DOI] [PubMed] [Google Scholar]
- Yeom YI, Fuhrmann G, Ovitt CE, Brehm A, Ohbo K, Gross M, Hubner K, Scholer HR. Germline regulatory element of Oct-4 specific for the totipotent cycle of embryonal cells. Development. 1996;122:881–894. doi: 10.1242/dev.122.3.881. [DOI] [PubMed] [Google Scholar]
- Yuan H, Corbi N, Basilico C, Dailey L. Developmental-specific activity of the FGF-4 enhancer requires the synergistic action of Sox2 and Oct-3. Genes Dev. 1995;9:2635–2645. doi: 10.1101/gad.9.21.2635. [DOI] [PubMed] [Google Scholar]