

Abstract
Little is known about the impact of the total cavopulmonary connection (TCPC) on resting and exercise hemodynamics in a single ventricle (SV) circulation. The aim of this study was to elucidate this mechanism using a lumped parameter model of the SV circulation. Pulmonary vascular resistance (1.96 ± 0.80 WU) and systemic vascular resistances (18.4 ± 7.2 WU) were obtained from catheterization data on 40 patients with a TCPC. TCPC resistances (0.39 ± 0.26 WU) were established using computational fluid dynamic simulations conducted on anatomically accurate three-dimensional models reconstructed from MRI (n = 16). These parameters were used in a lumped parameter model of the SV circulation to investigate the impact of TCPC resistance on SV hemodynamics under resting and exercise conditions. A biventricular model was used for comparison. For a biventricular circulation, the cardiac output (CO) dependence on TCPC resistance was negligible (sensitivity = −0.064 l·min−1·WU−1) but not for the SV circulation (sensitivity = −0.88 l·min−1·WU−1). The capacity to increase CO with heart rate was also severely reduced for the SV. At a simulated heart rate of 150 beats/min, the SV patient with the highest resistance (1.08 WU) had a significantly lower increase in CO (20.5%) compared with the SV patient with the lowest resistance (50%) and normal circulation (119%). This was due to the increased afterload (+35%) and decreased preload (−12%) associated with the SV circulation. In conclusion, TCPC resistance has a significant impact on resting hemodynamics and the exercise capacity of patients with a SV physiology.
Keywords: mathematical modeling, cardiac function, congenital heart defects, magnetic resonance imaging
the fontan procedure, composing of connecting the systemic and pulmonary circulation in series via the total cavopulmonary connection (TCPC), is the primary palliative option for physiological correction of single ventricle (SV) congenital heart diseases (2, 3). Although postoperative survival is excellent, with some centers having a mortality of <1%, studies have repeatedly demonstrated poor functional outcome in survivors (15–18), including significantly reduced exercise capacity, diminished cardiac output (CO), and risks of heart failure (5, 10–12, 16, 32, 35, 36, 40). Among all the parameters that come into play, decreased cardiac function in these patients seems to be one of the key players responsible for the poor functional outcome (26, 35). However, the impact of the surgically altered TCPC on cardiac function or functional outcome has not been well understood.
Poor cardiac function in SV patients can be associated with many factors. For example, Fogel et al. (8) demonstrated that the presence of the lateral tunnel baffle restricted the motion of the atrioventricular valve plane, consequently resulting in increased afterload (Ea) and decreased cardiac function. Senzaki and colleagues (35) argued that increased Ea, decreased preload (Ees; ventricular filling), and abnormal ventricular-vascular coupling are contributing factors for the decreased cardiac reserve and function in patients with a Fontan circulation. A study by Szabo et al. (40) reported increased Ea and decreased Ees as well using pressure-volume analysis conducted on measurements made in a dog SV model. In addition to experimental studies, theoretical models have also predicted similar changes in Ea, Ees, and cardiac reserve in a Fontan circulation (14, 22, 28).
Most of the studies thus far on the Fontan circulation can be broadly categorized into two types: 1) those that study the Fontan circulation as a whole using in vivo animal and human studies (35, 36, 40); and 2) those that study the fluid mechanics of the surgically created TCPC in isolation from the SV circulation (27, 41, 42). There have not been many studies that have connected the two, i.e., those that relate the hemodynamics of the TCPC to upstream hemodynamics and cardiac function. Furthermore, no study to date has quantified TCPC resistances in actual patient TCPCs, which has proved to be a caveat for understanding the true magnitude of TCPC in the context of pulmonary vascular resistance (PVR) and systemic vascular resistance (SVR).
Therefore, the primary objective of this study was to quantify the impact of the hemodynamic resistance induced by the geometry of the TCPC on two critical aspects of the Fontan circulation: 1) exercise performance and 2) cardiac function. For the first time, TCPC hemodynamics were studied in context of the entire SV circulation using clinically acquired magnetic resonance images and cardiac catheterization data on Fontan patients.
METHODS
Patient Data
A multicenter Fontan patient cardiac MRI database of over 200 patients was established to study anatomic elements of the TCPC. Acquisitions consisted of a stack of axial anatomic images for the reconstruction of geometry, and cine phase contrast (PC) MRI acquisitions for flow quantification at the superior vena cava (SVC), inferior vena cava (IVC), left pulmonary artery (LPA), and right pulmonary artery (RPA). Informed consent was obtained, and all associated experiments were approved by the Internal Review Boards of the Children's Hospital of Philadelphia, the Children's Healthcare of Atlanta, and Georgia Institute of Technology.
Three-dimensional anatomic and flow reconstructions of the TCPC were generated using techniques previously developed and validated (9). From this database, 16 patient-specific geometries (6 intra-atrial, 9 extra-cardiac, and 1 IVC-main pulmonary artery) were selected for computational fluid dynamic (CFD) simulations. The selected geometries are shown in Fig. 1. Table 1 shows the clinical data associated with each model selected in the study as well as the resting COs obtained from PC MRI. In addition, cardiac catheterization data were also available on 40 patients with a SV physiology, which were used for estimating the vascular parameters for the systemic and pulmonary circulations. Specifically, SVR and PVR measurements were used in the mathematical model, whereas pressure and flow measurements were used for validating the model.
Fig. 1.

Three-dimensional anatomic reconstructions of the total cavopulmonary connection (TCPC) models used in this study. In total, there were six intra-atrial models (models M01, M03, M04, M05, M14, and M15), nine extracardiac models (models M02, M06, M07, M08, M09, M10, M12, M13, M16), and one inferior vena cava-main pulmonary artery TCPC model (model M11).
Table 1.
Clinical data of patients used in the study
| Model | Type of Congenital Heart Disease | Fontan Type | Age, yr | Simulation Conditions, l/min |
|---|---|---|---|---|
| M01 | HLHS | IA | 12 | 2,4,and6 |
| M02 | DORV,PA | EC(BL) | 9 | 2.5,5,and7.5 |
| M03 | HLHS | IA | 18 | 2.4,4.8,and7.2 |
| M04 | TA | IA | 10 | 2.9,5.8,and8.7 |
| M05 | PA,HRHS | IA | 15 | 2.75,5.5,and8.25 |
| M06 | Heterotaxy,DC | EC(BL) | 4 | 2.37,4.72,and4.37 |
| M07 | DILV,TGA | EC | 9 | 3.5,7,and10.5 |
| M08 | DC,TA | EC | 3 | 2.7,3.7,and4.7 |
| M09 | TA | EC | 7 | 3.03,6.06,and9.09 |
| M10 | PA,HRHS | EC | 8 | 3,6,and9 |
| M11 | DORV,DC | IVC–MPA | 7 | 3,4,and5 |
| M12 | HLHS | EC | 6 | 2,3,and4 |
| M13 | HRHS | EC | 5 | 3,4,and5 |
| M14 | SV,DIAV | IA | 3 | 2,3,and4 |
| M15 | HLHS | IA | 11 | 4,6,and7 |
| M16 | HLHS | EC | 6 | 2,3,and4 |
Shown are the diagnosis and simulation conditions of the models used in this study. HLHS, hypoplastic left heart syndrome; DORV, double outlet left ventricle; PA, pulmonary atresia; TA, tricuspid atresia; HRHS, hypoplastic right heart syndrom; DC, dextrocadia; DILV, double inlet atriaoventricular connection; TGA, transposition of the great arteries; IA, intra-atrial; EC, extracardiac; BL, bilateral; IVC, inferior vena cava; MPA, main pulmonary artery.
CFD Simulations
Three-dimensional anatomic reconstructions were used for grid generation in which vessel volumes were divided into computational elements (meshes). The number of elements varied depending on geometry size and complexity and ranged from 548,842 to 1,674,440 for the models studied. At each element, the governing Navier-Stokes conservation equations of mass and momentum for laminar fluid flow were solved using FLUENT (Fluent, Lebanon, OH). All solutions were obtained using second-order solvers assuming a Newtonian fluid with a density of 1,060 kg/m3 and viscosity of 3.71 e−3 N·s·m−2. The patient-specific TCPC CFD analysis methodology and in vitro validations of these techniques have been described in previous studies (27, 29, 42). For each patient geometry, blood flow was modeled at baseline steady-state flow conditions by setting SVC and IVC flows to values derived from PC MRI averaged over the cardiac cycle. Outflows were defined by pressure boundary conditions, with values tuned to obtain the desired pulmonary flow splits at the equal vascular lung resistance condition, as previously described (27). To determine the resistance of the TCPC under exercise conditions, simulations were also conducted as 1 l/min increases for younger patients (3–7 yr) and two times and three times the resting flow rates for older patients (>7 yr), with the only exception being model M15.
TCPC Resistance Evaluation
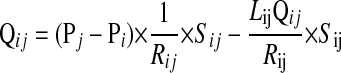
CFD simulations were used to provide pressure and flow measurements throughout the TCPC pathway. Using the measurements at the inlets (SVC and IVC) and outlets (LPA and RPA), the control volume energy loss (ĖLoss) was computed according to the following equation:
 |
(1) |
where P is pressure and Q is flow. An energy loss-based pressure drop term (ΔPTCPC) was then evaluated to estimate the resistance of the TCPC (RTCPC) as follows:
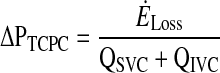 |
(2) |
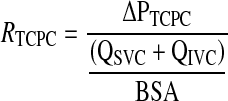 |
(3) |
where BSA is body surface area.
Description of the Lumped Parameter Model
In this analysis, an electric circuit analog of the cardiovascular system similar to the lumped parameter model (closed loop) previously developed by Pekkan et al. (28) was used. This model was based on an earlier scheme proposed by Peskin et al. (31) for the whole cardiovascular system and was adapted here to study Fontan physiology. This is a fairly simple model of the circulatory system [compared with the more complex models proposed by Magosso et al. (14) and Migliavacca et al. (19)] and has been used extensively to study normal and diseased configurations (25, 28, 31, 39). Figure 2 shows the mathematical model for both the normal and SV circulations used in this study. The vascular parameters were the same for both biventricular and univentricular physiologies except for the 1) presence of a TCPC, 2) absence of the right ventricle, and 3) venous compliance.
Fig. 2.

Schematics describing the lumped parameter models used in the study. A: biventricular circulation; B: univentricular circulation. R, resistance; C, compliance; E, load; PVB, pulmonary venous bed; PAB, pulmonary arterial bed; RV, right ventricle; RA, right atrium; LA, left atrium; LV, left ventricle; SAB, systemic arterial bed; SVB, systemic venous bed; MV, mitral valve; AV, aortic valve.
The arteries, veins, and heart chambers were treated as pure time-dependent compliance chambers with lumped capillary and valve resistances. For the normal circulation, there was a chamber for the left heart, systemic arteries, systemic veins, right heart, pulmonary arteries, and pulmonary veins. For the Fontan circulation, the right heart was replaced by a chamber representing the TCPC. Each of these chambers (except for the heart and TCPC) had a resistance and compliance component mimicking the arterial and venous vessels in the cardiovascular system. As explained previously, SVR and PVR values were obtained from clinical cardiac catheterization data. Systemic and pulmonary compliance reflect typical Fontan values and are shown in Table 2 (13, 19, 20, 30). The TCPC was treated as a dynamic resistance that changes with CO and was evaluated using CFD simulations as described above.
Table 2.
Parameters used in modeling the systemic and pulmonary circulations
| Parameter | Normal Ventricle | Single Ventricle |
|---|---|---|
| CSVB, ml/mmHg† | 1517 | 332.5 |
| CSAB, ml/mmHg† | 1.75 | 1.75 |
| RSAB, WU* | 17.2 | 17.2 |
| RSVB, WU* | 1.2 | 1.2 |
| CPAB, ml/mmHg | 4.12 | 4.12 |
| CPVB, ml/mmHg | 80 | 80 |
| RPAB, WU* | 1.7 | 1.7 |
| RPVB, WU* | 0.11 | 0.11 |
Shown are parameters used in the lumped parameter model. C, compliance; R, resistance; SVB, systemic venous bed; SAB, systemic arterial bed; PAB, pulmonary arterial bed; PVB, pulmonary venous bed. WU is equivalent to mmHg·l·min−1.
Parameters extracted from patient data in the present study;
data from Ref. 32.
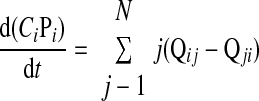
The advantage of such a mathematical model is that additional chambers or shunts can be introduced into the system, which is an option particularly valuable in congenital heart defect research. The instantaneous flow and pressure from compartment i to compartment j were then evaluated by solving the following set of differential equations:
 |
 |
(4) |
Here, the subscript ij depicts the flow from compartment i to compartment j, where compartment j is a compartment after compartment i. Pi, Qi, and Ci are the pressures, flows, and compliances in compartment i; Rij, Lij, and Sij are the resistances, lumped impedances, and switches enforcing the directionality of flows, respectively. N is the number of chambers in the model. Vascular resistance values were obtained from cardiac catheterization data; impedance and compliance values were obtained from the literature. The differential equation was solved iteratively for each chamber until the results converged.
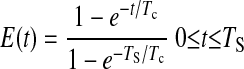
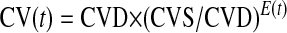
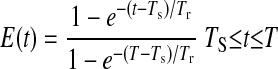
The atria and ventricles themselves were modeled as time-varying compliance chambers generating activation energies similar to those described by Sun et al. (39). Pulsatile pressure was generated in these models via functions that alternate between systolic (stiff) and diastolic (relaxed) ventricular activation functions. These activation functions govern the systolic and diastolic contraction properties of the myocardial muscle. Compliances were then used along with Eq. 4 for generating the pressure waveforms within the four chambers of the heart, respectively. The following equations were used for generating the compliances:
 |
 |
 |
(5) |
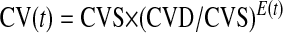 |
E is the load of each chamber. Tc (0.0025 min) and Tr (0.0075 min) are the time constants governing the contraction and relaxation of the myocardial muscle during systole and diastole. T is the duration of one cardiac cycle (1/heart rate), Ts is the length of systole (T/3 at rest and T/2 at exercise), and t is the current point in the cardiac cycle. Systole and diastole were switched for modeling atrial contraction. CVD and CVS were the minimum and maximum compliance values (CVs) of the chamber. The valves were modeled as linear unidirectional resistors with a resistance of 0.01 WU. Please note that 1 WU is equivalent to 1 mmHg·l·min−1 and is a commonly used clinical parameter to describe resistance to blood flow. The parameter values used in Eq. 5 for each heart chamber are shown in Table 3.
Table 3.
Parameters used for modeling the heart chambers
| Parameter | Normal Heart | Single Ventricle Heart |
|---|---|---|
| CVDRA, l/mmHg | 0.03 | N/A |
| CVSRA, l/mmHg | 0.0003 | N/A |
| CVDRV, l/mmHg | 0.0365 | N/A |
| CVSRV, l/mmHg | 0.0002 | N/A |
| CVDLA, l/mmHg | 0.01 | 0.01 |
| CVSLA, l/mmHg | 0.0003 | 0.0003 |
| CVDLV, l/mmHg | 0.0146 | 0.0146 |
| CVSLV, l/mmHg | 0.00003 | 0.00003 |
| RMi, WU | 0.01 | 0.01 |
| RTr, WU | 0.01 | N/A |
| RAo, WU | 0.01 | 0.01 |
| RPu, WU | 0.01 | N/A |
Shown are parameters used for describing the heart chambers in the mathematical model. CVD, minimum compliance value; CVS, maximum compliance value; RA, right atrium; RV, right ventricle; LA, left atrium; LV, left ventricle; RMi, mitral valve resistance; RTr, tricuspid valve resistance; RAo, aortic valve resistance; RPu, pulmonic valve resistance; N/A, not applicable.
Modeling Rest/Exercise Conditions and Data Analysis
Rest.
To simulate the impact of TCPC resistance on CO, RTCPC in the model was uniformly varied from 0 to 1.8 WU (from 0 to 90% PVR), and its corresponding effect on CO for the biventricular and univentricular circulations was evaluated. The range of RTCPC was selected based on the computational models described above and were used to evaluate the sensitivity of the model to RTCPC. For the biventricular circulation, since there is no TCPC, the PVR was increased by an equivalent amount. In addition, pressure-volume analysis was conducted for a normal subject and TCPC cases with the highest, mean, and lowest resistances to demonstrate how the operating point of the univentricular circulation changes with resistance.
Exercise conditions.
To isolate the impact of just RTCPC, the following parameters were changed for simulating exercise conditions:
EXERCISE CONDITION 1.
The heart rate was uniformly increased from 70 to 150 beats/min, simulating the primary response to exercise as outlined by several human and animal studies (5, 11, 12, 14, 21–24, 26, 32, 34–36, 40). For the normal circulation, the ventricular contraction properties (CVD and CVS) were changed in addition to heart rate to model the typical response to exercise for a normal heart. This was not done for the SV circulation, as it has been previously demonstrated that Fontan patients increase CO primarily by increasing their heart rate and do not change their ventricular contraction properties to increase stroke volume (35, 36, 40). Therefore, only the heart rate was increased in the SV circulation as the primary response to exercise.
EXERCISE CONDITION 2.
SVR typically goes down with exercise, demonstrating the impact of peripheral muscular dynamics and the vasodilation that occurs to aid the increase in CO (1). Studies have shown a drop of ∼50% in SVR. This was accomplished in the model by decreasing the SVR progressively from 18.5 WU, as measured from the catheterization data, to 11 WU for both the normal and SV circulation.
EXERCISE CONDITION 3.
There is also a significant impact of the pulmonary system and lungs during exercise, especially in Fontan patients, where the negative intrathoracic pressure greatly augments flow. Studies have reported a 40% drop in the PVR as a result of this phenomenon in addition to the local vasodilation that occurs to improve exercise tolerance (1). Therefore, the PVR in our model was gradually dropped from 1.96 WU, as measured from the catheterization data, to 1.1 WU, based on the severity of exercise.
EXERCISE CONDITION 4.
As the CO increases with increasing heart rate, so does RTCPC. Figure 3 shows the dynamic range of RTCPC values and how they change between the different geometries. As can be observed, there is a nonlinear increase in resistance with CO. This phenomenon becomes important during elevated CO conditions. To take this characteristic into account, RTCPC was treated as a dynamic element that increased with an increase in CO. The RTCPC curves shown in Fig. 3 were used to evaluate the correct resistance for each exercise condition.
Fig. 3.

RTCPC plotted as a function of cardiac index representing 16 geometries used in the study. These curves were used as inputs to the lumped parameter model. The maximum resistance curve corresponds to model M16, whereas the minimum resistance curve corresponds to model M6. The mean resistance curve is the mean resistance at rest, moderate exercise, and severe exercise, respectively.
Based on these exercise conditions, the following parameters were evaluated as a function of heart rate for the normal and SV circulations, respectively: CO, end-systolic pressure, central venous pressure (CVP), Ea, Ees, the ventricular-vascular coupling ratio (Ea/Ees), RTCPC, and the ratio of RTCPC to PVR (RTCPC/PVR). Pressure-volume loops were used to evaluate the slope of the end-systolic volume elastance, or Ees, and the vascular Ea property. These parameters were evaluated based on the methodology outlined by Nogaki et al. (22). All authors had full access to the data and take responsibility for its integrity. All authors read and agreed to the manuscript as written.
RESULTS
SV Resistance
The average age and body surface area of the patients used in this study were 8.25 ± 4.28 yr (minimum: 2 yr and maximum: 18 yr) and 0.97 ± 0.28 m2 (minimum: 0.54 m2 and maximum: 1.49 m2), respectively. Measured PVR was 1.96 ± 0.80 WU (minimum: 1 WU and maximum: 4.3 WU), and measured SVR was 18.4 ± 7.2 WU (minimum: 10.6 WU and maximum: 47.8 WU). Figure 3 shows the change in RTCPC with exercise for the models used in the study. RTCPC values were 0.39 ± 0.26 WU (minimum: 0.1 WU and maximum: 1.08 WU) during rest, 0.70 ± 0.45 WU (minimum: 0.13 WU and maximum: 1.72 WU) during moderate exercise, and 1.06 ± 0.73 WU (minimum: 0.18 WU and maximum: 2.65 WU) during severe exercise. The most efficient TCPCs at rest and exercise were models M7 and M9, respectively. The least efficient TCPCs at rest and exercise were models M13 and M17. RTCPC values were evaluated to be significant percentages of the measured PVR (22% at rest).
Intra-atrial TCPCs had higher resistances (0.43 ± 0.12 WU; minimum: 0.24 WU and maximum: 0.59 WU) compared with extracardiac TCPCs (0.35 ± 0.35 WU; minimum: 0.1 WU and maximum: 1.08 WU), although this was not statistically significant. The results were skewed due to the presence of an outlier in model M12 for the extracardiac case. If this outlier is removed from the analysis, then the results do become statistically significant at P < 0.05.
Lumped Parameter Model Validation
For a simulated resting heart rate of 70 beats/min and an average RTCPC of 0.39 WU, systolic/diastolic aortic pressures were 117/85 mmHg and 115/73 mmHg for the normal and SV cases, respectively. The lower diastolic pressures resulted in a lower mean aortic pressure of 95 mmHg (compared with 103 mmHg) for the SV circulation. CO was significantly lower for the SV circulation at 3.8 compared with 5.1 l/min for the normal circulation. This can be attributed to the increased Ea experienced by the SV due the lack of a pumping chamber on the right side. Pulmonary artery pressures were nonpulsatile in the SV circulation, which resulted in nonpulsatile flow in the pulmonary arteries, which was in corroboration with previous clinical studies. Table 4 shows a comparison of the modeled hemodynamic data versus observed data from cardiac catheterization performed on 40 patients with a SV physiology. There was a good match between what was predicted by the model and what was observed clinically, demonstrating the validity of the model used for this study.
Table 4.
Comparison of predicted versus modeled data
| Variable | Predicted Data | Observed Data | Average Percent Difference |
|---|---|---|---|
| Cardia output, l/min | 3.8 | 3.6±1.7 | 5.2 |
| Pressure at systole, mmHg | 115 | 114±22 | 0.8 |
| Pressure at diastole, mmHg | 73 | 63±10 | 15.8 |
| Pressure in the SVB, mmHg | 13 | 13.5±3 | 0.6 |
Shown is a comparison of predicted and observed values of hemodynamic parameters from cardiac catheterization data acquired from 40 patients with single ventricle physiology.
Effect of RTCPC at Rest
Figure 4 shows the impact of RTCPC on hemodynamics in a SV and normal circulation at a resting heart rate of 70 beats/min. There was a drop in CO going from a biventricular to univentricular circulation at zero resistance, which was due to the lack of a systemic ventricle and the serial configuration of the two circulations. The sensitivity of CO to RTCPC in the SV was −0.88, which was significantly higher compared with −0.064 for the normal biventricular circulation. This implies that for every 10% increase in resistance, there is an 8.8% drop in CO. Figure 4C shows the impact of RTCPC on CVP. The sensitivity of CVP to increase in RTCPC was 0.64, implying that a 10% increase in resistance results in a 6.4% increase in CVP. The increase in CVP in the SV has been previously shown using acute in vivo animal experiments (40), human experiments (35), and theoretical experiments (14, 22). However, the impact of the TCPC procedure on CVP was shown for the first time in this study.
Fig. 4.

Impact of RTCPC on cardiac output (A), end-systolic pressure (B), central venous pressure (C), afterload (Ea; D), preload (Ees; E), and the ventricular vascular coupling ratio (F) under resting conditions.
Effect of RTCPC During Exercise
Figure 5 shows hemodynamic responses to exercise as predicted by the model. The biventricular circulation was able to increase the CO of 5.1 l/min at a heart rate of 70 beats/min to 11.4 l/min at an exercise heart rate of 150 beats/min (Fig. 5A). This ability to increase CO was blunted in the SV circulation. In the SV, the increase in CO was only from 3.8 to 5.4 l/min for a mean RTCPC of 0.39 WU, from 4.4 to 6.8 l/min for the TCPC with a minimum resistance of 0.1 WU, and from 3.3 to 4.1 l/min for a highly dissipative TCPC with a resistance of 1.08 WU. There was an increase in end-systolic pressure with exercise for the biventricular circulation but not so for the SV circulation (Fig. 5B). The CVP was consistently higher for the TCPC with high resistance (Fig. 5C).
Fig. 5.

Impact of increasing heart rate on cardiac output (A), end-systolic pressure (B), central venous pressure (C), ventricular Ea (D), ventricular Ees (E), vascular-ventricular coupling (F), RTCPC (G), and RTCPC/pulmonary vascular resistance (PVR) (H) for the case of a normal biventricular circulation (⧫) and single ventricle scenarios with a low-resistance TCPC (▪), mean-resistance TCPC (•), or high-resistance TCPC (▴).
The Ea experienced by the SV significantly increased with exercise compared with the biventricular circulation (Fig. 5D). The presence of a highly dissipative TCPC further increased Ea. The increases were from 1.65, 1.62, and 1.7 mmHg/ml to 2.23, 2.14, and 2.54 mmHg/ml for mean, minimum, and maximum RTCPC values, respectively. Although similar at rest, the differences increased with exercise. In comparison, Ea only increased from 1.46 to 1.87 mmHg/ml for the biventricular circulation. Ventricular Ees increased (3.63 to 4.39 mmHg/ml) in the normal circulation, whereas it decreased in the case of the SV circulation (Fig. 5E). For the three SV scenarios, Ees dropped from 3.12, 3.40, and 2.79 mmHg/ml to 2.73, 3.24, and 2.26 mmHg/ml for mean, minimum, and maximum RTCPC values, respectively. This resulted in a mismatch in the Ees and Ea experienced by the ventricle, resulting in an abnormal increase in the ventricular vascular coupling ratio (Ea/Ees) for the univentricular circulation, which was further worsened by the presence of a TCPC with high resistance. While the Ea/Ees almost remained flat for the biventricular circulation, it increased for the univentricular circulation (Fig. 5F). The increases were from 0.53, 0.48, and 0.61 mmHg/ml to 0.82, 0.66, and 1.05 mmHg/ml for mean, minimum, and maximum RTCPC values, respectively.
Finally, a human study (1) established that PVR and SVR go down with exercise. However, RTCPC increases with exercise, as shown in Fig. 3, implying that the TCPC bottleneck becomes more significant during exercise. Figure 5, G and H, demonstrate that, although at rest RTCPC is a fraction of PVR (22%), this fraction significantly increases with exercise (50%). In fact, for the TCPC with a high resistance, this fraction increased from 55% at rest to 155% during exercise, whereas for the TCPC with a low resistance, this change was minimal, going from 7% to 16%. This demonstrates the significant improvement that can be accomplished by optimizing TCPC geometry.
DISCUSSION
This study demonstrated that the TCPC, which is in series with PVR and SVR, plays a significant role in regulating CO and exercise performance in the SV. It brings to forefront that RTCPC is not trivial compared with downstream PVR and that any obstruction in TCPC pathway can have a more significant impact on cardiac function of a SV circulation than a biventricular circulation. Most studies until now have only demonstrated this phenomenon in a global sense by looking at the SV circulation as a whole (22–24, 35, 36, 40), and the hydrodynamic role of the TCPC was not investigated in these studies. This study shows, for the first time, using mathematical modeling with patient-specific imaging, flow simulations, and cardiac catheterization measurements, the important role played by the surgically altered TCPC geometry and the mechanism by which it impacts the resting and exercise hemodynamic capacity of patients with a Fontan physiology.
The reduced capacity to increase CO with exercise in SV circulations has been well documented in the literature (5, 15, 17, 23). However, the exact quantitative relationship between RTCPC and this phenomenon has been unclear, primarily because of two reasons: 1) lack of appropriate methods for quantifying TCPC efficiency and 2) the complex interrelationships that exist between the respiratory, skeletal, and cardiovascular system that make it difficult to establish correlations between the TCPC and exercise capacity. Therefore, there is a tendency to discount the impact of the TCPC on exercise as negligible. Although PVR drops as a result of exercise, the increased RTCPC with increasing CO makes it the primary bottleneck during increased cardiovascular demand.
The significant variability of Fontan geometries translates to significant variability in resistances. The resistance of the “worst” TCPC was 10 times higher than the resistance of the “best” TCPC. This suggests that the TCPC procedures performed today are far from optimal, and more emphasis needs to be given for optimizing the geometries preoperatively, especially, since the sensitivity of the univentricular circulation to changes in resistance is quite significant, with a 10% increase in resistance resulting in an 8.8% decrease in CO. To verify if this phenomenon is observed in vivo, the cardiac index measured using PC MRI was plotted against the resistance evaluated using CFD for all the patients in this study (Fig. 6). Clearly, a weak but significant (P < 0.05) negative correlation can be observed between RTCPC and the resting cardiac index measured in these patients. It should be noted that RTCPC (as defined in the present study) is independent of downstream PVR. The only dependence is indirect, as PVR can regulate CO and RTCPC changes with CO (Fig. 4). Outside of this phenomenon, RTCPC is largely governed by geometry and the surgeon's decision at the time of the surgery.
Fig. 6.

Cardiac index versus resistance for the 16 patients in the study. The cardiac index was evaluated using MRI, and the resistance was evaluated using computational fluid dynamics.
This study sought to bring to the clinician's attention the following messages: 1) final-stage TCPC surgery has not yet been optimized, which is evident from the significant variability in the observed resistances; and 2) the resistance of the TCPC itself is not secondary to PVR, as commonly believed, and physiologically it plays a greater role when going from rest to exercise. Herein lies the clinical significance of the study. RTCPC is directly proportional to Ea (as higher systolic pressures are needed to maintain CO for TCPCs with higher resistance) and inversely proportional to Ees (as higher pressure drops across the TCPC result in lower filling pressures). This observation points toward a unique property of the SV circulation: both Ees and Ea are impacted in identical manner by the TCPC as the pulmonary ventricle is replaced by a dynamic resistance in the form of the TCPC.
Not only does optimizing RTCPC improve cardiac function, but it drops CVP, which is critical to maintaining normal gastrointestinal function. In addition, optimal TCPC geometries have improved flow dynamics in the baffle that may reduce the risk of thromboembolic complications. Hence, new TCPC designs that reduce energy losses need to be investigated in more detail, and more emphasis needs to be given for improving the hemodynamic efficiency within the TCPC. Surgical planning approaches combining preoperative MRI, CFD, and the presented lumped parameter model can prove to be beneficial in determining the optimum TCPC geometries. Previous studies on surgical planning and TCPC geometric optimization studies have shown that significant improvements with reductions of >50% in energy losses can be accomplished (4, 6, 7, 33, 37, 38). If appropriate surgical planning strategies are used, then it is possible to accomplish similar improvements in energy losses in vivo as well.
Limitations
Although our model has a sound basis in clinically measured data and compares well with other clinical studies, the inherent limitations of this work are well acknowledged. Primarily, the resting and exercise hemodynamic conditions are modeled and are not empirically observed data. Specifically, the biochemical response to exercise, cardiopulmonary interactions, and baroreflex response have not been modeled in order to achieve a simpler model with less variables. Since this is more of a comparative study between different SV circulations and the biventricular circulation, the only parameter that was changed between different cases was RTCPC. Incorporating a more complex model will no doubt improve the accuracy of the model's predictions, but the relative impact of RTCPC, as illustrated here, is not expected to change.
Conclusions
This is the first time the impact of TCPC surgical resistance on overall hemodynamics of the univentricular circulation has been demonstrated. RTCPC has a direct impact on Ea and Ees of the univentricular circulation and significantly impacts resting and exercise hemodynamics. The inability to increase CO with exercise limits patients' ability to exercise and hence worsens their overall functional outcome. This can be countered by optimizing the geometry of the TCPC before the Fontan surgery, which may result in decreased Ea and, consequently, an improvement in cardiac function.
GRANTS
This work was funded by National Heart, Lung, and Blood Institute Grant HL-67622 and an American Heart Association's predoctoral fellowship award.
Acknowledgments
We acknowledge Dr. W. James Parks from Children's Healthcare of Atlanta for providing data.
The costs of publication of this article were defrayed in part by the payment of page charges. The article must therefore be hereby marked “advertisement” in accordance with 18 U.S.C. Section 1734 solely to indicate this fact.
REFERENCES
- 1.Bendien C, Bossina KK, Buurma AE, Gerding AM, Kuipers JR, Landsman ML, Mook GA, Zijlstra WG. Hemodynamic effects of dynamic exercise in children and adolescents with moderate-to-small ventricular septal defects. Circulation 70: 929–934, 1984. [DOI] [PubMed] [Google Scholar]
- 2.de Leval MR The Fontan circulation: what have we learned? What to expect? Pediatr Cardiol 19: 316–320, 1998. [DOI] [PubMed] [Google Scholar]
- 3.de Leval MR, Kilner P, Gewillig M, Bull C. Total cavopulmonary connection: a logical alternative to atriopulmonary connection for complex Fontan operations. Experimental studies and early clinical experience. J Thorac Cardiovasc Surg 96: 682–695, 1988. [PubMed] [Google Scholar]
- 4.de Zelicourt DA, Pekkan K, Parks J, Kanter K, Fogel M, Yoganathan AP. Flow study of an extracardiac connection with persistent left superior vena cava. J Thorac Cardiovasc Surg 131: 785–791, 2006. [DOI] [PubMed] [Google Scholar]
- 5.Durongpisitkul K, Driscoll DJ, Mahoney DW, Wollan PC, Mottram CD, Puga FJ, Danielson GK. Cardiorespiratory response to exercise after modified Fontan operation: determinants of performance. J Am Coll Cardiol 29: 785–790, 1997. [DOI] [PubMed] [Google Scholar]
- 6.Ensley AE, Lynch P, Chatzimavroudis GP, Lucas C, Sharma S, Yoganathan AP. Toward designing the optimal total cavopulmonary connection: an in vitro study. Ann Thorac Surg 68: 1384–1390, 1999. [DOI] [PubMed] [Google Scholar]
- 7.Ensley AE, Ramuzat A, Healy TM, Chatzimavroudis GP, Lucas C, Sharma S, Pettigrew R, Yoganathan AP. Fluid mechanic assessment of the total cavopulmonary connection using magnetic resonance phase velocity mapping and digital particle image velocimetry. Ann Biomed Eng 28: 1172–1183, 2000. [DOI] [PubMed] [Google Scholar]
- 8.Fogel MA, Weinberg PM, Fellows KE, Hoffman EA. Magnetic resonance imaging of constant total heart volume and center of mass in patients with functional single ventricle before and after staged Fontan procedure. Am J Cardiol 72: 1435–1443, 1993. [DOI] [PubMed] [Google Scholar]
- 9.Frakes DH, Conrad CP, Healy TM, Monaco JW, Fogel M, Sharma S, Smith MJ, Yoganathan AP. Application of an adaptive control grid interpolation technique to morphological vascular reconstruction. IEEE Trans Biomed Eng 50: 197–206, 2003. [DOI] [PubMed] [Google Scholar]
- 10.Fredriksen PM, Therrien J, Veldtman G, Warsi MA, Liu P, Siu S, Williams W, Granton J, Webb G. Lung function and aerobic capacity in adult patients following modified Fontan procedure. Heart 85: 295–299, 2001. [DOI] [PMC free article] [PubMed] [Google Scholar]
- 11.Hjortdal VE, Emmertsen K, Stenbog E, Frund T, Schmidt MR, Kromann O, Sorensen K, Pedersen EM. Effects of exercise and respiration on blood flow in total cavopulmonary connection: a real-time magnetic resonance flow study. Circulation 108: 1227–1231, 2003. [DOI] [PubMed] [Google Scholar]
- 12.Joshi VM, Carey A, Simpson P, Paridon SM. Exercise performance following repair of hypoplastic left heart syndrome: a comparison with other types of Fontan patients. Pediatr Cardiol 18: 357–360, 1997. [DOI] [PubMed] [Google Scholar]
- 13.Kelley JR, Mack GW, Fahey JT. Diminished venous vascular capacitance in patients with univentricular hearts after the Fontan operation. Am J Cardiol 76: 158–163, 1995. [DOI] [PubMed] [Google Scholar]
- 14.Magosso E, Cavalcanti S, Ursino M. Theoretical analysis of rest and exercise hemodynamics in patients with total cavopulmonary connection. Am J Physiol Heart Circ Physiol 282: H1018–H1034, 2002. [DOI] [PubMed] [Google Scholar]
- 15.Marino BS Outcomes after the Fontan procedure. Curr Opin Pediatr 14: 620–626, 2002. [DOI] [PubMed] [Google Scholar]
- 16.Matthews IL, Fredriksen PM, Bjornstad PG, Thaulow E, Gronn M. Reduced pulmonary function in children with the Fontan circulation affects their exercise capacity. Cardiol Young 16: 261–267, 2006. [DOI] [PubMed] [Google Scholar]
- 17.McCrindle BW, Williams RV, Mital S, Clark BJ, Russell JL, Klein G, Eisenmann JC. Physical activity levels in children and adolescents are reduced after the Fontan procedure, independent of exercise capacity, and are associated with lower perceived general health. Arch Dis Child 92: 509–514, 2007. [DOI] [PMC free article] [PubMed] [Google Scholar]
- 18.McCrindle BW, Williams RV, Mitchell PD, Hsu DT, Paridon SM, Atz AM, Li JS, Newburger JW. Relationship of patient and medical characteristics to health status in children and adolescents after the Fontan procedure. Circulation 113: 1123–1129, 2006. [DOI] [PubMed] [Google Scholar]
- 19.Migliavacca F, Pennati G, Dubini G, Fumero R, Pietrabissa R, Urcelay G, Bove EL, Hsia TY, de Leval MR. Modeling of the Norwood circulation: effects of shunt size, vascular resistances, and heart rate. Am J Physiol Heart Circ Physiol 280: H2076–H2086, 2001. [DOI] [PubMed] [Google Scholar]
- 20.Milanesi O, Stellin G, Colan SD, Facchin P, Crepaz R, Biffanti R, Zacchello F. Systolic and diastolic performance late after the Fontan procedure for a single ventricle and comparison of those undergoing operation at <12 months of age and at >12 months of age. Am J Cardiol 89: 276–280, 2002. [DOI] [PubMed] [Google Scholar]
- 21.Minamisawa S, Nakazawa M, Momma K, Imai Y, Satomi G. Effect of aerobic training on exercise performance in patients after the Fontan operation. Am J Cardiol 88: 695–698, 2001. [DOI] [PubMed] [Google Scholar]
- 22.Nogaki M, Senzaki H, Masutani S, Kobayashi J, Kobayashi T, Sasaki N, Asano H, Kyo S, Yokote Y. Ventricular energetics in Fontan circulation: evaluation with a theoretical model. Pediatr Int 42: 651–657, 2000. [DOI] [PubMed] [Google Scholar]
- 23.Ohuchi H Cardiopulmonary response to exercise in patients with the Fontan circulation. Cardiol Young 15, Suppl 3: 39–44, 2005. [DOI] [PubMed] [Google Scholar]
- 24.Ohuchi H, Arakaki Y, Yagihara T, Kamiya T. Cardiorespiratory responses to exercise after repair of the univentricular heart. Int J Cardiol 58: 17–30, 1997. [DOI] [PubMed] [Google Scholar]
- 25.Palladino JL, Ribiero LC, Noordergraaf A. Human system circulation model based on the Frank mechansim. In: Mathematical Modeling in Medicine, edited by Ottesen JT, Danielson M. Amsterdam, The Netherlands: IOS Press, 2000, p. 29–40.
- 26.Pedersen EM, Stenbog EV, Frund T, Houlind K, Kromann O, Sorensen KE, Emmertsen K, Hjortdal VE. Flow during exercise in the total cavopulmonary connection measured by magnetic resonance velocity mapping. Heart 87: 554–558, 2002. [DOI] [PMC free article] [PubMed] [Google Scholar]
- 27.Pekkan K, de Zelicourt D, Ge L, Sotiropoulos F, Frakes D, Fogel MA, Yoganathan AP. Physics-driven CFD modeling of complex anatomical cardiovascular flows–a TCPC case study. Ann Biomed Eng 33: 284–300, 2005. [DOI] [PubMed] [Google Scholar]
- 28.Pekkan K, Frakes D, De Zelicourt D, Lucas CW, Parks WJ, Yoganathan AP. Coupling pediatric ventricle assist devices to the Fontan circulation: simulations with a lumped-parameter model. ASAIO J 51: 618–628, 2005. [DOI] [PubMed] [Google Scholar]
- 29.Pekkan K, Kitajima HD, de Zelicourt D, Forbess JM, Parks WJ, Fogel MA, Sharma S, Kanter KR, Frakes D, Yoganathan AP. Total cavopulmonary connection flow with functional left pulmonary artery stenosis: angioplasty and fenestration in vitro. Circulation 112: 3264–3271, 2005. [DOI] [PubMed] [Google Scholar]
- 30.Penny DJ, Redington AN. Diastolic ventricular function after the Fontan operation. Am J Cardiol 69: 974–975, 1992. [DOI] [PubMed] [Google Scholar]
- 31.Peskin CS, Tu C. Hemodynamics in congenital heart disease. Comput Biol Med 16: 331–359, 1986. [DOI] [PubMed] [Google Scholar]
- 32.Reybrouck T, Mertens L. Physical performance and physical activity in grown-up congenital heart disease. Eur J Cardiovasc Prev Rehabil 12: 498–502, 2005. [DOI] [PubMed] [Google Scholar]
- 33.Ryu K, Healy TM, Ensley AE, Sharma S, Lucas C, Yoganathan AP. Importance of accurate geometry in the study of the total cavopulmonary connection: computational simulations and in vitro experiments. Ann Biomed Eng 29: 844–853, 2001. [DOI] [PubMed] [Google Scholar]
- 34.Sanghavi DM, Flanagan M, Powell AJ, Curran T, Picard S, Rhodes J. Determinants of exercise function following univentricular versus biventricular repair for pulmonary atresia/intact ventricular septum. Am J Cardiol 97: 1638–1643, 2006. [DOI] [PubMed] [Google Scholar]
- 35.Senzaki H, Masutani S, Ishido H, Taketazu M, Kobayashi T, Sasaki N, Asano H, Katogi T, Kyo S, Yokote Y. Cardiac rest and reserve function in patients with Fontan circulation. J Am Coll Cardiol 47: 2528–2535, 2006. [DOI] [PubMed] [Google Scholar]
- 36.Senzaki H, Masutani S, Kobayashi J, Kobayashi T, Sasaki N, Asano H, Kyo S, Yokote Y, Ishizawa A. Ventricular afterload and ventricular work in fontan circulation: comparison with normal two-ventricle circulation and single-ventricle circulation with blalock-taussig shunts. Circulation 105: 2885–2892, 2002. [DOI] [PubMed] [Google Scholar]
- 37.Sharma S, Goudy S, Walker P, Panchal S, Ensley A, Kanter K, Tam V, Fyfe D, Yoganathan A. In vitro flow experiments for determination of optimal geometry of total cavopulmonary connection for surgical repair of children with functional single ventricle. J Am Coll Cardiol 27: 1264–1269, 1996. [DOI] [PubMed] [Google Scholar]
- 38.Soerensen DD, Pekkan K, de Zelicourt D, Sharma S, Kanter K, Fogel M, Yoganathan AP. Introduction of a new optimized total cavopulmonary connection. Ann Thorac Surg 83: 2182–2190, 2007. [DOI] [PubMed] [Google Scholar]
- 39.Sun Y, Beshara M, Lucariello RJ, Chiaramida SA. A comprehensive model for right-left heart interaction under the influence of pericardium and baroreflex. Am J Physiol Heart Circ Physiol 272: H1499–H1515, 1997. [DOI] [PubMed] [Google Scholar]
- 40.Szabo G, Buhmann V, Graf A, Melnitschuk S, Bahrle S, Vahl CF, Hagl S. Ventricular energetics after the Fontan operation: contractility-afterload mismatch. J Thorac Cardiovasc Surg 125: 1061–1069, 2003. [DOI] [PubMed] [Google Scholar]
- 41.Wang C, Pekkan K, de Zelicourt D, Horner M, Parihar A, Kulkarni A, Yoganathan AP. Progress in the CFD modeling of flow instabilities in anatomical total cavopulmonary connections. Ann Biomed Eng 35: 1840–1856, 2007. [DOI] [PubMed] [Google Scholar]
- 42.Whitehead KK, Pekkan K, Kitajima HD, Paridon SM, Yoganathan AP, Fogel MA. Nonlinear power loss during exercise in single-ventricle patients after the Fontan: insights from computational fluid dynamics. Circulation 116: I165–171, 2007. [DOI] [PubMed] [Google Scholar]