Abstract
Multisensory neurons in the dorsal cochlear nucleus (DCN) achieve their bimodal response properties [Shore (2005) Eur. J. Neurosci., 21, 3334–3348] by integrating auditory input via VIIIth nerve fibers with somatosensory input via the axons of cochlear nucleus granule cells [Shore et al. (2000) J. Comp. Neurol., 419, 271–285; Zhou & Shore (2004) J. Neurosci. Res., 78, 901–907]. A unique feature of multisensory neurons is their propensity for receiving cross-modal compensation following sensory deprivation. Thus, we investigated the possibility that reduction of VIIIth nerve input to the cochlear nucleus results in trigeminal system compensation for the loss of auditory inputs. Responses of DCN neurons to trigeminal and bimodal (trigeminal plus acoustic) stimulation were compared in normal and noise-damaged guinea pigs. The guinea pigs with noise-induced hearing loss had significantly lower thresholds, shorter latencies and durations, and increased amplitudes of response to trigeminal stimulation than normal animals. Noise-damaged animals also showed a greater proportion of inhibitory and a smaller proportion of excitatory responses compared with normal. The number of cells exhibiting bimodal integration, as well as the degree of integration, was enhanced after noise damage. In accordance with the greater proportion of inhibitory responses, bimodal integration was entirely suppressive in the noise-damaged animals with no indication of the bimodal enhancement observed in a sub-set of normal DCN neurons. These results suggest that projections from the trigeminal system to the cochlear nucleus are increased and/or redistributed after hearing loss. Furthermore, the finding that only neurons activated by trigeminal stimulation showed increased spontaneous rates after cochlear damage suggests that somatosensory neurons may play a role in the pathogenesis of tinnitus.
Keywords: auditory, multisensory neurons, neural pathways, neural plasticity, somatosensory tinnitus, trigeminal
Introduction
The dorsal cochlear nucleus (DCN) receives auditory input from the VIIIth nerve and somatosensory input, indirectly, via the axons of cochlear nucleus (CN) granule cells (Shore et al., 2000; Zhou & Shore, 2004; Haenggeli et al., 2005). Stimulation of these somatosensory inputs can activate or inhibit cells in the ventral and dorsal divisions of the CN (Young et al., 1995; Shore et al., 2003; Shore, 2005), and can suppress or enhance their responses to sound, demonstrating bimodal integration (Shore et al., 2003; Shore, 2005). Bimodal integration in the principal projection neurons of the DCN is conveyed to neurons in the external nucleus of the inferior colliculus (Aikin et al., 1981; Jain & Shore, 2006; Zhou & Shore, 2006a), where it is replicated (Jain & Shore, 2006). Auditory somatosensory convergence has also been reported in the superior colliculus (Wallace et al., 1996; Wallace & Stein, 2001), medial geniculate nucleus (Wepsic, 1966) and auditory cortex (Foxe et al., 2000, 2002; Schroeder et al., 2001; Dehner et al., 2004).
One feature unique to multisensory neurons is their propensity for receiving cross-modal compensation following sensory deprivation or deafferentation. For example, in visually deprived mammals, auditory input from the inferior colliculus and auditory thalamus can be redirected to the visual thalamus and cortex (Batzri-Izraeli et al., 1990; Izraeli et al., 2002; Piche et al., 2007). The complex type of reorganization that occurs following deafferentation of the somatosensory cortex (Hickmott & Merzenich, 2002) is unlikely to occur at the level of the CN but cochlear deafferentation could result in cross-modal compensation by somatosensory inputs to the CN that would be the precursor to more complex changes in higher auditory structures. We investigated this hypothesis by examining trigeminal nerve influences on single units in the guinea pig DCN after noise-induced hearing loss.
Materials and methods
Experiments were performed on 18 healthy, female, adult pigmented guinea pigs (NIH outbred strain) with normal Preyer’s reflexes, weighing 250–400 g. Of these, six were used as control animals and 12 were exposed to broadband noise (BBN) (120 dB sound pressure level, SPL) for 4 h. Auditory brainstem responses (ABRs) were recorded before and after the noise exposures. Unit recordings were performed 1 week (six animals) or 2 weeks (six animals) following noise exposures. All procedures were performed in accordance with the NIH guidelines for the care and use of laboratory animals (NIH publication no. 80-23), guidelines provided by the University of Michigan (University Committee on the Use and Care of Animals) and Policies on the Use of Animals and Humans in Neuroscience Research approved by the Society for Neuroscience.
Surgical preparation
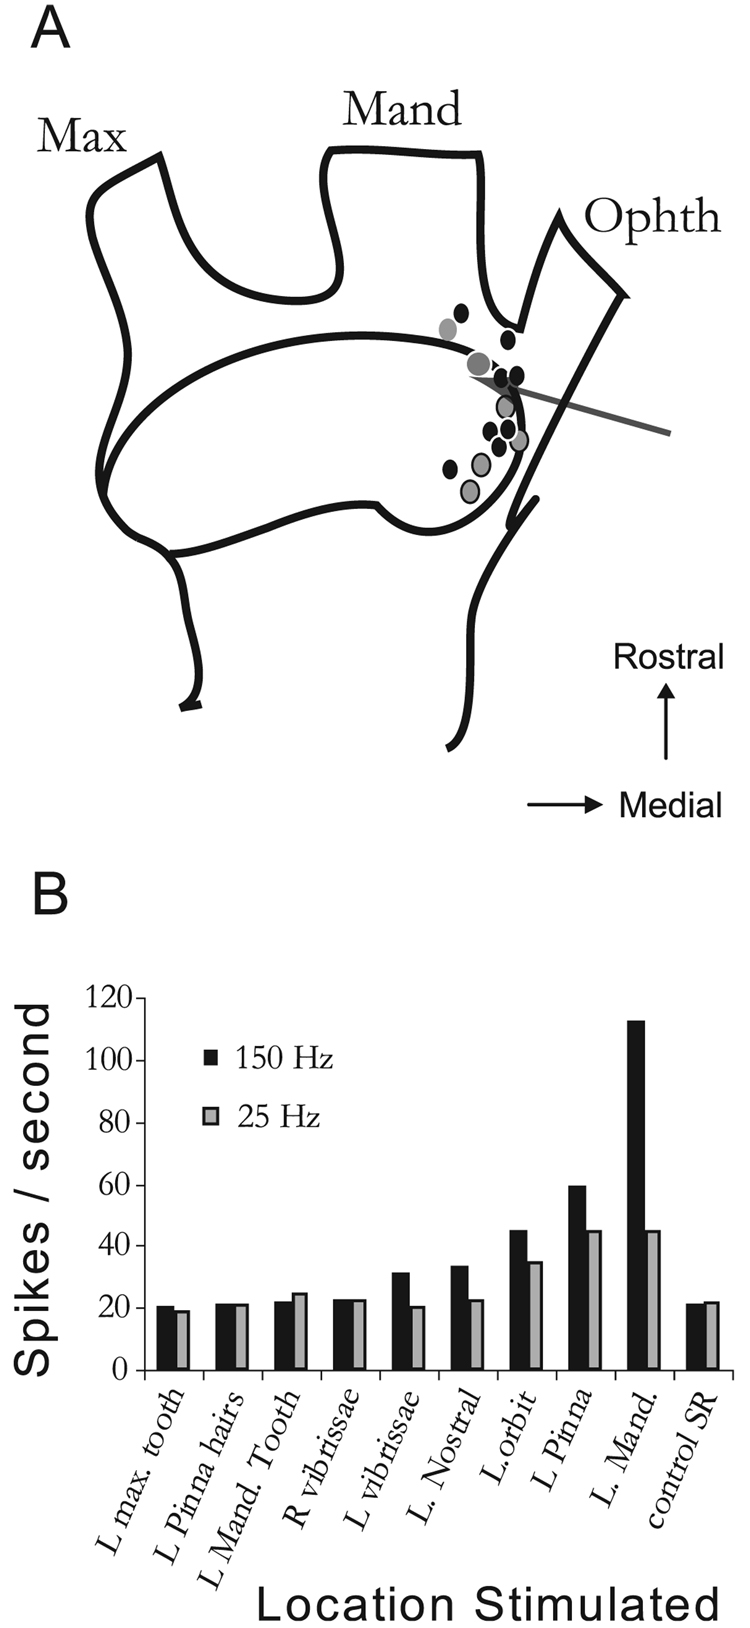
Guinea pigs were pre-medicated with a sympathetic blocking agent (Guanethedin, 30 mg/kg, Sigma Chemical Co., St Louis, MO, USA) to reduce sympathetic vasoconstriction (Salar et al., 1992). All animals were anesthetized with ketamine (40 mg/kg) and xylazine (10 mg/kg), and held in a stereotaxic device (Kopf) with hollow ear bars allowing for the delivery of sounds. Rectal temperature was monitored and maintained at 38 ± 0.5 °C with a thermostatically controlled heating pad. Supplemental anesthesia (0.5× original dose) was given approximately hourly, after performing a digital pinch test to elicit paw withdrawal. In addition, unit thresholds to BBN were monitored throughout the experiment. In cases where thresholds increased by more than 10 dB, the experiment was discontinued. The bone overlying the cerebellum and posterior occipital cortex was removed to allow visual placement of a recording electrode on the DCN, after aspirating a small amount of cerebellum to visualize its surface. The stimulating electrode was manually lowered into regions of ipsilateral trigeminal ganglion previously found to project to the CN (Shore et al., 2000) using stereotaxic coordinates [0.37 cm caudal to bregma, 0.45 cm lateral from the midline and 1.35 cm ventral to bregma (Vass et al., 1998)]. The electrodes were pretreated with fluorescent compounds (see histology, below) to enable post-mortem reconstruction of electrode tracks. Figure 1A shows a schematic of the electrode placement reconstructions for six normal and eight noise-damaged animals. In some experiments, a trigeminal ganglion receptive field was obtained by recording the firing rate from the stimulating electrode (arrow) whilst mechanically stimulating different regions of the face (Fig. 1B). The receptive field indicates that the major response was obtained by moving the jaw in a lateral direction. Smaller responses were obtained from the orbit, pinna and vibrissae. Similar receptive fields were obtained in other animals.
FIG. 1.
(A) Schematic of the stimulating electrode locations in the trigeminal ganglion for six normal (gray dots) and eight noise-damaged (black dots) animals. Arrow indicates the region from which a receptive field (B) was obtained by recording multiunit activity from the stimulating electrode while mechanically stimulating different regions of the head. The spike rates shown for each region are relative to a control spontaneous rate (SR) that was determined with the mechanical stimulator located on a remote site (the adjacent table top). Max, maxillary division; Mand, mandibular division; Ophth, ophthalmic division; L, left; R, right.
Recordings
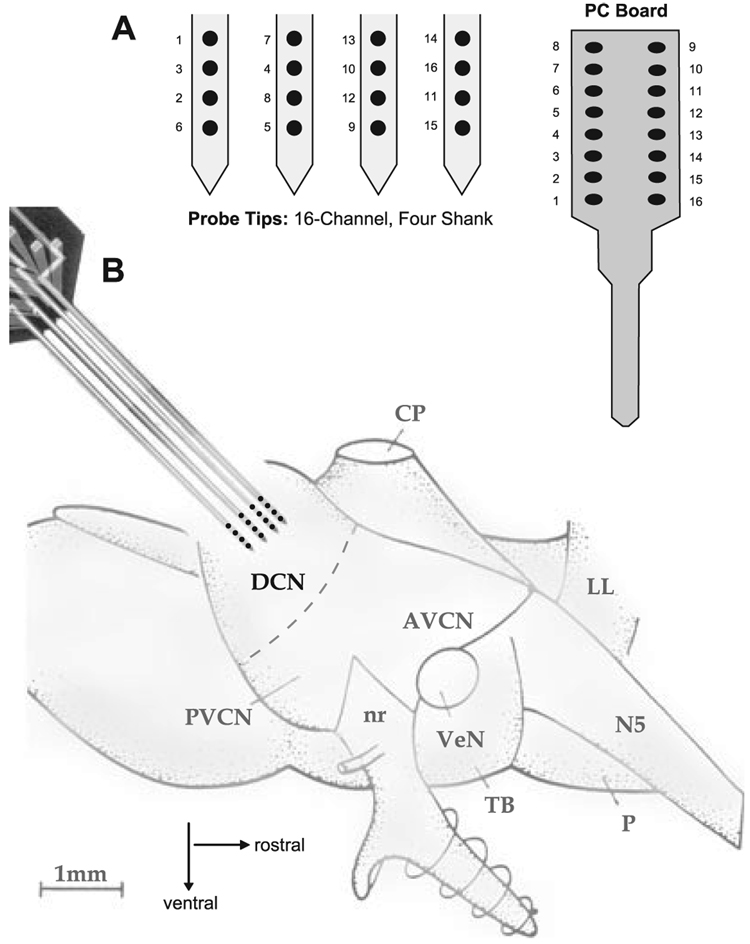
All unit recordings were made in a sound-attenuating double-walled booth. Four-shank, 16-channel Michigan electrodes were used to record unit activity, thus enabling us to record from many units simultaneously. The geometry of the recording sites and their orientation are shown in Fig. 2. In all animals, the electrode was inclined to an angle of 45° and positioned at a point on the DCN surface 1.00 mm medial to the caudal aspect of the paraflocular recess. The electrode was advanced 0.5 mm in a dorsal–ventral direction. The recording sites were separated by 100 µm and each shank was separated by 250 µm. The 16-channel multielectrode array was connected to a 16-channel amplifier via a signal input board that provided programmable gain, filtering (bandwidth 300–10 kHz) and analog-to-digital conversion. Analog-to-digital conversion was performed by simultaneously sampling 12-bit converters at 40 kHz per channel. Signals were then routed to multiple digital signal processor boards for computer-controlled spike waveform capture and sorting. The multichannel neuronal acquisition processor was designed to facilitate both spike detection and sorting. A spike detection threshold was set independently for each channel to four SDs above the mean background noise voltage. Timestamps and associated waveforms were collected at each threshold crossing. This included artifact waveforms generated by the electrical stimulus superimposed on neural activity.
FIG. 2.
(A) Geometry of the four-shank 16-channel silicon probe used in this study. The leads from each electrode are connected to the PC board shown at the top. The recording sites are distributed across the array, with four recording sites per shank separated by 100 µm. The four shanks are each separated by 250 µm. (B) The probe tips were placed on the surface of the dorsal cochlear nucleus (DCN) and advanced in a dorsal-to-ventral-to-rostral direction until the tips were located 0.5 mm below the surface of the DCN. The electrode tips were located in the same medial-lateral location (1 mm medial to the paraflocular recess) in all animals. AVCN, anteroventral cochlear nucleus; PVCN, posteroventral cochlear nucleus; nr, VIII nerve root; VeN, vestibular nerve; P, pons; TB, trapezoid body; LL, lateral lemniscus; N5, Vth nerve; CP, cerebellar peduncle.
Offline sorting and electrical artifact removal
Using the Plexon data collection system, units were first selected for capture by the system by determining a threshold value above the noise floor (+ 4 SDs). After data collection, the units were further sorted using the Plexon Offline sorter. Units were sorted on each channel using cluster analysis of principal component amplitudes. Artifact waveforms were easily eliminated as a clearly separate cluster. Removing artifacts sometimes resulted in a zero-latency (< 1 ms) dip (i.e. lack of spikes) in the post-stimulus time histograms at the time of the electrical stimulus. This artifact removal did not affect the other waveforms and was ignored for analysis purposes. Following artifact removal, it was often possible to sort waveforms into more than one single unit per channel using statistical criteria (P < 0.05) provided by the program, thus increasing our yield of individually isolated units. Units separated using automatic cluster analysis methods were manually verified in terms of their amplitude consistency over trials and interspike intervals.
Electrical stimuli
Electrical pulses (100 µs/phase) were presented at intervals of 660 ms. A concentric, bipolar stimulating electrode (Frederick Haer and Co.) was used to reduce current spread. Current amplitudes ranged from 10 to 90 µA. Spontaneous and evoked neuronal responses were collected over a 100 ms window for 100 or 200 presentations.
Acoustic stimuli
Acoustic stimuli were delivered to the ears via Beyer dynamic earphones coupled to the hollow ear bars of a Kopf small animal stereotaxic apparatus using Tucker Davis Technologies system II hardware for digital-to-analog conversion and analog attenuation. Digital signals were generated using the Tucker Davis Technologies software package SigPlay32, using a sample rate of 100 kHz at 16-bit resolution. Tones were calibrated using a 1/4 inch microphone coupled to the ear bar with a 0.5 ml tube. The microphone output was measured using Tucker Davis Technologies software (SigCal). Noise was calibrated with the 1/4 inch microphone and coupler attached to a sound level meter set to measure the bandwidth of interest (20 Hz–20 kHz for BBN). Equalization to correct for the system response was performed on the digital waveforms in the frequency domain. The stimulus variable sequences in pseudo-random order were generated from within the software program MATLAB. The maximum output of the system was 80 dB SPL.
Unit typing
Units were isolated using principal component analysis before classification. In normal animals, responses were considered to be within normal limits if BBN thresholds ranged between 10 and 30 dB SPL, levels previously correlated with normal compound action potentials (Le Prell et al., 2003; Shore, 2005). In cases where there were remaining responses to acoustic stimuli in noise-damaged animals, unit types were identified at 10 or 20 dB above threshold, i.e. at 10 or 20 dB sensation level (dB SL). Acoustic stimuli for unit typing consisted of 50 ms tone bursts with 1.5 ms rise/fall times, at unit best frequency (BF), as well as 50 ms BBN bursts (5/s, 1.5 ms rise/fall times). Units were classified on the basis of their post-stimulus time histogram shapes generated in response to the BF tone bursts at 20 dB SL and rate-level functions for BF tone bursts and noise bursts (Godfrey et al., 1975a,b; Rhode & Smith, 1986; Stabler et al., 1996; Young, 1998). Response areas, interspike interval histograms and regularity analyses assisted in the classification.
Measurements of threshold, latency and duration of responses to trigeminal stimulation
Measurements were performed by the same research assistant for all animals. The assistant was blind to which condition was being assessed, i.e. control, 1 or 2 weeks following noise exposure. Threshold was defined as the level that demonstrated an increase in the firing rate that was 2 SDs above the average firing rate or 1 SD below the average firing rate (inhibition was generally of lower amplitude than excitation). Threshold was verified by comparing the response to the next higher level, at which a strong response around the same latency was observed, as well as the next lower level at which no response was observed. Latency was the point in time at which the firing rate was 2 SDs above or 1 SD below the average firing rate preceding stimulation. Duration started at the onset of response and ended when the firing rate recovered to the spontaneous rate (SR).
Definition of response types to trigeminal stimulation
Three response types were defined [as previously described by Shore (2005)]: excitatory (E), in which the response increased above SR as defined above and returned to SR after a duration of 2 ms or greater (usually more than 5 ms); inhibitory (In), in which the response decreased below SR as defined above and returned to SR after a duration of 5 ms or greater (usually more than 5 ms); and excitatory/inhibitory (E/In), in which the response increased above SR as defined above and was followed by inhibition before returning to SR after a total (E + In) duration of 5 ms or greater (usually more than 10 ms).
Multisensory integration
For assessment of integration of acoustic and trigeminal information, electrical stimuli were applied to the trigeminal ganglion, as described above, and acoustic stimuli were 100 ms BBN bursts. Trigeminal stimuli preceded the noise bursts by 5 ms. To test for bimodal enhancement or suppression, the formula developed by Populin & Yin (2002) was adapted as follows:
where BE is the percentage value of bimodal enhancement, Bi is the bimodal response, T is the trigeminal response and A is the auditory response expressed as number of spikes computed over a 100 ms window beginning at the onset of auditory stimulation.
The percentage bimodal suppression (BS) was calculated as follows:
where Bi is the bimodal response and Unimax is the larger of the unimodal responses. Bimodal suppression occurs when BS < 0.
Noise stimulation was used in this study because the majority of units recorded on 16 channels responded to the noise regardless of their BFs. Thus, it was possible to assess the responses of a large number of neurons to both trigeminal and sound stimulation.
Auditory brainstem responses
Auditory brainstem responses were recorded in a separate electrically and acoustically shielded chamber routinely used for ABR recordings (Acoustic Systems, Austin, TX, USA). Animals were anesthetized with ketamine (58.8 mg/kg), xylazine (2.4 mg/kg) and acepromazine (1.2 mg/kg), and body temperature was maintained with heating pads and heat lamps. Sub-dermal recording electrodes were placed at vertex (1 cm posterior to bregma), reference (ventral to the pinna on the tested ear) and ground (ventral to the pinna on the contralateral ear) sites. System II hardware and SigGen/Biosig software (Tucker Davis Technologies, Alachua, FL, USA) were used to present the stimulus and record responses. Tones were delivered through a Beyer driver (Beyer Dynamic Inc., Farmingdale, NY, USA; aluminum-shielded enclosure made in house) with the speculum placed just inside the tragus. Toneburst stimuli were 15 ms in duration with 1 ms rise/fall times, presented at 10/s. The upper limit of the ABR sound system was 100 dB SPL. Up to 1024 responses were averaged for each stimulus level. Responses were collected for stimulus levels in 10 dB steps at higher stimulus levels, with additional 5 dB steps near threshold. Thresholds were interpolated between the lowest stimulus level where a response was observed and 5 dB lower, where no response was observed. Baseline and final (1 day prior to the acute experiment) ABRs were tested at 4, 10 and 20 kHz.
Sound exposure
Animals were placed in a ventilated chamber with the inner walls covered with 5 cm acoustic foam. The noise was presented through a loudspeaker (Parasound HCA-750A amplifier, JBL 2450H compression driver with 2385A horn) mounted on the top of the chamber. For calibration, the system response (62.5 Hz–22 kHz) to a white noise source (General Radio 1381) was measured with a ½inch microphone (Bruel and Kjaer 4134) and fast Fourier transforms spectrum analyser (Stanford Research SR760). The spectrum data were used to create an equalizing fast Fourier transform filter in an audio file editor (Adobe Audition), which was then used to create an audio CD for the noise used in this study (2–20 kHz). The system response to the audio CD was then verified with a fast Fourier transform spectrum analyser. The animals were exposed in individual wire cages. The level and spectrum of the noise were measured within the cage using a Bruel and Kjaer sound level meter (model 2231, with type 4155 ½ inch microphone and type 1625 octave band filter). Animals were exposed at 120 dB SPL for 4 h.
Brain histology
To mark electrode tracks, the recording and stimulating electrodes were dipped in 1,1-dioctadecyl-3,3,3′,3′- tetramethyllindocarbocyanine perchlorate (10%) (Molecular Probes) or fluorgold (2%) before being inserted into the brain. At the end of each experiment, the animal was perfused transcardially with saline followed by 4% paraformaldehyde. The brain and left trigeminal ganglion were removed from the skull and immersed in 20% sucrose solution (Shore et al., 1992; Shore & Moore, 1998). The following day, the brain and trigeminal ganglion were cryosectioned at 40–60 µm, placed on slides and examined under epifluorescence for evidence of recording and stimulating electrode locations. The locations of the stimulating electrode within the trigeminal ganglion varied from 440 to 1080 µm in depth from the surface and were most often in the ophthalmic division, although they were occasionally at the medial edge of the mandibular division (Fig. 1). These locations are close to the locations of cells labeled by retrograde injections into the CN (Shore et al., 2000).
Cochlear hair cell assessments
Following the unit recordings, animals were perfused intracardially, as described above. The temporal bones were removed, the round and oval windows exposed, and the cochleae were fixed by intrascalar infusion of 4% paraformaldehyde in phosphate-buffered saline through the round window. Following fixation, cochleae were micro-dissected and stained with 1% rhodamine phalloidin. Surface preparations of the cochlear spiral were prepared and individual turns of the organ of Corti were mounted on glass slides.
Surface preparation assessment was performed under epifluorescent illumination on a Leitz photomicroscope. Surviving hair cells were counted in 0.19 mm reticules and plotted as cytocochleograms (percentage of inner and outer hair cell loss, relative to normal hearing ears) using a Microsoft Excel® program kindly provided by Dr David Moody (University of Michigan). Raw data for each row of inner and outer hair cells were collected and assessed individually. In addition, data for the three rows of outer hair cells were collapsed together and analysed as a group.
Statistical procedures
Data files generated during the experiments were imported to Excel spreadsheets and assessed for integrity and distributional characteristics. Descriptive statistics and graphical depictions were used to determine if the data met the assumptions of the inferential statistical procedures employed. Any violation of the assumptions underlying the inferential procedures was assessed for robustness and appropriate measures (Bonferroni corrections) were taken to ensure that experiment-wise type I error rates did not exceed the stated alpha level. Statistical procedures were implemented with SPSS 13.0 (SPSS Inc. Chicago, IL, USA). anovas were used to determine significance of differences between the experimental groups and conditions. χ2 tests were used to determine significance of differences in distributions of esponse types.
Results
Effects of noise exposure on auditory brainstem response and unit thresholds
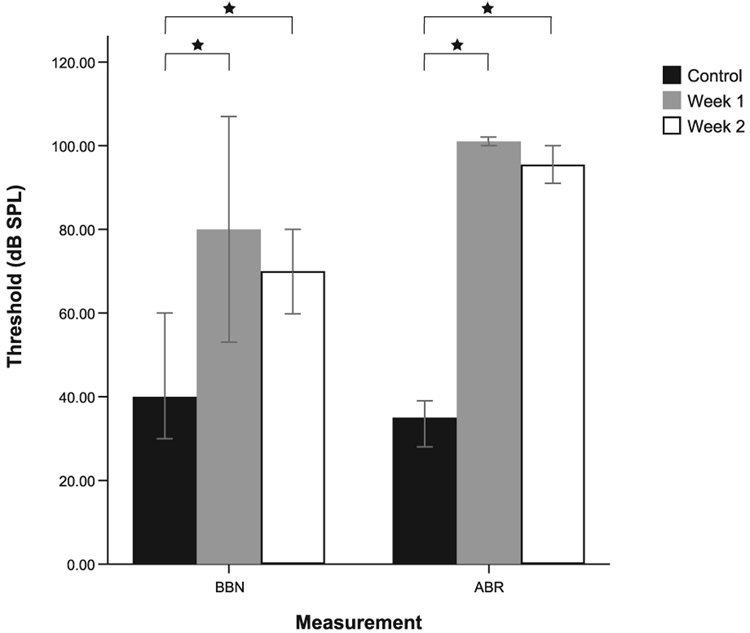
Wideband noise exposure at 120 dB SPL produced significant ABR threshold shifts (averaged responses for 4, 10 and 20 kHz) of 60 dB or greater (P < 0.001) at 1 week (N = 6) and 2 weeks (N = 6) after the exposure (normal N = 6). Significant threshold shifts relative to normal controls (N = 345) were also detected for unit responses to BBN in DCN units and were smaller in magnitude than the ABR shifts (up to 40 dB) for 1 week (P < 0.001, N = 105) and 2 weeks (P < 0.001, N = 106), respectively (Fig. 3). Median values are shown for ABR and BBN thresholds as there were some units unresponsive at 80 and 100 dB SPL (the maximum output of the speakers for unit or ABR recordings, respectively) after noise exposure. Values of 90 and 101 dB were assigned to the non-responsive units, ranks were established and Mann–Whitney tests of significance were performed. The threshold shifts were evenly distributed across BFs and along the depth of the electrode, as might be expected with a wideband noise exposure. The cytocochleograms (not shown) indicated severe outer hair cell damage at the basal end of the cochlea, with moderate loss in the middle regions of the cochlea. Inner hair cell damage was confined to the basal third of the cochlea.
FIG. 3.
Median auditory brainstem responses (ABRs) and dorsal cochlear nucleus unit thresholds to broadband noise (BBN) stimulation for normal and noise-damaged animals at 1 and 2 weeks following BBN (4 h, 120 dB SPL) exposure. Error bars represent 95% confidence limits. Large, significant threshold shifts are observed for BBN unit responses and ABRs following noise exposure (*, see details in text). Maximum measurable ABR thresholds were 100 dB and maximum measurable BBN thresholds were 80 dB SPL.
Effects of noise exposure on dorsal cochlear nucleus spontaneous rates
Spontaneous rates are increased in DCN units after noise damage
Spontaneous rates were computed in DCN units (up to a depth of 0.5 mm below the surface) from 200 trials in which no sounds were presented. Figure 4A shows the mean SRs for normal (N = 66) and noise-damaged animals at 1 week (N = 76) and 2 weeks (N = 51) after noise exposure at 120 dB SPL. The SR was significantly higher than normal at 1 week following noise damage (P < 0.05). At 2 weeks post-noise damage SR was still increased but was no longer significantly different from control. The frequency distribution of SRs (Fig. 4B) indicates that the increased SR at 1 week post-exposure was primarily due to an increase in the number of medium SR units, suggesting a selective increase in a specific group of neurons. Elimination of units with SRs above 125 did not alter the findings. Further grouping of units by responses to trigeminal stimulation (Fig. 4C) revealed that the increased SRs were detected only in units that responded with excitation (E and E/In) to trigeminal stimulation. Furthermore, the units showing the greatest increase in SR were those that responded with E/In to trigeminal stimulation (P < 0.05). Units that showed no response or were inhibited by trigeminal stimulation did not show increased SR following noise damage.
FIG. 4.
(A) Mean spontaneous rates (SRs) for dorsal cochlear nucleus single units at 1 and 2 weeks after noise exposure at 120 dB SPL. SR is significantly higher at 1 week following exposure (Bonferroni-adjusted comparison; *P < 0.05). (B) Frequency distribution plots indicate that the increased SR is accounted for mostly by an increase in the number of medium SR values. (C) The distribution of SRs by responses to trigeminal stimulation indicates that only units that are activated by trigeminal stimulation (those that display excitatory and excitatory/inhibitory responses) showed increased SRs after noise exposure. Units that were inhibited by trigeminal stimulation and units that did not respond to trigeminal stimulation did not show increased SR after noise damage.
Effects of noise exposure on dorsal cochlear nucleus unit acoustic response types
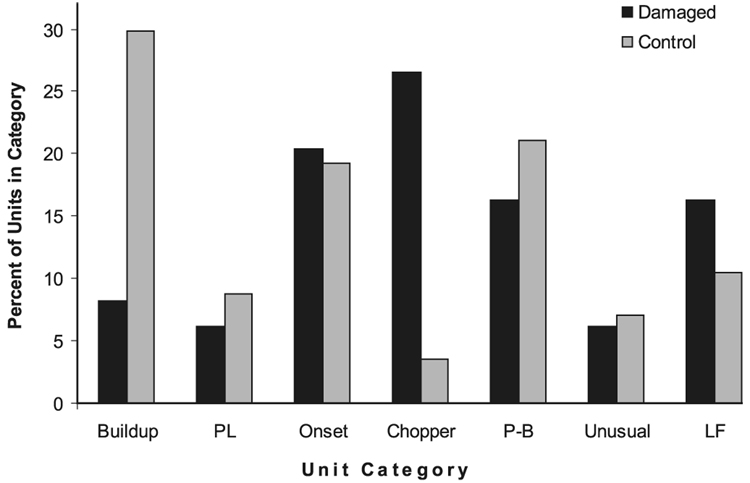
In the noise-damaged animals, we were able to classify 49 units that responded to BF tones and BBN of 10 or 20 dB above threshold. All response types that were observed in the normal animals (N = 57) were also observed in the noise-damaged animals (Fig. 5). However, the proportion of units in each response type changed significantly after noise damage. Specifically, noise-damaged animals exhibited a greater number of chopper units and fewer build-up units than normal animals (χ2 = 84, 6 d.f., P < 0.001).
FIG. 5.
The percentage of single units in each unit-type category as defined by responses to 20 dB SL, best frequency tonebursts [i.e. build-up, primary like (PL), onset, chopper, pauser-build-up (P-B), unusual and low frequency (LF)] for control (N = 57) and noise-damaged (N = 49) animals. Noise-damaged animals include 1 and 2 weeks post-damage combined. All ‘unit types’ observed in the normal animals are also observed in the noise-damaged animals. However, the proportion of chopper units was significantly increased, whereas the proportion of build-up units was significantly decreased in the noise-damaged animals (χ2 = 84, 6 d.f., P < 0.001).
Effects of noise exposure on dorsal cochlear nucleus unit responses to trigeminal stimulation
Trigeminal stimulation evoked more inhibition and less excitation after noise damage
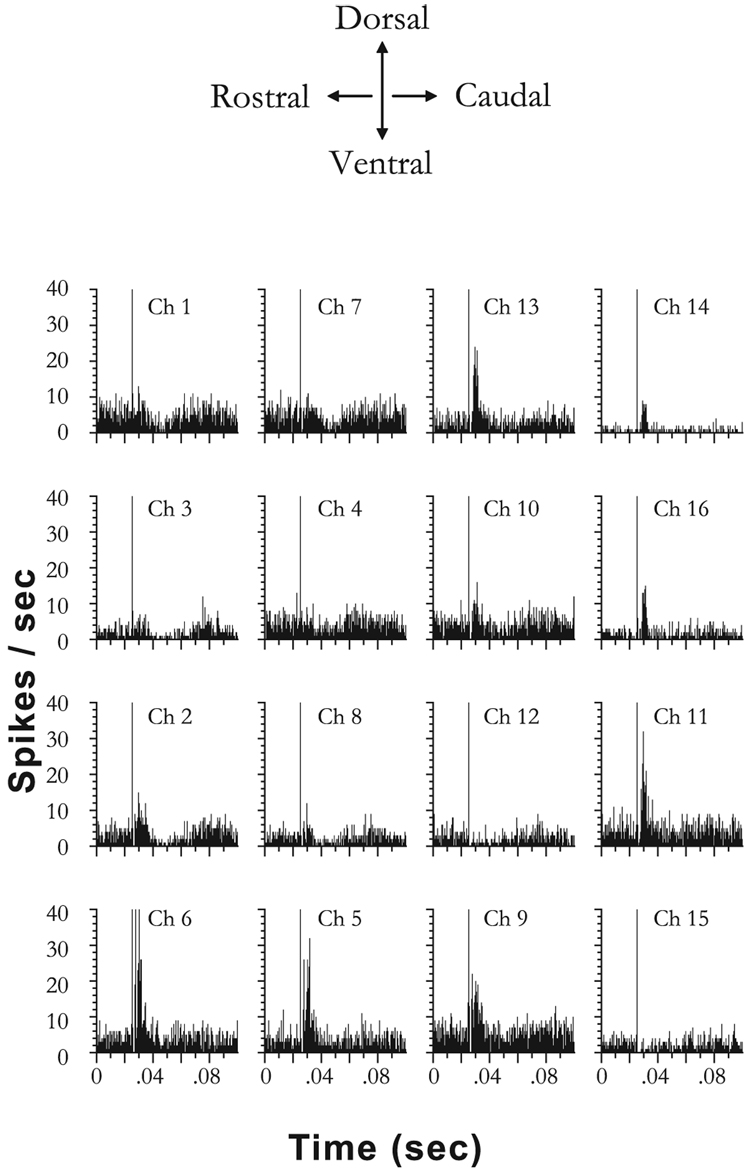
Figure 6 shows post-stimulus time histograms of unit responses recorded from 16 channels in one noise-exposed (2 week) animal after trigeminal ganglion stimulation (80 µA, 100 µs/phase, 200 presentations), before unit sorting. The channels are delineated as ‘Ch 1–Ch 16’, indicating the location of each channel according to the electrode geometry shown in Fig. 2. In contrast to normal animals, in which about 30% of channels were affected, inhibitory or excitatory responses to trigeminal stimulation were observed on every channel in this animal.
FIG. 6.
Post-stimulus time histograms of unit responses to trigeminal stimulation from 16 channels recorded on a four-shank electrode in the dorsal cochlear nucleus. Responses are from a noise-damaged animal at 1 week after noise exposure. The electrical artifact (the first large peak in the histogram) indicates the onset of the electrical stimulus in the trigeminal ganglion at 80 µA. Unsorted multiunit responses are shown here. Bin width 0.5 ms, 200 presentations. Examples of inhibitory and excitatory responses to trigeminal stimulation can be found across the 16 channels in this animal.
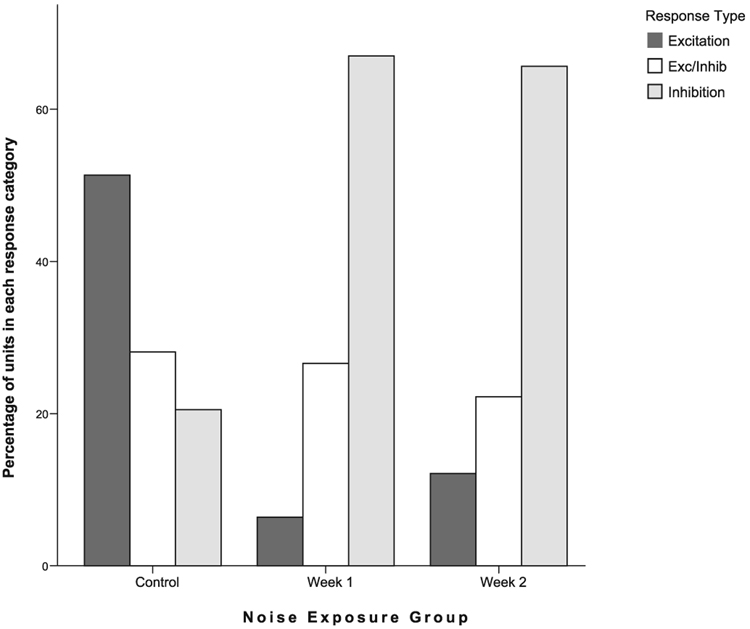
Trigeminal ganglion stimulation produced the same types of single unit responses for noise-exposed (N = 188, week 1; N = 99, week 2) and normal (N = 185) animals, as shown previously, i.e. In, E and E/In responses in DCN neurons (Shore, 2005). This is shown in Fig. 7 for sorted, single units. Although all three types were evident, the distribution of response types amongst single units was significantly changed after noise damage (Fig. 8). In the normal animals, the most frequently occurring response type was excitation (E) and the least frequent type was inhibition (In). However, in the noise-exposed animals, inhibition (In) became the predominant response type to trigeminal stimulation at both 1 week (P < 0.001) and 2 weeks (P < 0.001) following noise exposure.
FIG. 7.
Examples of inhibitory (In), excitatory (E) and excitatory/inhibitory (E/In) responses from dorsal cochlear nucleus single units in a noise-damaged guinea pig. The post-stimulus time histograms show responses of three single units, sorted using the Plexon off-line sorter (see Materials and methods). The top unit is inhibited (In), the middle unit is excited (E) and the lower unit is excited and then inhibited (E/In) by trigeminal ganglion stimulation at 80 µA. Although the three response types were the same as described in normal animals (Shore, 2005), the distribution of responses is changed in noise-damaged animals, with marked increased incidence of units in the In category (see Fig. 8). Arrow shows onset of trigeminal ganglion stimulation. Bin width 1 ms, 200 presentations.
FIG. 8.
Responses to trigeminal stimulation are redistributed at 1 and 2 weeks after noise overexposure. The percentage of single units with excitatory, inhibitory or excitatory/inhibitory responses after trigeminal ganglion stimulation at 80 µA is shown. Following noise exposure inhibitory responses predominate, whereas the normal animals show more excitatory than inhibitory responses. The increased incidence of inhibition by trigeminal stimulation in noise-damaged animals may signify a change in the distribution of trigeminal inputs to the cochlear nucleus granule cells following cochlear damage.
Thresholds to trigeminal stimulation are reduced after noise exposure
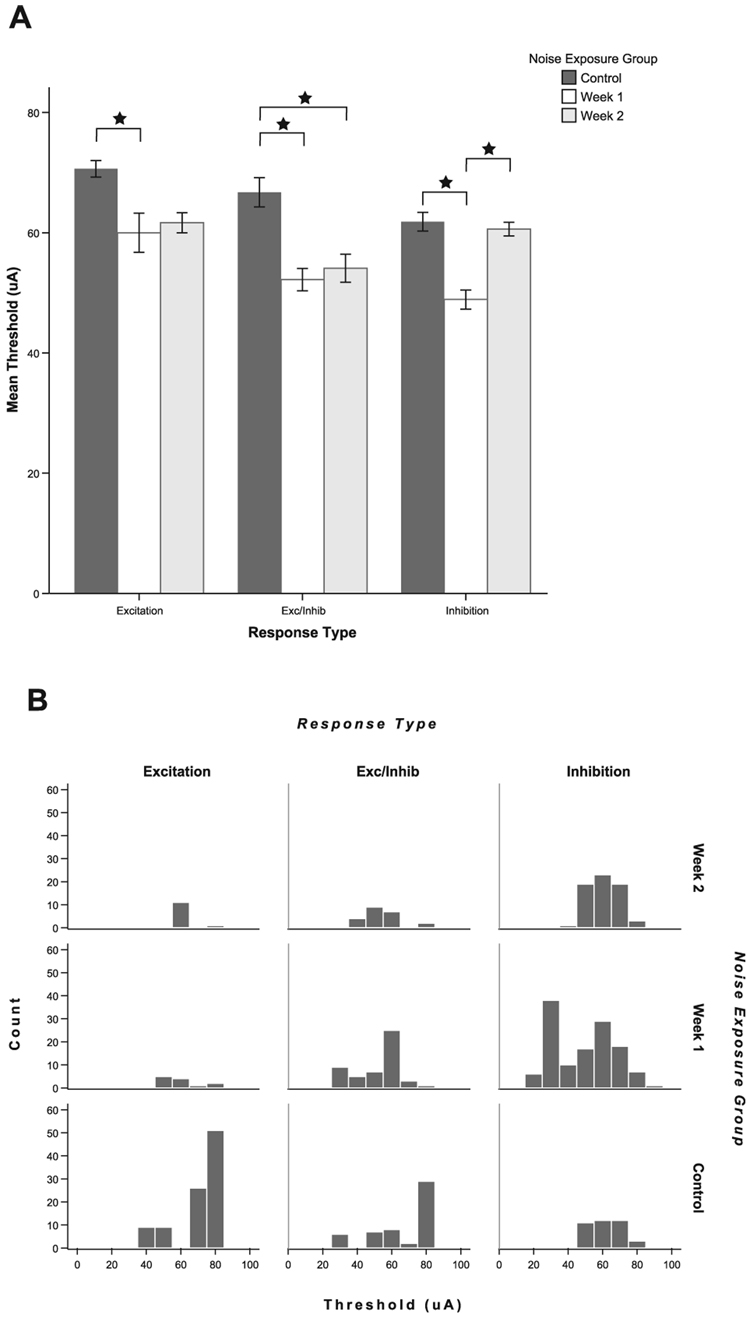
The thresholds for each response type were significantly lower in noise-exposed animals. Figure 9A shows the mean thresholds for single unit responses to trigeminal stimulation for each group. At 1 week following exposure, thresholds for all response types were significantly lower (E, P = 0.021; E/In, P < 0.001; In, P < 0.001). At 2 weeks following exposure, thresholds were significantly lower for the E/In responses (E/In, P = 0.003). The E responses showed the same trends but did not reach significance due to the smaller number of E responses (P = 0.067). The mean threshold differences could be up to 15 µA lower than normal controls. The frequency distribution plots (Fig. 9B) indicate, especially for the In responses at 1 week, that thresholds are lower because of the appearance of a low threshold group, suggesting either activation of a different set of neurons by trigeminal stimulation or increased sensitivity to trigeminal stimulation within a sub-population of CN units after noise exposure. In contrast, the control group shows a peak in the high threshold neurons for E and E/In units.
FIG. 9.
Thresholds to trigeminal stimulation are significantly decreased following noise damage, reflecting increased sensitivity to trigeminal stimulation in the deafened animals. (A) Mean thresholds to trigeminal stimulation are decreased at both 1 and 2 weeks after noise exposure. At 1 week following noise exposure, thresholds are significantly lower for all response types [excitatory (E), excitatory/inhibitory (E/In) and inhibitory (In)]; at 2 weeks, thresholds for E and E/In units are significantly lower but In response thresholds have returned to normal. *Significant pair-wise differences after Bonferroni correction (see text). Error bars indicate ± 1 SEM. (B) The frequency distribution plots indicate a sharp peak in the number of low threshold In units at 1 week following noise damage and a reduction in the number of high threshold units for the E and E/In groups after noise damage.
Latencies of excitation and complex responses are altered after noise exposure
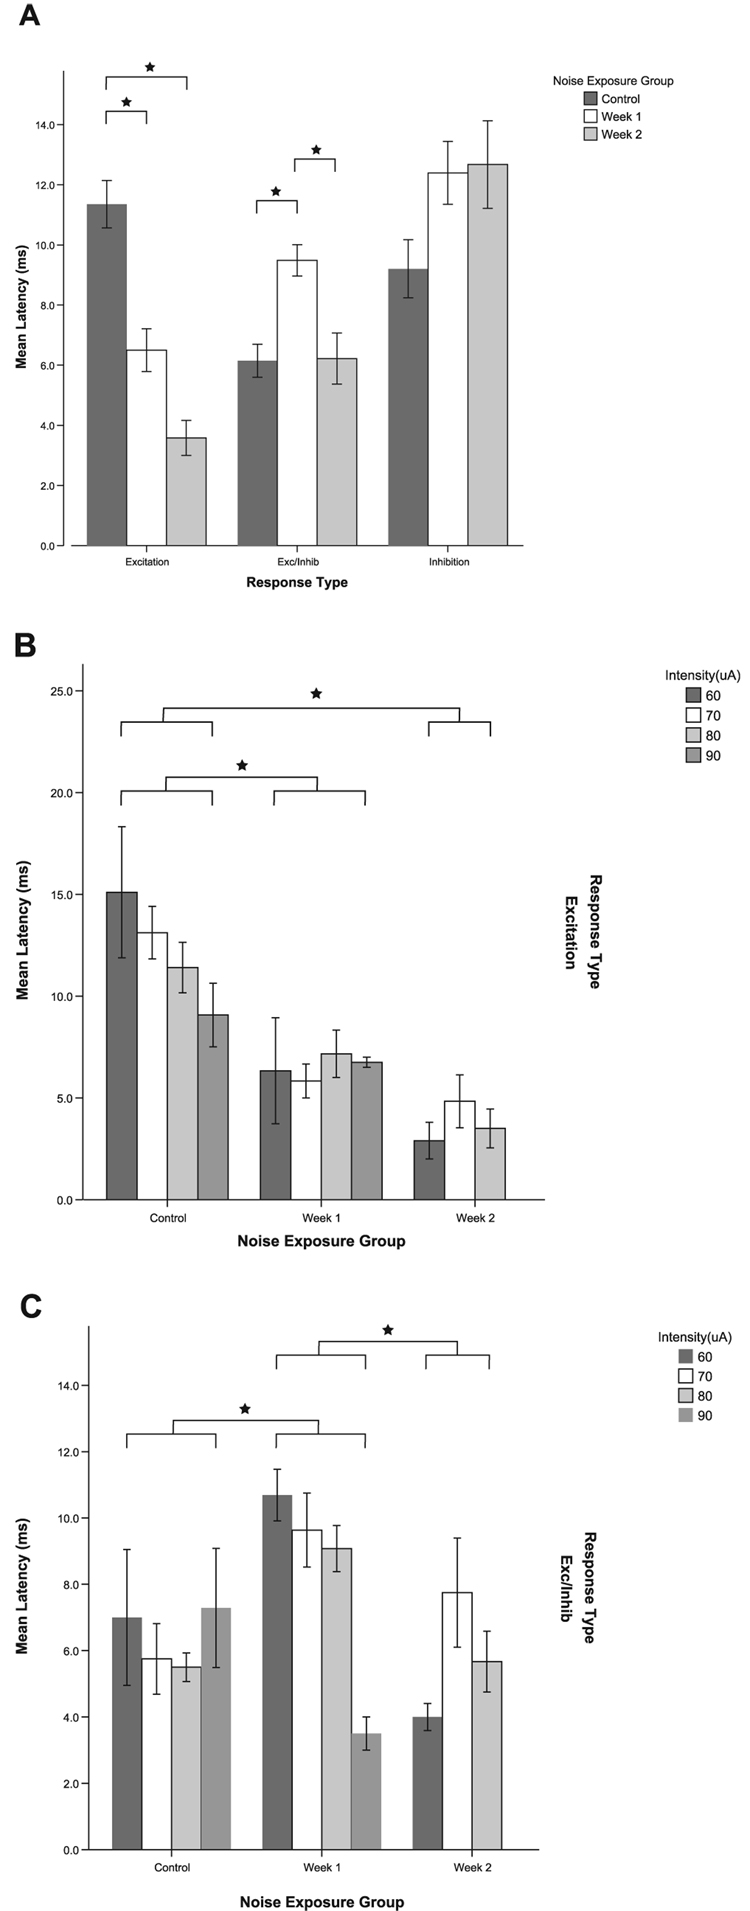
Although there was a lower incidence of E responses in the noise-damaged animals, response latencies for E responses to trigeminal stimulation were significantly shorter at 1 week (P = 0.047) and 2 weeks (P < 0.001) post-noise damage compared with normal (Fig. 10A). Figure 10B shows that the shorter latencies for E responses were evident at all current levels for both weeks post-noise exposure. In contrast, significantly longer latencies were seen for E/In responses at 1 week after noise damage (P < 0.001, Fig. 10A and C). There were no significant differences in latencies between control and noise-damaged animals for the In response type.
FIG. 10.
Response latencies for excitation (E) to trigeminal stimulation are significantly decreased at 1 and 2 weeks following noise damage. However, excitatory/inhibitory (E/In) response latencies are significantly increased at 1 week following noise damage. An increase in latencies is seen for inhibitory units but this does not reach significance. (A) Mean latencies for all response types for all stimulus levels combined. (B) Mean latencies for E responses at individual current levels. The decrease in latency is apparent at all current levels for both 1 and 2 weeks following noise damage. (C) Mean latencies for E/In responses at individual current levels. *Significant pair-wise differences after Bonferroni correction (see text). Error bars indicate ± 1 SEM.
Inhibitory response durations are decreased and amplitudes increased after noise damage
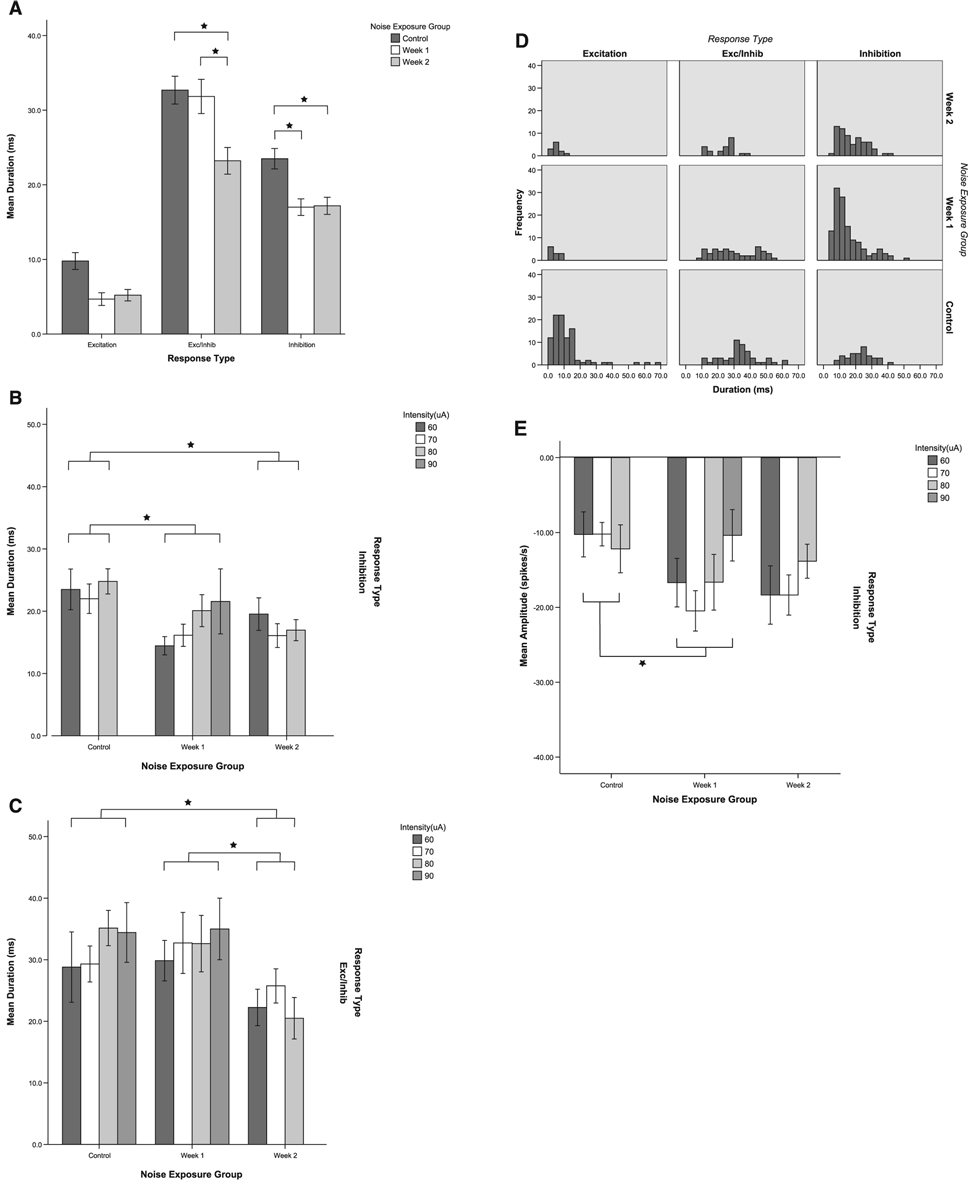
For the In type, the response durations were significantly shorter (Fig. 11A and B) at both 1 week (P = 0.002) and 2 weeks (P < 0.01) following noise damage and the amplitudes were larger at 1 week after noise damage (P < 0.05; Fig. 11E). The E/In durations were also significantly shorter at 2 weeks post-exposure (P < 0.05; Fig. 11A and C). The frequency plots show that the decreased duration is due to an increased frequency of occurrence of shorter duration In responses rather than a change in the entire distribution of durations (Fig. 11D). For the E/In responses, the decreased duration at 2 weeks is due to a loss of longer duration responses.
FIG. 11.
(A–D) Response durations to trigeminal stimulation. (A) Response durations from units in normal and noise-exposed animals are shown as mean bar graphs for all current levels combined. Inhibitory (In) and excitatory/inhibitory (E/In) response durations to trigeminal stimulation are significantly decreased following noise damage. The same trend is seen for excitatory responses. (B) Responses for In units from normal and noise-exposed animals are shown for individual current levels. The decreased duration is apparent across current levels at both 1 and 2 weeks after noise damage. (C) E/In responses from normal and noise-exposed animals are shown for individual current levels. The decreased duration is apparent for all current levels at 2 weeks after noise damage. (D) Frequency distribution plots show a large peak in the occurrence of short duration In responses and a loss of long duration E/In responses. (E) The In-response amplitudes to trigeminal stimulation are significantly increased following noise damage. Responses from units in normal and noise-exposed animals are shown as negative values for all current levels combined (relative to SR). *Significant differences (see text). Error bars indicate ± 1 SEM.
Both the increase in incidence of inhibitory type responses (see Fig. 8) and larger inhibitory amplitudes are consistent with the enhancement of suppressive multisensory integration and the absence of positive integration (i.e. enhancing integration; see below) at 2 weeks after noise damage.
Bimodal integration is enhanced following noise damage
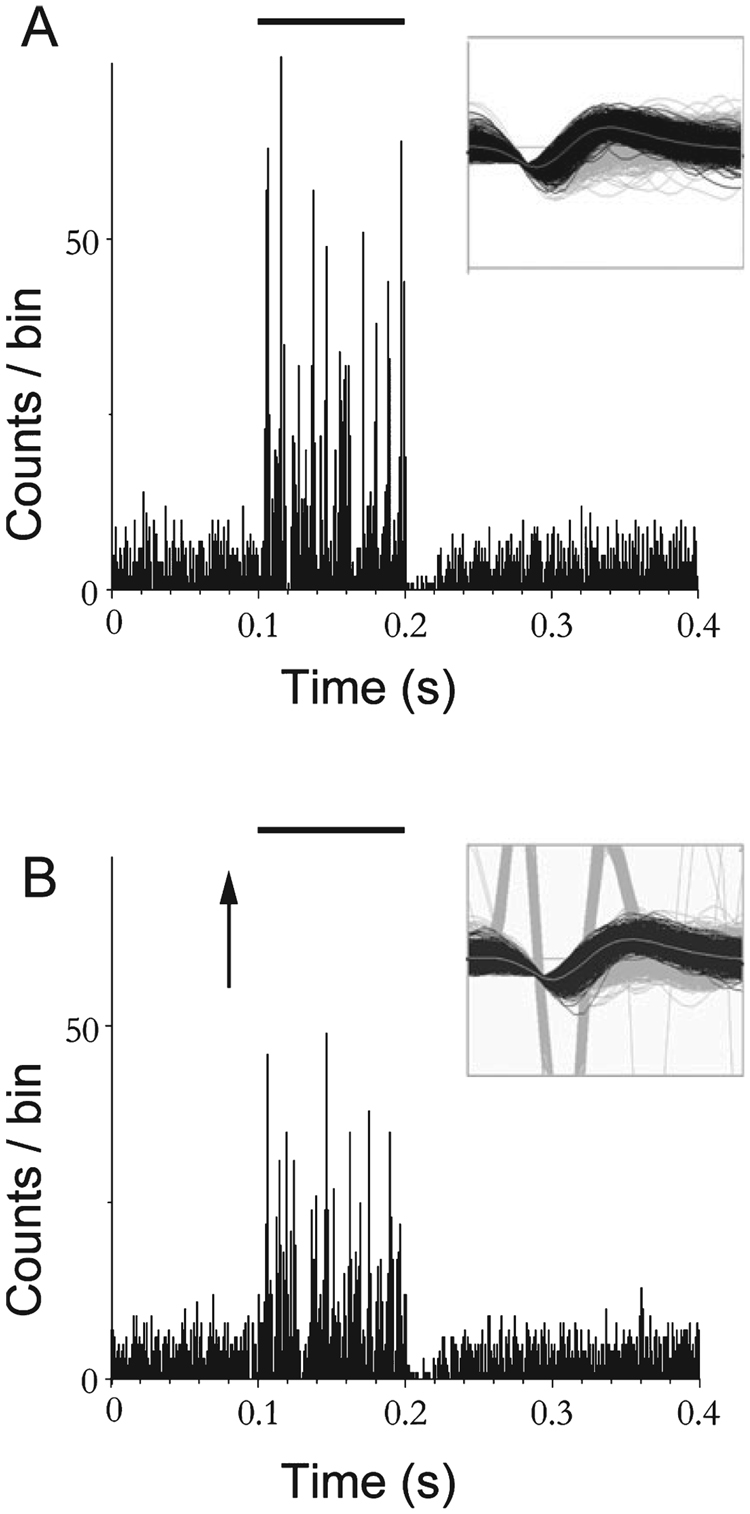
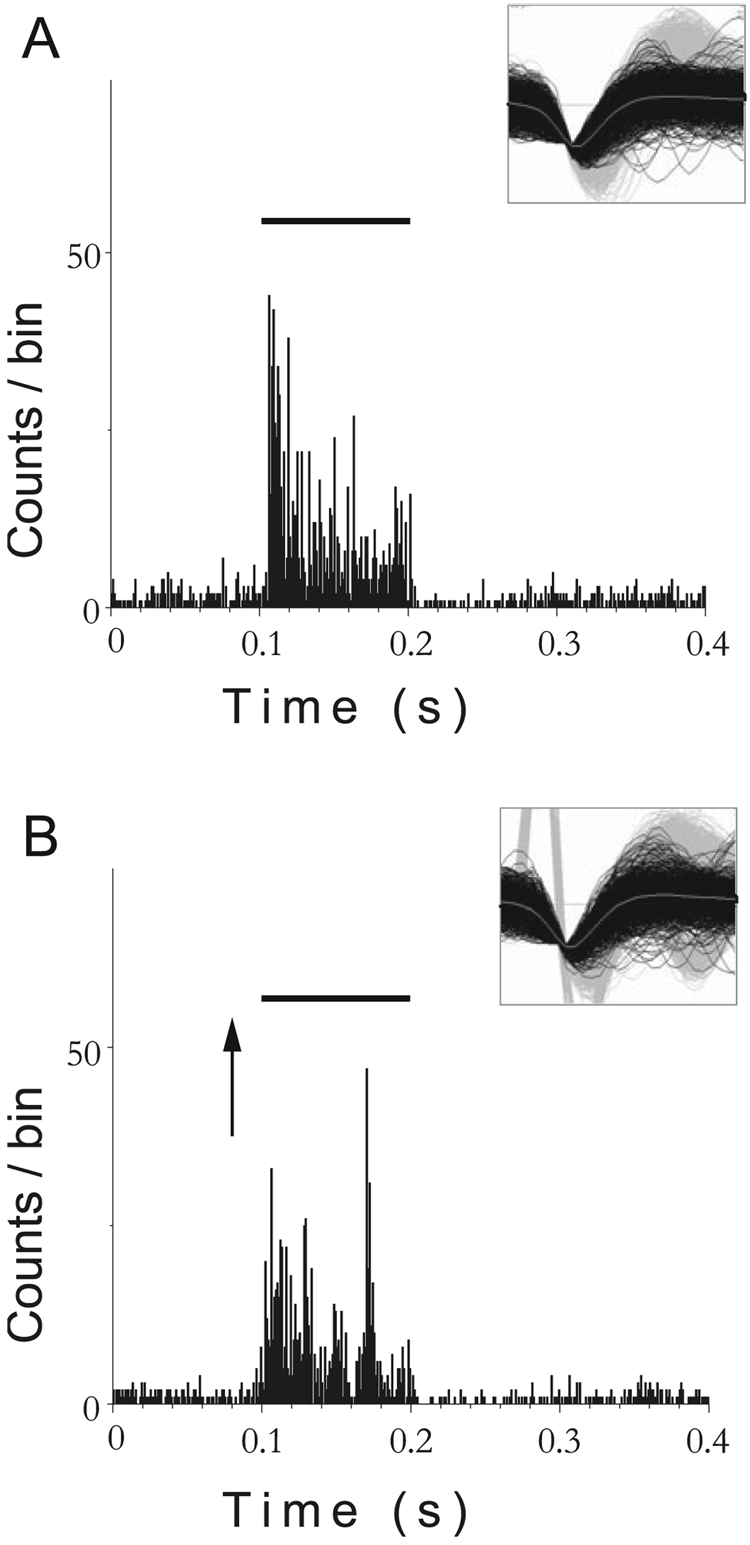
In normal animals, neurons in the DCN integrate information from the trigeminal nerve and VIIIth nerve (Shore, 2005). This is reflected in the difference in response rates to uni- and bimodal (i.e. trigeminal + auditory) stimulation (see Materials and methods for quantification). Bimodal integration is also evident in noise-damaged animals. Figure 12 shows an example of responses from one single unit in a noise-damaged animal at 1 week following exposure. Responses to BBN alone (Fig. 12A) can be compared with the responses from the same unit to the same BBN but preceded by a pulse applied to the trigeminal ganglion (Fig. 12B). The addition of the trigeminal pulse produced strong suppression of the response to the BBN that lasted for the duration of the sound. For comparison, Fig. 13 shows bimodal suppression in one unit recorded from a normal animal. Although some units in normal animals showed enhanced responses to BBN after the addition of a trigeminal pulse (see Shore, 2005), both normal and noise-damaged animals showed predominantly suppressive integration of the type shown in Fig 12 and Fig 13. In the 2 week noise-damaged animals, the preponderance for suppressive integration was significantly enhanced (75% compared with 49% in normal and 47% in week 1 noise-damaged animals; Fig. 14). This is reflected by both the increased percentage of units showing suppression (P < 0.05) and a greater degree of suppression in the 2 week noise-damaged animals (P < 0.001). Furthermore, in normal animals, suppression or enhancement of responses by trigeminal stimulation differed depending on whether measurements were taken during the first or second half of the responses to BBN. This suggests that integration changed over time in the normal animals but remained more constant over time for the noise-damaged animals.
FIG. 12.
Bimodal integration in a dorsal cochlear nucleus unit is suppressive in a noise-damaged animal at 1 week following exposure. (A) Post-stimulus time histogram (PSTH) for a single unit in response to broadband noise (BBN) stimulus alone. (B) PSTH for the same single unit in response to BBN preceded by trigeminal ganglion stimulation. The response to combined trigeminal and acoustic stimulation is smaller than the response to sound stimulation alone, indicating suppressive bimodal integration. Solid line indicates onset and duration of BBN; arrow indicates onset of trigeminal stimulus. Bin width 1 ms. BBN level, 80 dB SPL (30 dB SL); current, 80 µA. Trigeminal stimulus precedes BBN by 5 ms. Insets show single unit waveforms obtained with the Plexon offline sorter (principal component analysis).
FIG. 13.
Bimodal suppression in a single unit from a normal animal. (A) Responses of a single unit to broadband noise (BBN) alone. (B) Responses of the same single unit to BBN preceded by trigeminal ganglion stimulation. As for the noise-damaged animal (Fig. 12), the response to combined trigeminal and acoustic stimulation is smaller than the response to sound stimulation alone, indicating suppressive bimodal integration. BBN level, 50 dB SPL (30 dB SL); current, 80 µA. Trigeminal stimulus precedes BBN by 5 ms. Solid bar above graphs shows the onset and duration of the BBN; arrow indicates onset of the bipolar trigeminal pulse (100 µs/phase). Bin width, 1 ms. Insets show single unit waveforms (as for Fig. 12).
FIG. 14.
Noise-damaged animals show a greater incidence and greater magnitude of suppressive bimodal integration than normal animals. (A) Percentage of single units demonstrating bimodal integration (suppression and enhancement). Units showing enhancement of broadband noise (BBN) responses when preceded (by 5 ms) by trigeminal stimulation are shown on the left. Units showing suppression of BBN responses when preceded by trigeminal stimulation are shown on the right. (B) Degree of integration expressed as percentage integration (see Materials and methods). Arrow indicates complete absence of enhancing integration. *Significance (see text).
Discussion
In this study, noise exposure sufficient to produce cochlear damage resulted in an enhanced sensitivity of neurons responding to trigeminal stimulation as well as a redistribution of the types of responses elicited (i.e. excitation or inhibition). Furthermore, noise exposure also resulted in increased SRs but only in those neurons that were activated by somatosensory stimulation.
Sensitivity of dorsal cochlear nucleus units to trigeminal input increases following a reduction in auditory nerve input
Reduction in auditory nerve input to the DCN after noise damage in the present study changed the responsiveness of DCN neurons to trigeminal stimulation. In noise-exposed animals there was a significant shift in the distribution of inhibitory and excitatory responses towards more inhibitory type responses. Large, significant decreases in thresholds were evident as well as changes in the latency and duration of response. Consistent with the increased incidence and amplitudes of inhibitory type responses to trigeminal stimulation alone, there was an increase in the number of units exhibiting bimodal suppression and a greater degree of bimodal suppression in single units in noise-damaged animals.
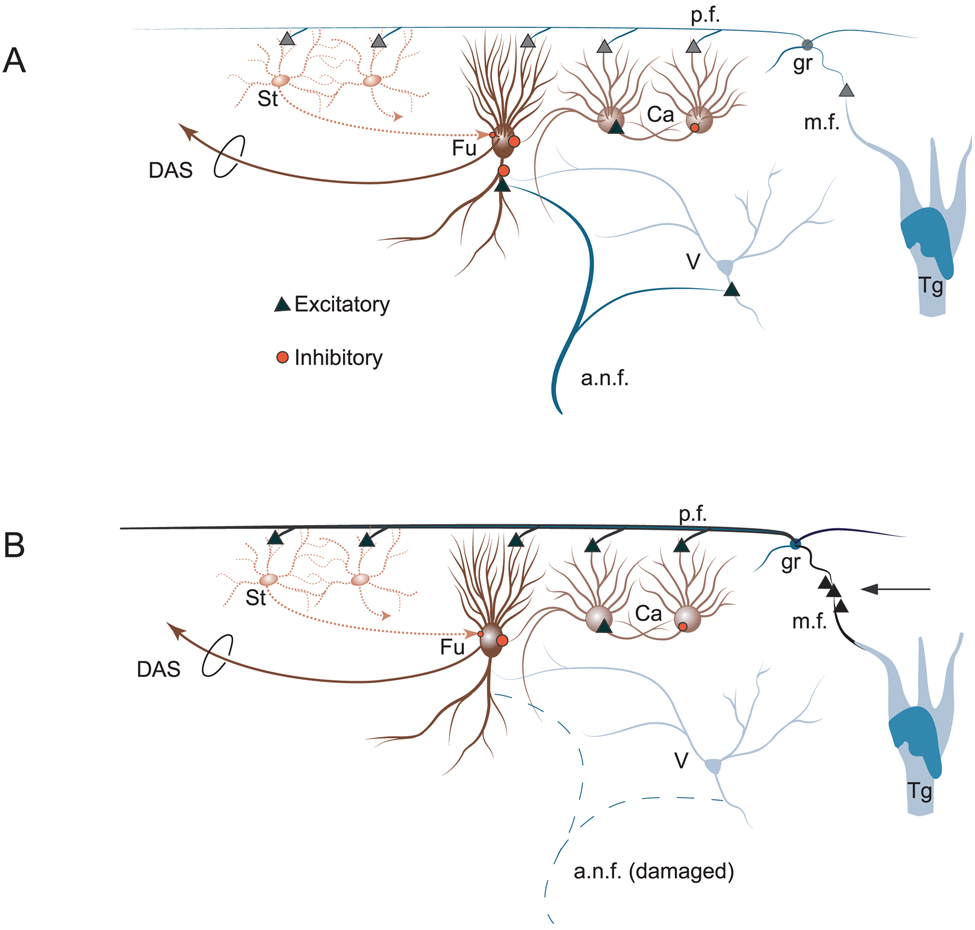
The altered sensitivity of DCN neurons to trigeminal ganglion stimulation following cochlear damage may be a result of a reactive alteration in the balance of excitation and inhibition in DCN neurons. Figure 15 is a schematic of the putative DCN circuitry involved in bimodal integration, for normal (Fig. 15A) and noise-damaged (Fig. 15B) animals. At the simplest level, the reduction in auditory nerve input to the basal dendrites of fusiform cells (Fig. 15B) would shift the dominant excitation of these cells to their apical dendrites and somata, which receive non-auditory glutamatergic inputs via CN granule cells (Zhou et al., 2007). This dominance might be further enhanced by an increase in the number of glutamatergic terminal endings from the somatosensory pathways to the granule region of the CN (Zhou & Shore, 2006a; Shore et al., 2007). Consistent with this view are recent descriptions of the re-emergence of glutamatergic synaptic transmission at 7 and 14 days following noise exposure (Muly et al., 2004; Shore et al., 2007) and the appearance of the growth-associated protein GAP-43 in the CN as early as 9 days post-trauma (Michler & Illing, 2002). The presence of GAP-43 indicates that these cells have altered their morphology and connectivity (Kruger et al., 1993), and may be involved in the activity-dependent regulation of axonal growth (Cantallops & Routtenberg, 1999), indicating the presence of neural plasticity. Other studies have demonstrated the emergence of thin axons, terminal endings and perisomatic boutons in the CN after noise trauma in the chinchilla, consistent with a reactive growth of new axons of relatively small diameter (Bilak et al., 1997). These thin axons may arise from the trigeminal ganglion or trigeminal nucleus, which send comparably thin axons to the CN (Shore et al., 2000; Zhou & Shore, 2004). It is also possible that, together with these synaptic changes, the intrinsic membrane properties are adjusted to a more excitable state, as demonstrated for neurons in the ventral CN after cochlear removal (Francis & Manis, 2000). In support of the latter is the increased incidence of chopper type units and decreased incidence of build-up type units in the present study following noise damage, given that response type in fusiform cells is largely determined by their intrinsic membrane properties (Manis, 1990; Kanold & Manis, 1999).
FIG. 15.
Schematic of dorsal cochlear nucleus circuitry putatively involved in bimodal integration in normal and noise-damaged animals (after Shore, 2005). (A) Normal system. Trigeminal ganglion (Tg) stimulation excites cochlear nucleus granule cells (gr), which, in turn, excite stellate (St), cartwheel (Ca) and fusiform (Fu) or giant (not shown) cells. Ca cells excite each other and inhibit Fu cells. Broadband noise (BBN) stimulation via auditory nerve (a.n.f.) strongly excites Fu cells and weakly activates Ca cells. Suppression of responses to BBN is achieved by summation of weak Ca responses to BBN and stronger and long-lasting Ca activation by trigeminal input, leading to inhibition of Fu cell. Facilitation of BBN responses can occur through long-term potentiation of direct gr activation of Fu cells. Additionally, Tg stimulation may excite onset units in ventral cochlear nucleus (D-multipolar cells), which can inhibit vertical (V) and Fu cells (Shore et al., 2003). (B) Noise-damaged system. a.n.f. input to basal dendrites of Fu cells is weakened. Noise damage leads to an increase in the number of vesicular glutamate transporters in mossy fibers (m.f.s) as well as axonal sprouting from the trigeminal system (arrow pointing to additional triangles at m.f.) (Zhou & Shore, 2006b), resulting in stronger responses to trigeminal stimulation. Bimodal integration is more suppressive due to enhanced inhibitory Ca cell activity demonstrated after noise damage (Chang et al., 2002). DAS, dorsal acoustic stria; p.f., parallel fibers.
The increase in inhibitory type responses to trigeminal stimulation after noise damage could be due to a redistribution of somatosensory fibers in the CN granule cell region, so that more inhibitory interneurons, such as the cartwheel or superficial stellate cells, are targeted (Fig. 15B). The distribution plots of threshold, latency and durations shown here do in fact suggest that different groups of neurons may be activated after noise damage. The increased inhibitory responses suggest that new inputs may target CN granule cells that project to inhibitory interneurons, such as stellate or cartwheel cells. In line with this interpretation are results suggesting that intense tone exposure leads to increased activity of DCN cartwheel cells (Chang et al., 2002).
Of particular significance in the present study is the finding that bimodal integration (Shore, 2005) is enhanced in noise-damaged animals. This enhancement was observed only for the suppressive type of integration that has previously been linked to the suppression of body-generated sounds such as respiration or vocalization (Montgomery & Bodznick, 1994; Shore, 2005). A possible mechanism for the bimodal suppression could be modification of the potassium current in fusiform cells, which can be modified by hyperpolarizing the cell prior to its subsequent depolarization by sound (Kanold & Manis, 1999, 2001). A greater number of CN granule cell inputs targeting the inhibitory interneurons (cartwheel and stellate cells) in the noise-damaged animals, as suggested above, would produce more inhibitory responses (hyperpolarization). In the noise-damaged animals, suppression of self-generated sounds would be especially advantageous in order to enhance the perception of novel, externally generated environmental signals.
The increased sensitivity to somatosensory input following cochlear damage shown in this study could influence auditory functions requiring bimodal input, such as the localization of the body in space, suppression of body-generated sounds or feedback from vocal tract structures to auditory nuclei (Kanold & Young, 2001; Shore, 2005). Changes in trigeminal input to the DCN could also have a significant impact on the response characteristics of higher order neurons that receive its output, e.g. the external nucleus of the inferior colliculus neurons that mimic the bimodal integration shown in DCN (Jain & Shore, 2006; Zhou & Shore, 2006a).
Spontaneous activity increases following a reduction in auditory nerve input
The significantly increased SR in DCN single units observed at 1 week post-exposure, in conjunction with cochlear damage, is similar to previous findings showing increased multiunit SR after equivalent levels and durations of noise exposure and time following exposure (Kaltenbach et al., 2000, 2002; Kaltenbach, 2000; Chang et al., 2002; Rachel et al., 2002; Zacharek et al., 2002). In the present study, the increased SR at 2 weeks post-exposure, although not significant, is consistent with increased outer hair cell damage at that time. The increased variability at this time point after cochlear damage may reflect neurons undergoing plasticity (Kim et al., 2004).
The finding that only units responding with excitation to trigeminal stimulation showed increased SR suggests that this factor (i.e. activation by somatosensory innervation) must be taken into account when considering mechanisms inducing the increased SR and its relevance to tinnitus. In this vein, it is important to note that the major cochlear damage in this study was to outer hair cells, which are innervated by type II auditory nerve fibers. Type II auditory nerve fibers project primarily to the dendrites of small cells in the small cell cap of the CN (Benson & Brown, 2004), a region that receives somatosensory input (Shore & Zhou, 2006). Therefore, damage to outer hair cells could preferentially affect those pyramidal cells that indirectly receive inputs from the somatosensory system via the granule cell/parallel fiber system. The correlation of increased SRs with the presence of tinnitus in animals, together with an increased prevalence of somatosensory influences in patients with tinnitus (Moller et al., 1992; Cacace et al., 1999; Brozoski et al., 2002; Moller & Rollins, 2002; Levine et al., 2003; Kaltenbach et al., 2004) and the findings of the present study suggest that the somatosensory system may play a role in the generation of tinnitus.
Acknowledgements
We are grateful to Chris Ellinger for electronic assistance, Ben Yates for graphic design, Jianxun Zhou for expert histological reconstructions, Gary Dootz for noise exposure and ABRs, Cameron Herrington for unit sorting and typing, and Jianzhong Lu for data collection. We thank Sanford Bledsoe for insightful comments on the manuscript. The Center for Neural Communication Technology in the Department of Engineering supplied the multichannel electrodes. This work was supported by grants from the National Institute on Deafness and Other Communication Disorders (R01 DC004825, P30 05188), the Tinnitus Research Consortium and the Tinnitus Research Initiative.
Abbreviations
- ABR
auditory brainstem response
- BBN
broadband noise
- BF
best frequency
- CN
cochlear nucleus
- DCN
dorsal cochlear nucleus
- E
excitatory
- E/In
excitatory/inhibitory
- In
inhibitory
- GAP-43
growth associated protein of 43 kDa
- SPL
sound pressure level
- SL
sensation level
- SR
spontaneous rate
References
- Aikin LM, Kenyon CE, Philpott P. The representation of the auditory and somatosensory systems in the external nucleus of the cat inferior colliculus. J. Comp. Neurol. 1981;196:25–40. doi: 10.1002/cne.901960104. [DOI] [PubMed] [Google Scholar]
- Batzri-Izraeli R, Kelly JB, Glendenning KK, Masterton RB, Wollberg Z. Auditory cortex of the long-eared hedgehog (Hemiechinus auritus) I. Boundaries and frequency representation. Brain Behav. Evol. 1990;36:237–248. doi: 10.1159/000115310. [DOI] [PubMed] [Google Scholar]
- Benson T, Brown M. Postsynaptic targets of type II auditory nerve fibers in the cochlear nucleus. J. Assoc. Res. Otolaryngol. 2004;5:111–125. doi: 10.1007/s10162-003-4012-3. [DOI] [PMC free article] [PubMed] [Google Scholar]
- Bilak M, Kim J, Potashner SJ, Bohne BA, Morest DK. New growth of axons in the cochlear nucleus of adult chinchillas after acoustic. Exp. Neurol. 1997;147:256. doi: 10.1006/exnr.1997.6636. [DOI] [PubMed] [Google Scholar]
- Brozoski TJ, Bauer CA, Caspary DM. Elevated fusiform cell activity in the dorsal cochlear nucleus of chinchillas with psychophysical evidence of tinnitus. J. Neurosci. 2002;22:2383–2390. doi: 10.1523/JNEUROSCI.22-06-02383.2002. [DOI] [PMC free article] [PubMed] [Google Scholar]
- Cacace AT, Cousins JP, Parnes SM, McFarland DJ, Semenoff D, Holmes T, Davenport C, Stegbauer K, Lovely TJ. Cutaneous-evoked tinnitus. II. Review of neuroanatomical, physiological and functional imaging studies. Audiol. Neurootol. 1999;4:258–268. doi: 10.1159/000013849. [DOI] [PubMed] [Google Scholar]
- Cantallops I, Routtenberg A. Activity-dependent regulation of axonal growth: posttranscriptional control of the GAP-43 gene by the NMDA receptor in developing hippocampus. J. Neurobiol. 1999;41:208–220. [PubMed] [Google Scholar]
- Chang H, Chen K, Kaltenbach JA, Zhang J, Godfrey DA. Effects of acoustic trauma on dorsal cochlear nucleus neuron activity in slices. Hear. Res. 2002;164:59–68. doi: 10.1016/s0378-5955(01)00410-5. [DOI] [PubMed] [Google Scholar]
- Dehner LR, Keniston LP, Clemo HR, Meredith MA. Cross–modal circuitry between auditory and somatosensory areas of the cat anterior ectosylvian sulcal cortex: a ‘new’ inhibitory form of multisensory convergence. Cereb. Cortex. 2004;14:387–403. doi: 10.1093/cercor/bhg135. [DOI] [PubMed] [Google Scholar]
- Foxe JJ, Morocz IA, Murray MM, Higgins BA, Javitt DC, Schroeder CE. Multisensory auditory–somatosensory interactions in early cortical processing revealed by high-density electrical mapping. Brain Res. Cogn. Brain Res. 2000;10:77–83. doi: 10.1016/s0926-6410(00)00024-0. [DOI] [PubMed] [Google Scholar]
- Foxe JJ, Wylie GR, Martinez A, Schroeder CE, Javitt DC, Guilfoyle D, Ritter W, Murray MM. Auditory-somatosensory multisensory processing in auditory association cortex: an fMRI study. J. Neurophysiol. 2002;88:540–543. doi: 10.1152/jn.2002.88.1.540. [DOI] [PubMed] [Google Scholar]
- Francis HW, Manis PB. Effects of deafferentation on the electrophysiology of ventral cochlear nucleus neurons. Hear. Res. 2000;149:91–105. doi: 10.1016/s0378-5955(00)00165-9. [DOI] [PubMed] [Google Scholar]
- Godfrey D, Kiang N, Norris B. Single unit activity in the posteroventral cochlear nucleus of the cat. J. Comp. Neurol. 1975a;162:247–268. doi: 10.1002/cne.901620206. [DOI] [PubMed] [Google Scholar]
- Godfrey DA, Kiang NY, Norris BE. Single unit activity in the dorsal cochlear nucleus of the cat. J. Comp. Neurol. 1975b;162:269–284. doi: 10.1002/cne.901620207. [DOI] [PubMed] [Google Scholar]
- Haenggeli CA, Pongstaporn T, Doucet JR, Ryugo DK. Projections from the spinal trigeminal nucleus to the cochlear nucleus in the rat. J. Comp. Neurol. 2005;484:191–205. doi: 10.1002/cne.20466. [DOI] [PubMed] [Google Scholar]
- Hickmott PW, Merzenich MM. Local circuit properties underlying cortical reorganization. J. Neurophysiol. 2002;88:1288–1301. doi: 10.1152/jn.00994.2001. [DOI] [PubMed] [Google Scholar]
- Izraeli R, Koay G, Lamish M, Heicklen-Klein AJ, Heffner HE, Heffner RS, Wollberg Z. Cross-modal neuroplasticity in neonatally enucleated hamsters: structure, electrophysiology and behaviour. Eur. J. Neurosci. 2002;15:693–712. doi: 10.1046/j.1460-9568.2002.01902.x. [DOI] [PubMed] [Google Scholar]
- Jain R, Shore S. External inferior colliculus integrates trigeminal and acoustic information: Unit responses to trigeminal nucleus and acoustic stimulation in the guinea pig. Neurosci. Lett. 2006;395:71–75. doi: 10.1016/j.neulet.2005.10.077. [DOI] [PubMed] [Google Scholar]
- Kaltenbach JA. Neurophysiologic mechanisms of tinnitus. J. Am. Acad. Audiol. 2000;11:125–137. [PubMed] [Google Scholar]
- Kaltenbach JA, Zhang J, Afman CE. Plasticity of spontaneous neural activity in the dorsal cochlear nucleus after intense sound exposure. Hear. Res. 2000;147:282–292. doi: 10.1016/s0378-5955(00)00138-6. [DOI] [PubMed] [Google Scholar]
- Kaltenbach JA, Rachel JD, Mathog TA, Zhang J, Falzarano PR, Lewandowski M. Cisplatin-induced hyperactivity in the dorsal cochlear nucleus and its relation to outer hair cell loss: relevance to tinnitus. J. Neurophysiol. 2002;88:699–714. doi: 10.1152/jn.2002.88.2.699. [DOI] [PubMed] [Google Scholar]
- Kaltenbach JA, Zacharek MA, Zhang J, Frederick S. Activity in the dorsal cochlear nucleus of hamsters previously tested for tinnitus following intense tone exposure. Neurosci. Lett. 2004;355:121–125. doi: 10.1016/j.neulet.2003.10.038. [DOI] [PubMed] [Google Scholar]
- Kanold PO, Manis PB. Transient potassium currents regulate the discharge patterns of dorsal cochlear nucleus pyramidal cells. J. Neurosci. 1999;19:2195–2208. doi: 10.1523/JNEUROSCI.19-06-02195.1999. [DOI] [PMC free article] [PubMed] [Google Scholar]
- Kanold PO, Manis PB. A physiologically based model of discharge pattern regulation by transient K+ currents in cochlear nucleus pyramidal cells. J. Neurophysiol. 2001;85:523–538. doi: 10.1152/jn.2001.85.2.523. [DOI] [PubMed] [Google Scholar]
- Kanold PO, Young ED. Proprioceptive information from the pinna provides somatosensory input to cat dorsal cochlear nucleus. J. Neurosci. 2001;21:7848–7858. doi: 10.1523/JNEUROSCI.21-19-07848.2001. [DOI] [PMC free article] [PubMed] [Google Scholar]
- Kim J, Gross J, Morest D, Potashner S. Quantitative study of degeneration and new growth of axons and synaptic endings in the chinchilla cochlear nucleus after acoustic overstimulation. J. Neurosci. Res. 2004;77:829–842. doi: 10.1002/jnr.20211. [DOI] [PubMed] [Google Scholar]
- Kruger L, Bendotti C, Rivolta R, Samanin R. Distribution of GAP-43 mRNA in the adult rat brain. J. Comp. Neurol. 1993;333:417–434. doi: 10.1002/cne.903330308. [DOI] [PubMed] [Google Scholar]
- Le Prell CG, Shore SE, Hughes LF, Bledsoe SC., Jr Disruption of lateral efferent pathways: functional changes in auditory evoked responses. J. Assoc. Res. Otolaryngol. 2003;4:276–290. doi: 10.1007/s10162-002-3018-6. [DOI] [PMC free article] [PubMed] [Google Scholar]
- Levine RA, Abel M, Cheng H. CNS somatosensory–auditory interactions elicit or modulate tinnitus. Exp. Brain Res. 2003;153:643–648. doi: 10.1007/s00221-003-1747-3. [DOI] [PubMed] [Google Scholar]
- Manis PB. Membrane properties and discharge characteristics of guinea pig dorsal cochlear nucleus neurons studied in vitro. J. Neurosci. 1990;10:2338–2351. doi: 10.1523/JNEUROSCI.10-07-02338.1990. [DOI] [PMC free article] [PubMed] [Google Scholar]
- Michler SA, Illing RB. Acoustic trauma induces reemergence of the growth- and plasticity-associated protein GAP-43 in the rat auditory brainstem. J. Comp. Neurol. 2002;451:250–266. doi: 10.1002/cne.10348. [DOI] [PubMed] [Google Scholar]
- Moller AR, Rollins PR. The non-classical auditory pathways are involved in hearing in children but not in adults. Neurosci. Lett. 2002;319:41–44. doi: 10.1016/s0304-3940(01)02516-2. [DOI] [PubMed] [Google Scholar]
- Moller AR, Moller MB, Yokota M. Some forms of tinnitus may involve the extralemniscal auditory pathway. Laryngoscope. 1992;102:1165–1171. doi: 10.1288/00005537-199210000-00012. [DOI] [PubMed] [Google Scholar]
- Montgomery JC, Bodznickq D. An adaptive filter that cancels self-induced noise in the electrosensory and lateral line mechanosensory systems of fish. Neurosci. Lett. 1994;174:145–148. doi: 10.1016/0304-3940(94)90007-8. [DOI] [PubMed] [Google Scholar]
- Muly SM, Gross JS, Potashner SJ. Noise trauma alters D-[3H]aspartate release and AMPA binding in chinchilla cochlear nucleus. J. Neurosci. Res. 2004;75:585–596. doi: 10.1002/jnr.20011. [DOI] [PubMed] [Google Scholar]
- Piche M, Chabot N, Bronchti G, Miceli D, Lepore F, Guillemot JP. Auditory responses in the visual cortex of neonatally enucleated rats. Neuroscience. 2007;145:1144–1156. doi: 10.1016/j.neuroscience.2006.12.050. [DOI] [PubMed] [Google Scholar]
- Populin LC, Yin TCT. Bimodal interactions in the superior colliculus of the behaving cat. J. Neurosci. 2002;22:2826–2834. doi: 10.1523/JNEUROSCI.22-07-02826.2002. [DOI] [PMC free article] [PubMed] [Google Scholar]
- Rachelx JD, Kaltenbach JA, Janisse J. Increases in spontaneous neural activity in the hamster dorsal cochlear nucleus following cisplatin treatment: a possible basis for cisplatin-induced tinnitus. Hear. Res. 2002;164:206–214. doi: 10.1016/s0378-5955(02)00287-3. [DOI] [PubMed] [Google Scholar]
- Rhode W, Smith P. Encoding timing and intensity in the ventral cochlear nucleus of the cat. J. Neurophysiol. 1986;56:261–286. doi: 10.1152/jn.1986.56.2.261. [DOI] [PubMed] [Google Scholar]
- Salar G, Ori C, Lob I, Costella G, Battaggia C, Peserico L. Cerebral blood flow changes induced by electrical stimulation of Gassarian ganglion after experimentally induced subarachnoid haemorhage in pigs. Acta Neurochir. Wien. 1992;119:115–120. doi: 10.1007/BF01541794. [DOI] [PubMed] [Google Scholar]
- Schroeder CE, Lindsley RW, Specht C, Marcovici A, Smiley JF, Javitt DC. Somatosensory input to auditory association cortex in the macaque monkey. J. Neurophysiol. 2001;85:1322–1327. doi: 10.1152/jn.2001.85.3.1322. [DOI] [PubMed] [Google Scholar]
- Shore SE. Multisensory integration in the dorsal cochlear nucleus: unit responses to acoustic and trigeminal ganglion stimulation. Eur. J. Neurosci. 2005;21:3334–3348. doi: 10.1111/j.1460-9568.2005.04142.x. [DOI] [PubMed] [Google Scholar]
- Shore SE, Moore JK. Sources of input to the cochlear granule cell region in the guinea pig. Hear. Res. 1998;116:33–42. doi: 10.1016/s0378-5955(97)00207-4. [DOI] [PubMed] [Google Scholar]
- Shore SE, Zhou J. Somatosensory influence on the cochlear nucleus and beyond. Hear. Res. 2006;216–217:90–99. doi: 10.1016/j.heares.2006.01.006. [DOI] [PubMed] [Google Scholar]
- Shore SE, Godfrey DA, Helfert RH, Altschuler RA, Bledsoe SC., Jr Connections between the cochlear nuclei in guinea pig. Hear. Res. 1992;62:16–26. doi: 10.1016/0378-5955(92)90199-w. [DOI] [PubMed] [Google Scholar]
- Shore SE, Vass Z, Wys NL, Altschuler RA. Trigeminal ganglion innervates the auditory brainstem. J. Comp. Neurol. 2000;419:271–285. doi: 10.1002/(sici)1096-9861(20000410)419:3<271::aid-cne1>3.0.co;2-m. [DOI] [PubMed] [Google Scholar]
- Shore SE, El-Kashlan HK, Lu J. Effects of trigeminal ganglion stimulation on unit activity of ventral cochlear nucleus neurons. Neuroscience. 2003;119:1085–1101. doi: 10.1016/s0306-4522(03)00207-0. [DOI] [PubMed] [Google Scholar]
- Shore SE, Zhou J, Zheng C, Nannapaneni N. Auditory deafferentation results in a redistribution of glutamatergic projections from Cauditory and non-auditory regions to the cochlear nucleus. Soc. Neurosci. Abstr. 2007 699.5. [Google Scholar]
- Stabler SE, Palmer AR, Winter IM. Temporal and mean rate discharge patterns of single units in the dorsal cochlear nucleus of the anesthetized guinea pig. J. Neurophysiol. 1996;76:1667–1688. doi: 10.1152/jn.1996.76.3.1667. [DOI] [PubMed] [Google Scholar]
- Vass Z, Shore S, Nuttall A, Miller J. Direct evidence of trigeminal innervation of the cochlear blood vessels. Neuroscience. 1998;84:559–567. doi: 10.1016/s0306-4522(97)00503-4. [DOI] [PubMed] [Google Scholar]
- Wallace MT, Stein BE. Sensory and multisensory responses in the newborn monkey superior colliculus. J. Neurosci. 2001;21:8886–8894. doi: 10.1523/JNEUROSCI.21-22-08886.2001. [DOI] [PMC free article] [PubMed] [Google Scholar]
- Wallace MT, Wilkinson LK, Stein BE. Representation and integration of multiple sensory inputs in primate superior colliculus. J. Neurophysiol. 1996;76:1246–1266. doi: 10.1152/jn.1996.76.2.1246. [DOI] [PubMed] [Google Scholar]
- Wepsic JG. Multimodal sensory activation of cells in the magnocellular medial geniculate nucleus. Exp. Neurol. 1966;15:299–318. doi: 10.1016/0014-4886(66)90053-7. [DOI] [PubMed] [Google Scholar]
- Young E. Cochlear nucleus. In: Shepherd G, editor. The Synaptic Organization of the Brain. Oxford: Oxford University Press; 1998. pp. 121–158. [Google Scholar]
- Young ED, Nelken I, Conley RA. Somatosensory effects on neurons in dorsal cochlear nucleus. J. Neurophysiol. 1995;73:743–765. doi: 10.1152/jn.1995.73.2.743. [DOI] [PubMed] [Google Scholar]
- Zacharek MA, Kaltenbach JA, Matho TA, Zhang J. Effects of cochlear ablation on noise induced hyperactivity in the hamster dorsal cochlear nucleus: implications for the origin of noise induced tinnitus. Hear. Res. 2002;172:137–143. doi: 10.1016/s0378-5955(02)00575-0. [DOI] [PubMed] [Google Scholar]
- Zhou J, Shore S. Projections from the trigeminal nuclear complex to the cochlear nuclei: a retrograde and anterograde tracing study in the guinea pig. J. Neurosci. Res. 2004;78:901–907. doi: 10.1002/jnr.20343. [DOI] [PubMed] [Google Scholar]
- Zhou J, Shore S. Convergence of spinal trigeminal and cochlear nucleus projections in the inferior colliculus of the guinea pig. J. Comp. Neurol. 2006a;495:100–112. doi: 10.1002/cne.20863. [DOI] [PubMed] [Google Scholar]
- Zhou J, Shore S. Abstracts for the 29th Annual Midwinter Meeting. Baltimore: Association for Research in Otolaryngology; 2006b. Changes in the distribution of vesicular glutamate transporters in the cochlear nucleus after deafness: relationship to auditory and non-auditory inputs. Abstract 668. [Google Scholar]
- Zhou J, Nannapaneni N, Shore S. Vesicular glutamate transporters 1 and 2 are differentially associated with auditory nerve and spinal trigeminal inputs to the cochlear nucleus. J. Comp. Neurol. 2007;500:777–787. doi: 10.1002/cne.21208. [DOI] [PubMed] [Google Scholar]


