Abstract
A long-standing hypothesis is that tinnitus, the perception of sound without an external acoustic source, is triggered by a distinctive pattern of cochlear hair cell (HC) damage and this subsequently leads to altered neural activity in the central auditory pathway. This hypothesis was tested by assessing behavioral evidence of tinnitus and spontaneous neural activity in the inferior colliculus (IC) after unilateral cochlear trauma. Chinchillas were assigned to 4 cochlear treatment groups. Each treatment produced a distinctive pattern of HC damage. Acoustic exposure (AEx): sparse low-frequency inner hair cell (IHC) and outer hair cell (OHC) loss; round window cisplatin (CisEx): pronounced OHC loss mixed with some IHC loss; round window carboplatin (CarbEx): pronounced IHC loss without OHC loss; control: no loss. Compared to controls, all experimental groups displayed significant and similar psychophysical evidence of tinnitus with features resembling a 1 kHz tone. Contralateral IC spontaneous activity was elevated in the AEx and CisEx groups, which showed increased spiking and increased cross-fiber synchrony. A multi-dimensional analysis identified a subpopulation of neurons more prevalent in animals with tinnitus. These units were characterized by high bursting, low ISI variance, and within-burst peak spiking of approximately 1000/sec. It was concluded that cochlear trauma in general, rather than its specific features, leads to multiple changes in central activity that underpin tinnitus. Particularly affected was a subpopulation ensemble of IC neurons with the described unique triad of features.
Keywords: acoustic trauma, carboplatin, cisplatin, spontaneous unit activity, silicon-substrate electrodes, chinchillas, tinnitus
Introduction
Tinnitus, the perception of a sound without an external acoustic source, is a complex perceptual phenomenon. Conservative estimates indicate that in the U.S. 15 million adults have bothersome tinnitus (Evered and Lawrenson 1981; Man and Naggan 1981). Although cochlear trauma is strongly associated with tinnitus, central neural pathology must play a major contributory role. The present experiments were designed to cross reference distinct patterns of cochlear pathology to psychophysical evidence of chronic tinnitus and pathology in an auditory brainstem structure.
Hypotheses about the peripheral causes of tinnitus typically invoke cochlear damage with specific features. These features have included altered mechanical coupling between hair cells and the tectorial membrane (Tonndorf 1977), patterns of hair cell loss such as selective loss of outer hair cells (OHC’s) (Melamed et al. 2000), selective degeneration of Type 1 or Type 2 afferents (Jastreboff 1990), and selective pathological stimulation of sensory cells (Kaltenbach et al. 2002; Kiang et al. 1982; Tonndorf 1981). These hypotheses have not been systematically tested using a quantitative analysis of cochlear morphology in animals with behavioral evidence of tinnitus.
Another challenge has been to identify the neurophysiological underpinnings of tinnitus. Although peripheral insult is often the leading-edge event, central neural pathology is fundamental to the disorder, as chronic tinnitus often emerges with a delayed onset following peripheral damage (Nondahl et al. 2002; Turner et al. 2006). Furthermore, dramatic tinnitus has been reported in individuals with no cochlear function (Berliner et al., 1992). It has been hypothesized that peripheral de-afferentation produces a loss of inhibitory tone in the auditory system (Brozoski et al. 2002; Eggermont and Roberts 2004; Gerken 1996; Kaltenbach et al. 2004; Suneja et al. 1998) that leads to inappropriate neuroplastic events and the sensation of tinnitus. This hypothesis has been useful in generating testable questions. Several lines of research indicate that peripheral manipulations thought to produce tinnitus result in altered spontaneous activity in auditory structures (Kaltenbach and Afman 2000; Kaltenbach et al. 2005; Kenmochi and Eggermont 1997; Norena and Eggermont 2003). Chinchillas with tinnitus displayed elevated fusiform cell spontaneous and stimulus-driven activity in the dorsal cochlear nucleus (DCN) (Brozoski et al. 2002). Since fusiform cells comprise the major rostral output of the DCN, consequences would be expected in the target area of those cells, the inferior colliculus (IC). Furthermore, diverse ascending and descending pathways converge on the IC. Finally, increased neural bursting has been observed in the IC of guinea pigs treated with salicylate (Jastreboff and Sasaki 1986), a compound known to produce acute tinnitus in humans.
However, experiments have also been published showing no clear relationship between treatments that induce tinnitus and spontaneous spiking (Ma et al. 2006). Aside from increased activity, the neurophysiological signature of tinnitus might be reflected by increased regularity, or decreased asynchrony of spiking (Dominguez et al. 2006), or as increased cross-fiber synchrony (Eggermont 1990; Komiya and Eggermont 2000; Moller 1984). The neurophysiological signature of tinnitus in the IC requires further investigation since few, if any, studies have shown an unequivocal relationship between treatments that induce chronic tinnitus, direct evidence of chronic tinnitus, and neural activity alterations in the IC.
The present research was designed to determine the relationship between distinctly different patterns of cochlear hair cell damage, psychophysical evidence of tinnitus, and alterations of IC neural activity that may comprise the neurophysiological signature of tinnitus.
Method
Animals
26 young adult male chinchillas (Ryerson Chinchilla Farm, Plymouth, OH), 1.5 to 2 years of age served as subjects. The study was performed in accordance with Southern Illinois University “Policy on Humane Care and Use of Laboratory Animals”, and the National Institutes of Health Animal Welfare Act, and was approved by the Southern Illinois University School of Medicine Laboratory Animal Care and Use Committee. One subject was discarded because of poor health, and the data of two were not reported because IC neural recording sites could not be histologically confirmed.
Tinnitus Assessment
The objective of psychophysical testing was to determine the presence and qualitative features of tinnitus induced by the different types of cochlear insult. Tinnitus was assessed in individual animals using conditioned suppression of an operant behavior (Bauer and Brozoski 2001) (Brozoski et al. 2002). Animals were trained to press a lever for a food reward (operant training) and to refrain from lever pressing in the absence of acoustic stimulation (conditioned suppression). All animals were run in parallel throughout training and testing, i.e., they differed only in their cochlear exposure to traumatic sound or ototoxins. Behavioral training and testing occurred prior to cochlear trauma and tinnitus induction. After cochlear trauma, behavioral testing was repeated and tinnitus assessed.
Operant Training
Animals were maintained on restricted food intake and trained to lever press for food pellets (PJNI-0045, Research Diets, New Brunswick, NJ) in individual operant conditioning chambers. Operant lever press training required 48 60-minute sessions to achieve criterion performance using a variable-interval (VI) reinforcement schedule. Broad-band noise (BBN) at 60 dB SPL was presented to each operant chamber via a speaker (Optimus, 40-1219, Tandy Corp., Ft. Worth, TX), center-mounted in each chamber lid. The BBN was continuously present, except when acoustic test stimuli were presented. Experimental control and data acquisition were accomplished using desktop computers running in-house programs and custom interfaces (Keithley/MetraByte, Cleveland, OH).
Behavior quantification
In each one-minute period of each session, a suppression ratio (R) was calculated for each animal, using the formula: R = B / (A+B), where A was the number of lever presses in the preceding period and B the number of lever presses in the current period. R provided a running index of behavior, and enabled a quantitative comparison between animals as well as unbiased compilation of group data.
Suppression Training
The purpose of suppression training was two fold: it trained the animals to listen carefully to their acoustic environment and it trained animals to discriminate between the sound on and sound off periods. In suppression training, the animals received a 1 sec, 0.5 mA, footshock if they lever press above a criterion level of R≥0.2 during speaker off periods. When animals decreased their lever pressing during speaker off periods so that R < 0.2, footshock was avoided. The tandem and constant parameters of food reinforcement for lever pressing, and footshock for speaker-off lever pressing, maintained discrimination behavior in a steady state.
Acoustic (Tinnitus) Testing
The objective of acoustic testing was to determine the presence and qualitative features of tinnitus induced by the different types of cochlear insult. This was accomplished by testing the animals’ discrimination of specific acoustic stimuli. In acoustic testing, BBN or tones of various intensities were randomly presented during a session. Prior to the induction of tinnitus, behavior in the presence of test stimuli was primarily driven by stimulus intensity, the more audible the signal the more lever pressing rates approached baseline levels. Conversely, the less audible the signal, the more lever pressing suppressed toward zero. After induction of tinnitus, behavior in the presence of test stimuli is driven by the interaction between the tinnitus and the test stimuli. Animals with tinnitus hear speaker off periods differently than animals without tinnitus, and the perception of test tones that are qualitatively similar to their tinnitus is also affected.
Animals were tested with BBN, and pure tones of 1, 2, 4, 6, 8 and 12 kHz. In any given session, one of the seven test stimuli was randomly presented 8 times using 4 different intensity levels. Intensity order was randomized within the session. The range of test intensity levels varied with the stimulus, and always extended from low audible intensities to clearly audible intensities. Each test stimulus was 1 min in duration. Each stimulus was tested over a minimum of 5 sessions, with stimulus type randomized across sessions. All animals were treated identically and tested in parallel, both prior to and following cochlear trauma. Individual animal and group discrimination functions were derived from test-stimulus suppression ratios.
Behavior: Data analysis
Behavioral data were archived in digital spreadsheets for statistical analysis and graphic depiction. Descriptive and inferential statistical analyses and graphic depictions were done using Excel (Professional Edition, 2003, Microsoft Corp, Redmond, WA). Two-factor mixed ANOVAs were used to compare group performance for each stimulus test condition: Cochlear treatment was the independent group comparison and stimulus intensity level was the repeated-measures comparison.
Group Composition
Once pre-trauma discrimination functions were determined, the animals were divided into 4 groups, matched for equivalent psychophysical performance. This was accomplished by running a spreadsheet minimization routine that used group assignment to minimize the mean difference between groups across all stimulus conditions. Final group n’s were control (unexposed) 4, AEx (acoustic exposure) 5, CisEx (cisplatin exposed) 7, and CarbEx (carboplatin exposed) 7.
Cochlear Trauma: ABR Hearing Thresholds
Auditory brainstem evoked-response (ABR) thresholds were determined for each ear using an IHS High-frequency System (Intelligent Hearing Systems, Miami, FL) before and immediately after acoustic exposure, and at the conclusion of the experiment, 7 to 9 months after cochlear trauma. Thresholds are not elevated immediately after round window toxin application and therefore were not assessed (Bauer and Brozoski 2005). Animals were anesthetized with an intramuscular (IM) ketamine HCl / xylazine (24.6 / 3 mg/kg) mixture and placed in a modified stereotaxic head frame inside a sound-attenuation chamber. Acoustic stimuli were presented directly to the entrance of the ear canal using IHS transducers that fit into the opening of the ear canal. Stainless steel needle electrodes were placed subcutaneously at the vertex and over the bullae with a reference electrode at the occiput. ABR thresholds were obtained for 5 ms duration tone bursts (0.5, 1, 2, 4, 8, 12 and 16 kHz) presented at a rate of 50/s. The tone bursts were gated using an exact Blackman envelope (2.5 ms rise/decay, 0 ms plateau) and presented in a decreasing intensity series, beginning with levels that elicited distinct evoked potentials. Threshold was determined by the lowest intensity producing visually distinct evoked potentials, progressing in 20, 10, and 5 dB (re 20 μPa) steps, from above threshold to near threshold, respectively. Evoked potentials were amplified x 200, 000, bandpass filtered (100 - 3000 Hz), and averaged over 1024 sweeps. Recording epochs comprised the 12 ms following stimulus onset.
Cochlear Trauma: Acoustic Exposure
At the completion of pre-trauma psychophysical testing, AEx animals were anesthetized as described above and, following ABR threshold determination, placed in a modified stereotaxic head holder. A snugly-fitting stainless steel speculum with an attached speaker driver (Realistic 40-1398) was inserted tightly into the left ear canal. Using this system a 4 kHz tone at 85 dB sound pressure level (SPL) was presented into the ear canal for 1 hr. Similar exposure has been shown to produce psychophysical evidence of tinnitus in chinchillas (Brozoski et al. 2002). Sound frequency and intensity were determined using a Brüel & Kjaer Pulse sound measurement system (Pulse 9 & 10 software), equipped with a 3560C high-frequency module, and a 4138 pressure-field microphone coupled to the transducer using rubber tubing with the internal dimensions of a chinchilla external auditory canal. The sound measurement system permitted linear sound intensity measurements between 0 and 140 dB (re 20 μPa) and spectral analysis between 6.5 Hz and 100 kHz. The microphone placement approximated that of the tympanic membrane, hence the 85 dB trauma level estimated the sound intensity at the tympanic membrane. Calibrations were carried out as unweighted linear sound pressure levels. ABR thresholds were again determined at the conclusion of acoustic exposure. Psychophysical testing resumed a minimum of 2 weeks after acoustic exposure.
Cochlear Trauma: Toxin Exposure
At the completion of behavioral training and pre-trauma psychophysical testing, animals assigned to toxin exposure were anesthetized as described above and, following ABR threshold determinations, placed in a stereotaxic head holder. Animals were prepared for surgical exposure of their left round window. The left bulla was exposed using a posterior approach and a 2 mm opening created to visualize the round window membrane with a binocular operating microscope. Carboplatin (4 mg/ml preservative -free normal saline, 2 μl, 15 min) or cisplatin (0.66 mg/ml preservative-free normal saline, 2 μl, 15 min) was applied to the RW membrane using a Hamilton syringe. The solutions were removed after 15 min using a saline rinse. After toxin removal the RW was inspected to verify the absence of surgical trauma and the surgical site was closed. Psychophysical testing resumed a minimum of 2 weeks after toxin exposure.
Electrophysiology
Recording
Multichannel records of spontaneous and driven IC neural activity were obtained at the conclusion of psychophysical assessment. Animals were anesthetized (ketamine 34 mg/kg, xylazine 4.3 mg/kg), placed in a modified stereotaxic head frame within a double-wall acoustic chamber, and unit recordings were obtained from the left and right IC of all animals. A 5 mm craniotomy was opened posterior and lateral to lambda to the left and right of the sagittal sinus. Cortex was partially aspirated to enable an unobstructed electrode approach to the IC. Using an alternating sequence, the right IC (contralateral to trauma) was penetrated first in half of the animals; in the remaining animals the left IC was penetrated first. A 16-channel linear microelectrode array (model CNCT, 5mm 100-400 s, Ann Arbor, MI;) with a thickness of 15 μm and recording contact size of 20 μ by 20 μm was inserted in a parasagittal plane, at a posterior-inferior angle (23° relative to vertical) to optimally span the tonotopic laminae of the IC. The electrode was incrementally advanced into the IC while sound bursts (clicks and tones, 5 msec duration, 60 - 80 dB), were presented to the contralateral ear via drivers (DT48A earphone, Beyerdynamic, Farmingdale, NY) attached to custom hollow ear bars. A flexible probe microphone (Etymotic, Elk Grove Village, IL) tube placed near the tympanum was used to monitor stimuli and generate calibration tables in decibels (SPL, re 20 μpa) for use by programmable attenuators. The electrode array was advanced until sound-driven activity could be visualized in at least 12 of the 16 channels. Once a satisfactory recording site was established, the animal was left undisturbed for 20 min. This permitted tissue at the recording site to establish a constant position with respect to the electrode contacts. Spontaneous activity was then recorded for 5 min, followed by stimulus driven recording. The recordings were obtained using a multi-electrode array preamplifier and workstation analyzer (Plexon Inc., Dallas, TX). Rate-intensity functions were determined using 50 msec tone bursts (5 msec rise - decay, 50 repetitions) presented in ascending intensity series extending from 10 to 80 dB SPL (10 dB increments). Once stimulus-driven activity was recorded, another 5 min of spontaneous activity was obtained. At the conclusion of all recording, the multiprobe position was marked by passing 2 - 4 mA of radio-frequency current in parallel through all 16 channels of the probe for 120-180 sec. Details of the lesion marking procedure have been described elsewhere (Brozoski et al. 2006). The probe was then withdrawn, cleaned with distilled water, and the procedure repeated for the opposite IC.
Electrophysiology: Data analysis
Recorded digitized spike waveforms were sorted prior to data analysis to eliminate poorly discriminated spikes, waveforms not related to neural activity, and redundant waveforms recorded on more than one channel. Channel-by-channel digitized waveform records were off-line sorted into single-unit records using a combination of principal component analyses and multivariate t-statistic sorting routines (Offline Sorter, ver 2.7.1, Plexon, Inc, Dallas, TX). Visual inspection of the sorted waveforms was used to eliminate records of waveforms unlikely to have been produced by neurons (e.g., inverted polarity, multi-phasic wave shape, etc.). The sorted single-unit records were exported to spreadsheets for determination of temporal cross-correlation matrices. Temporal cross correlation matrices were used to eliminate redundant units, i.e., neurons with activity recorded on more than one channel. Unit records that correlated within a ± 2 msec window, with r ≥ 0.2 for units recorded on an immediately adjacent contact, or with r ≥ 0.5 for units recorded on nonadjacent contacts, were eliminated from further analysis. The record with the more poorly discriminated waveform was eliminated. This culling procedure prevented single units from contributing more than once to the final data set.
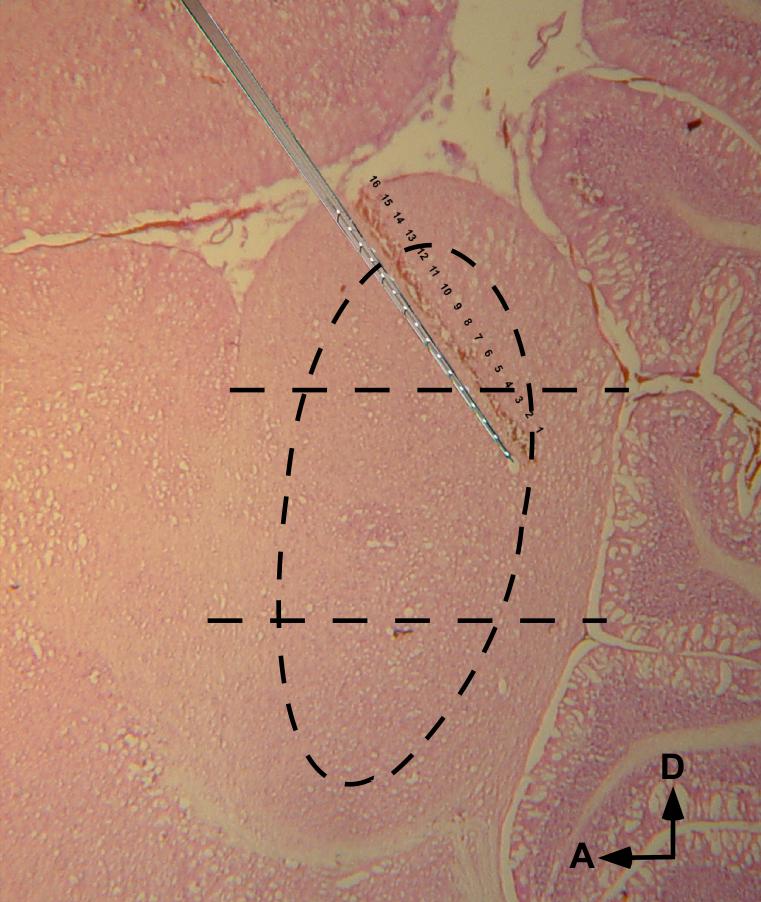
Sorted and culled single-unit records were further analyzed using commercial software (NeuroExplorer® v. 3.16, Nex Technologies, Inc, Dallas, TX) and custom spreadsheet routines. Ten parameters of spontaneous activity were chosen for analysis, based on their potential relevance to hypotheses regarding the neurophysiological underpinnings of tinnitus, i.e., increased spontaneous firing (Kaltenbach and Afman 2000; Kaltenbach et al. 2005; Kenmochi and Eggermont 1997; Norena and Eggermont 2003), increased regularity of firing (Dominguez et al. 2006) (Eggermont 1990; Komiya and Eggermont 2000; Moller 1984), and increased burst firing (Jastreboff and Sasaki 1986). The ten parameters analyzed were: Spike frequency, spike autocorrelation (both distribution normality and kurtosis), cross-fiber synchrony (i.e., temporal correlation), spike bursts, spike peak frequency within bursts, interspike-interval (ISI) mean, ISI median, ISI mode, and ISI standard deviation. Data reduction was done in stages: Initial analysis was done on sorted units from individual recording sites. The results of this analysis were exported to spreadsheets organized by animals and treatment groups. For group analysis, descriptive and inferential statistics were determined for single units segregated and pooled by treatment group (control, AEx, CarbEx, CispEx) and recording site (contralateral, ipsilateral, IC core, IC shell, dorsal, middle, or ventral IC partitions) (Fig.1). Approximately equal cross-sectional areas were used to define dorso-ventral trisection of the IC. Core and shell areas were defined using topographic and cytoarchitectonic criteria (Moller and Rees 1986; Zhou and Shore 2006). The shell approximates the external and dorsal cortex, while the core corresponds to the central nucleus of the IC. The core/shell partitioning and dorso-ventral partitioning were not mutually exclusive. Units recorded from sites that could not be histologically confirmed to be within the IC were excluded from analysis.
Fig. 1.
A lesion-marked multi-probe electrode track in chinchilla IC, with superimposed image of a probe. Individual recording sites appear as punctuate lesions (numbered 1 - 16), separated by 100 μm. The separation between core and shell subdivisions is approximated by the curved broken line; the dorso-ventral partitioning of the IC is indicated by the horizontal broken lines. Sagittal view, fast H & E stain.
Treatment effects were determined using mixed ANOVAs, while multiple t tests and the Kolmogorov-Smirnov statistic were used for individual comparison of experimental and control treatments (SPSS for Windows, v. 14.0, SPSS, Inc., Chicago, IL). Significance levels were Bonferroni corrected for multiple comparisons. Cross-fiber temporal correlations were done between units recorded from all channels of each multiprobe recording site, then averaged for treatment groups to determine cross-fiber synchrony.
Electrophysiology: Burst Definition
The NeuroExplorer® (v. 3.16, Nex Technologies, Inc, Dallas, TX) interval-specification algorithm was used to assess bursting. This algorithm required 6 parameters to define a burst. The following conservative parameter values were used to define a burst:
Maximum allowable burst duration: 310 sec
Maximum inter-spike interval (ISI) at burst start: 500 msec.
Maximum within-burst inter-spike interval: 500 msec.
Minimum interval between bursts: 1 sec.
Minimum burst duration: 5 msec.
Minimum number of spikes comprising a burst: 2.
The above definition parameters were optimized and validated using the following procedure:
The spontaneous activity records (each 300 sec in duration) of 34 independent single units were randomly selected; selection was blind with respect to animal and treatment group.
Each record was visually rated for “burstiness” using a 6 point scale: 1 = very bursty (virtually all spikes clustered in very distinct clusters of 2 or more spikes each), 6 = non-bursting (no bursts visually evident).
Successive iterations of the NeuroExplorer burst algorithm were run with parameter adjustments to obtain the best correlation between visually-rated bursting and algorithm-determined bursting. The burst algorithm parameter values given above produced the best correlation, r = 0.4, F (1, 32) = 4.69, p = 0.038.
Brain Histology
The locations of electrode penetration in the IC were determined at the conclusion of neural recording. Animals were sacrificed using an overdose of anesthetic (Sleepaway, Fort Dodge Animal Health, Ft. Dodge, IA), and perfused transcardially with 0.9 percent normal saline, followed by 4 percent paraformaldehyde in 0.1 M phosphate buffer. Brains were cryoprotected by immersion in 20 percent sucrose overnight. Parasagittal sections (20 μm), encompassing the left and right IC, were mounted on glass slides, stained with fast H & E (Hematoxylin 7211, Eosin-Y 7111, Richard-Allan Scientific, Kalamazoo, MI), and digitally photographed using light microscopy at 10 x magnification. The digital images were used to identify the location of the individual electrode contacts within the IC (Fig. 1).
Cochlear Morphometry
Cochlear damage was quantified at the conclusion of psychophysical testing and IC neural recording. Cochleas were removed and processed using a previously described procedure (Bauer and Brozoski 2005; Bohne 1972). Each cochlea was analyzed using phase contrast microscopy for extent, type, and location of hair cell damage. The frequency locus of damage along the organ of Corti was determined using the place-frequency equation of Greenwood (Greenwood 1990). Cytocochleograms were constructed for each cochlea using Origin 7.0 (OriginLab, Northampton, MA). Group composite cytocochleograms were determined from these data and used to characterize the average pattern of cochlear trauma in each treatment group.
Results
Patterns of Cochlear Hair Cell Loss
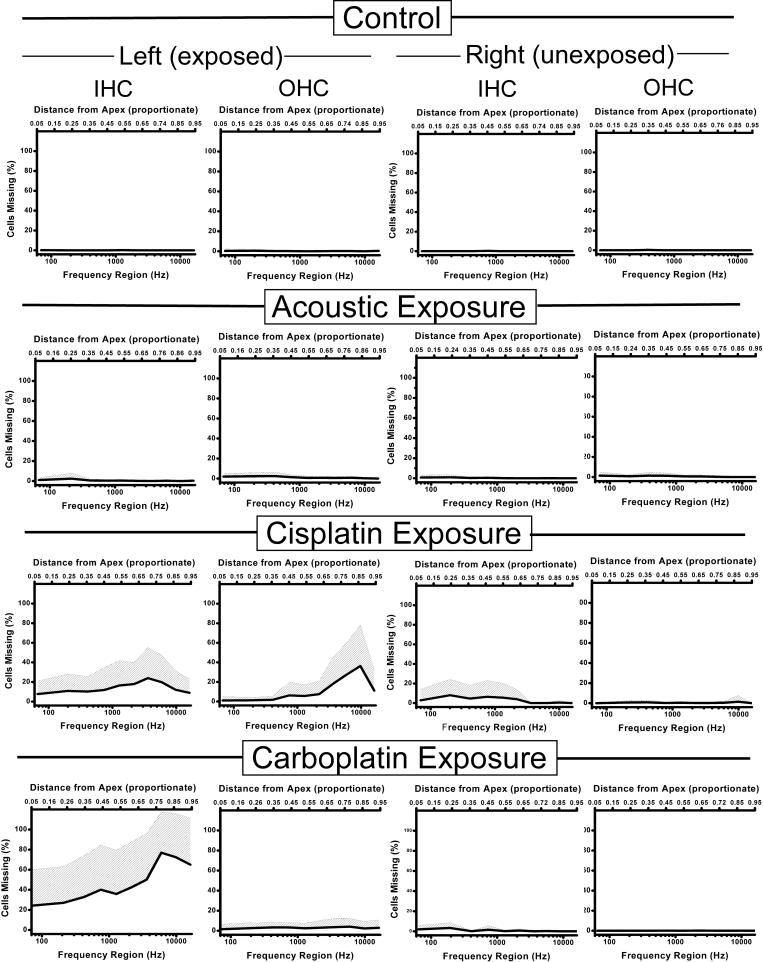
Distinctive patterns of cochlear HC damage characterized each of the treatment groups (Fig. 2): 1) Control cochleas were bilaterally intact. 2) AEx exposed cochleas showed on average less than 5 percent IHC and OHC loss, while AEx unexposed cochleas were intact. Although average OHC loss in AEx exposed cochleas was low (1.12%), compared to unexposed controls (0.19%) nevertheless this represented a statistically significant reduction (t = 4.79, df = 58, p = 0.00005). IHC loss in AEx cochleas was not statistically significant. 3) CarbEx exposed cochleas showed greater than 50 percent IHC loss above 4 kHz and less than 5 percent OHC loss. In some CarbEx animals, IHC loss above 4 kHz approached 100 percent. Therefore, carboplatin produced substantial and selective destruction of IHC’s. CarbEx unexposed cochleas had intact OHC’s and less than 5 percent IHC loss. 4) CispEx exposed cochleas had on average 40 percent OHC loss from 9 - 10 kHz in conjunction with an average 10 - 20 percent IHC loss along the entire length of the organ of Corti; CispEx unexposed cochleas showed intact OHC’s and an unexpected 5 - 10 percent IHC loss below 2 kHz. It appeared that, although cisplatin was more toxic to OHC’s than IHC’s, toxicity was difficult to control and as a result was less selective than carboplatin. Both cisplatin and carboplatin produced more high-frequency than low-frequency damage, perhaps not surprising given their direct round-window application. In conclusion, cochleae from each treatment group displayed a distinctly different pattern and amount of cochlear pathology.
Fig.2.
Average cytocochleograms of each treatment group, for both exposed and unexposed cochleas. The shaded area indicates + 1 standard deviation. Unexposed cochleas of all groups (two right-hand columns) showed little hair cell loss, with the exception of the cisplatin group in which some IHC loss was evident (on average less than 10 %). Control animals displayed normal cochleas, while acoustically exposed animals had less than 5 percent IHC and OHC loss in exposed cochleas. Cisplatin exposed animals showed both IHC and OHC loss in exposed cochleas. Carboplatin exposed animals showed a reasonably selective large loss of IHC in their exposed cochleas. IHC: inner hair cell; OHC: outer hair cell.
Hearing Thresholds and Cochlear Damage
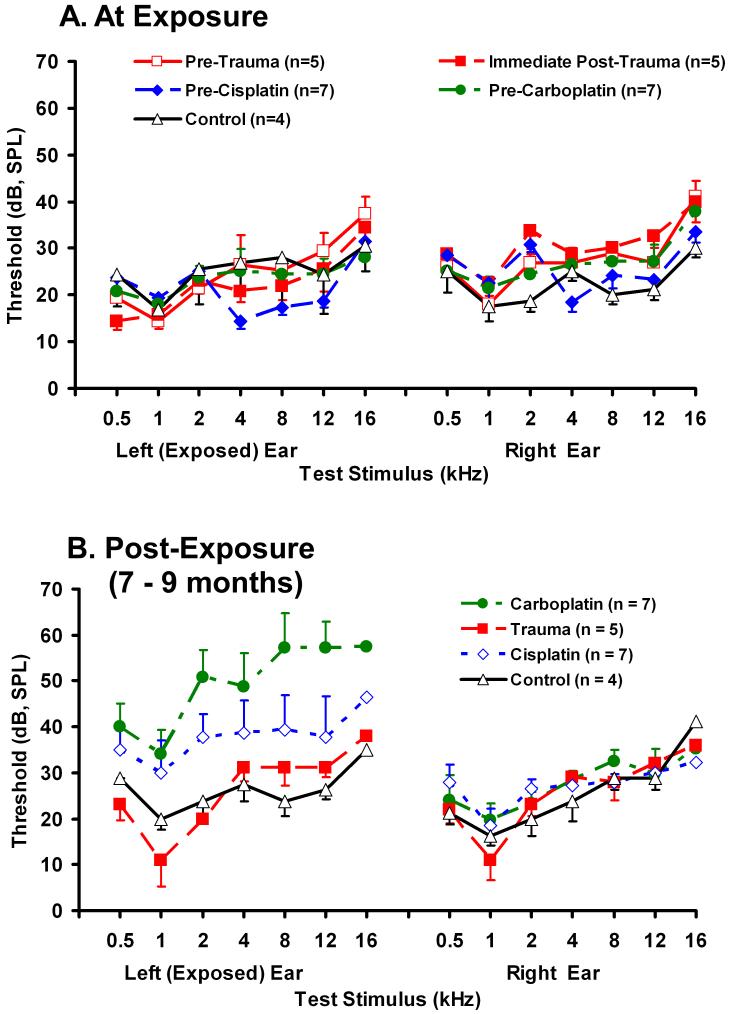
Pre-exposure ABR thresholds and hearing-threshold consequences of cochlear trauma, are depicted in Fig. 3. Thresholds were comparable across all groups at the time of exposure (Fig. 3A). There was no significant threshold shift immediately after acoustic exposure in the AEx animals (Fig. 3A). Long-term exposed-ear ABR thresholds in the CispEx animals were elevated approximately 5 to 15 dB over control animal thresholds. CarbEx animals had long-term exposed-ear ABR threshold elevations of 10 - 35 dB (Fig. 3B).
Fig.3.
Acoustic brainstem evoked-response hearing thresholds obtained at the time of cochlear exposure (A) and at the time of electrophysiological data collection, 7 - 9 months after unilateral (left) exposure (B). Error bars show the standard error of the mean.
An unexpected low-frequency threshold preservation was evident in the post-treatment ABR thresholds of the AEx animals, where the long-term post-exposure threshold at 1 kHz was 3.4 dB lower than the pre-exposure threshold, although this decrease was not statistically significant (p = 0.50). For all three experimental groups, the frequency with the least ABR threshold shift, from pre-treatment to post-treatment, was 1 kHz.
Psychophysical Evidence of Tinnitus and Cochlear Damage
The suppression ratio (R) is a relative measure of what an animal hears when tested with acoustic stimuli. This measure can be interpreted as a reflection of tinnitus because a test tone that is qualitatively similar to an animal’s tinnitus will be heard differently in an animal with tinnitus compared to an animal without tinnitus. Test tones that differ in frequency from the tinnitus will not be so affected. Tinnitus-related differences in auditory perception are reflected in the suppression ratio, a measure of psychophysical performance.
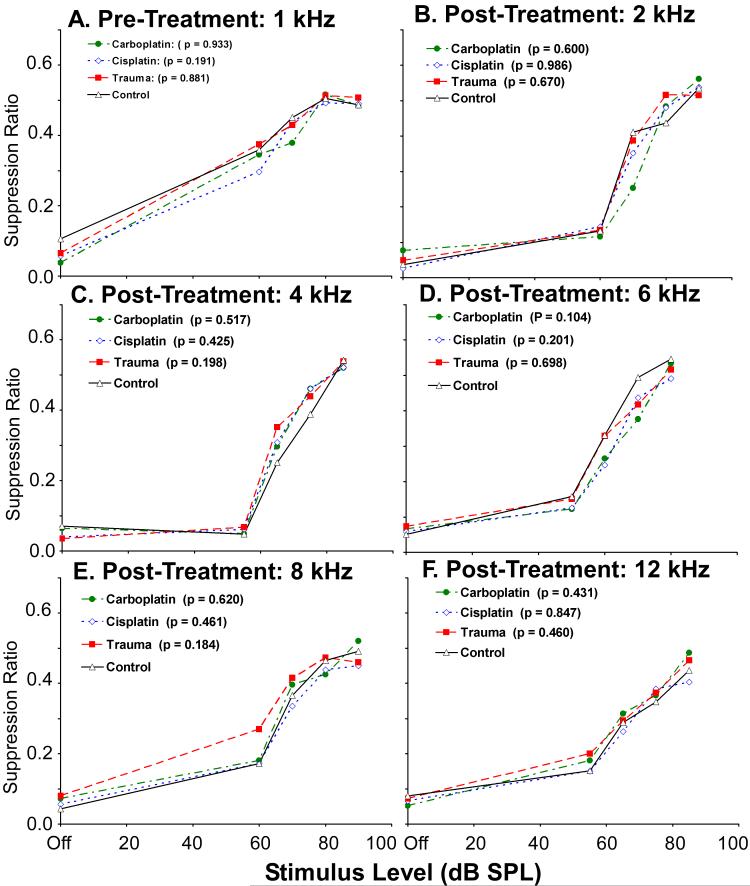
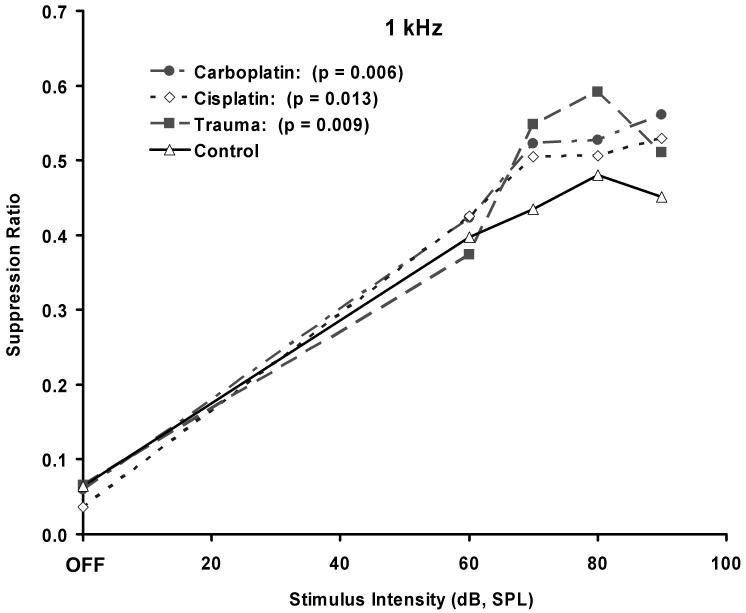
Prior to cochlear trauma, all four groups showed comparable psychophysical performance across all stimulus test conditions (e.g., Fig 5A). After cochlear trauma, the only significant psychophysical difference between groups appeared at 1 kHz (compare Fig. 4 to Fig. 5B - 5F), where each experimental group differed significantly from the control group, but not from one another. The tinnitus induced in each of the experimental groups, therefore, was most similar in quality to a 1 kHz tone.
Fig.5.
A. 1 kHz discrimination prior to cochlear insult. Error bars indicate the standard error of the mean. B. - F. Discrimination functions other than 1 kHz determined after cochlear insult, as depicted in Fig.4. Legends include t statistic significance levels comparing experimental group functions (intensities > 0) to controls.
Fig.4.
1 kHz tone discrimination indicative of tinnitus in the acoustic exposed (n = 5), cisplatin exposed (n = 7), and carboplatin exposed (n = 7) chinchillas, compared to unexposed controls (n = 4). The functions were determined 2 months after trauma or toxin exposure. The legend includes t statistic significance levels comparing experimental group functions (intensities > 0) to controls. Error bars indicate the standard error of the mean.
Contrary to the prediction of some hypotheses, (Melamed et al. 2000; Tonndorf 1981), the greatest tinnitus effect was not observed in the group with the most asymmetric OHC and IHC damage. The AEx and CarbEx animals displayed comparable levels of tinnitus (p = 0.009 and p = 0.006, respectively), yet there was no observed asymmetry in cochlear histology of the AEx animals, whereas there was pronounced asymmetry in the cochlear histology of CarbEx animals. CispEx animals showed significant evidence of tinnitus as well (p = 0.013), but less so than either the AEx or CarbEx animals.
It is difficult to quantify the asymmetry of cochlear pathology since symmetry may be measured along multiple distinct dimensions (e.g., ipsilateral vs contralateral, IHC vs OHC, high-frequency vs low-frequency region, etc.) and the relevance of each dimension to tinnitus is unknown. Nevertheless, in qualitative terms, the exposure resulting in the greatest cochlear asymmetry was in the CarbEx group. The asymmetry of CarbEx cochlear damage was evident both in terms of IHC - OHC comparison and ipsilateral - contralateral comparison. In contrast, total HC loss was greatest in the CispEx group, with substantial IHC and OHC damage in exposed cochleas, and an average 10 percent IHC loss in unexposed cochleas. Despite substantial differences in cochlear pathology, all treatment groups showed similar evidence of tinnitus, both qualitatively and quantitatively (Fig. 4).
IC Spontaneous Neuron Activity: One-dimensional Population Measures
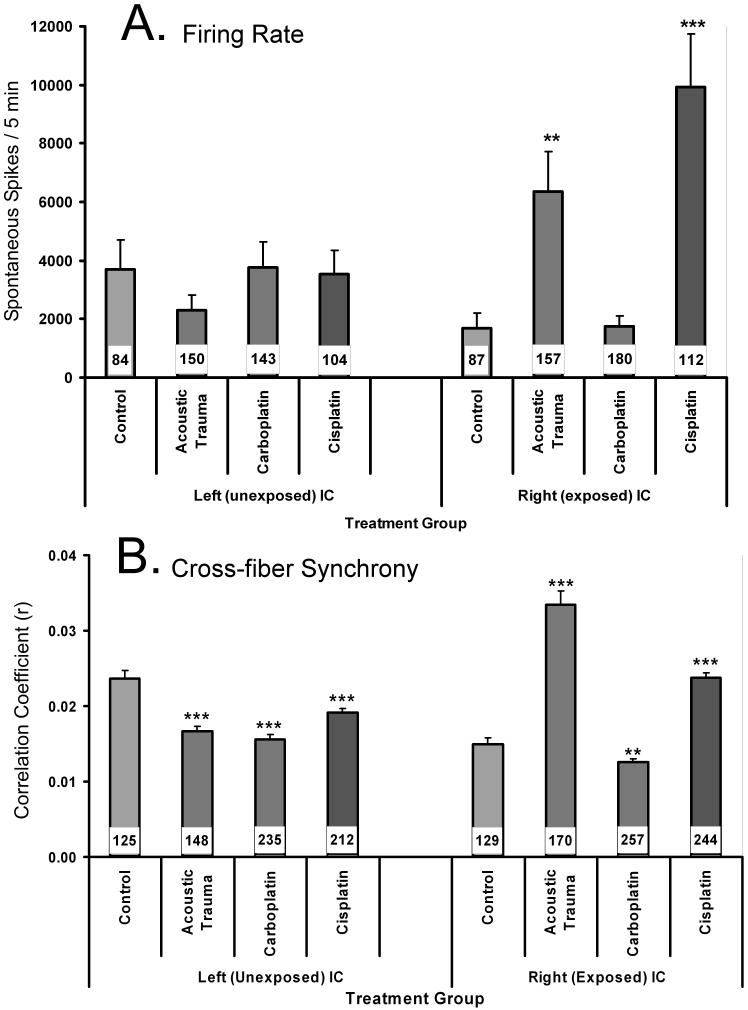
Ten parameters of spontaneous IC neuron activity were analyzed for all successfully discriminated and sorted IC units. There were no significant differences in any of the parameters between IC partitions (core, shell, dorsal, middle and ventral). Only two parameters showed a statistically significant increase in experimental animals: Spike rate and cross-fiber synchrony (Fig. 6). Cross-fiber synchrony (± 5 msec window) was significantly elevated in the contralateral IC of the AEx and CispEx groups (Fig. 6B, right panel), and significantly decreased in the ipsilateral IC, of all three treatment groups (Fig. 6B, left panel). Spontaneous firing was significantly elevated in the contralateral IC of the AEx and CispEx groups, but not in the CarbEx group. Although increased firing increases the opportunity for synchronous cross-fiber spike correlation, spontaneous activity averaged over all units in the experiment was quite modest at 12.9 spikes per sec. Furthermore, the correlation coefficients for the narrow temporal window (± 5 msec) used in the cross-fiber analysis were all less than 0.1. Therefore, the increased cross-fiber synchrony in two of the experimental groups does not appear to be a statistical artifact of spontaneous firing rate.
Fig.6.
Two features of spontaneous inferior colliculus single-neuron activity, obtained 8 - 9 months after unilateral exposure, of unexposed (n = 4), acoustic exposed (n = 5), cisplatin exposed (n = 7), and carboplatin exposed (n = 7) chinchillas. Recording epochs were 5 min. * p < 0.05, ** p < 0.01, *** p < 0.001. The number of single units contributing to each average is indicated by the number inset within each bar. Error bars indicate the standard error of the mean.
Predicting tinnitus magnitude from electrophysiological data
A correlation analysis was run comparing the psychophysical performance of individual animals to all parameters of IC spontaneous activity. Fifteen animals with complete bilateral IC data sets were used in this analysis: Control (n = 3), AEx (n = 5), CarbEx (n = 5) and CispEx (n = 2). Using the Bonferroni correction for multiple comparisons, none of the IC measures significantly predicted individual animal psychophysical performance.
IC Spontaneous Neuron Activity: A Subpopulation Defined by Multidimensional Features
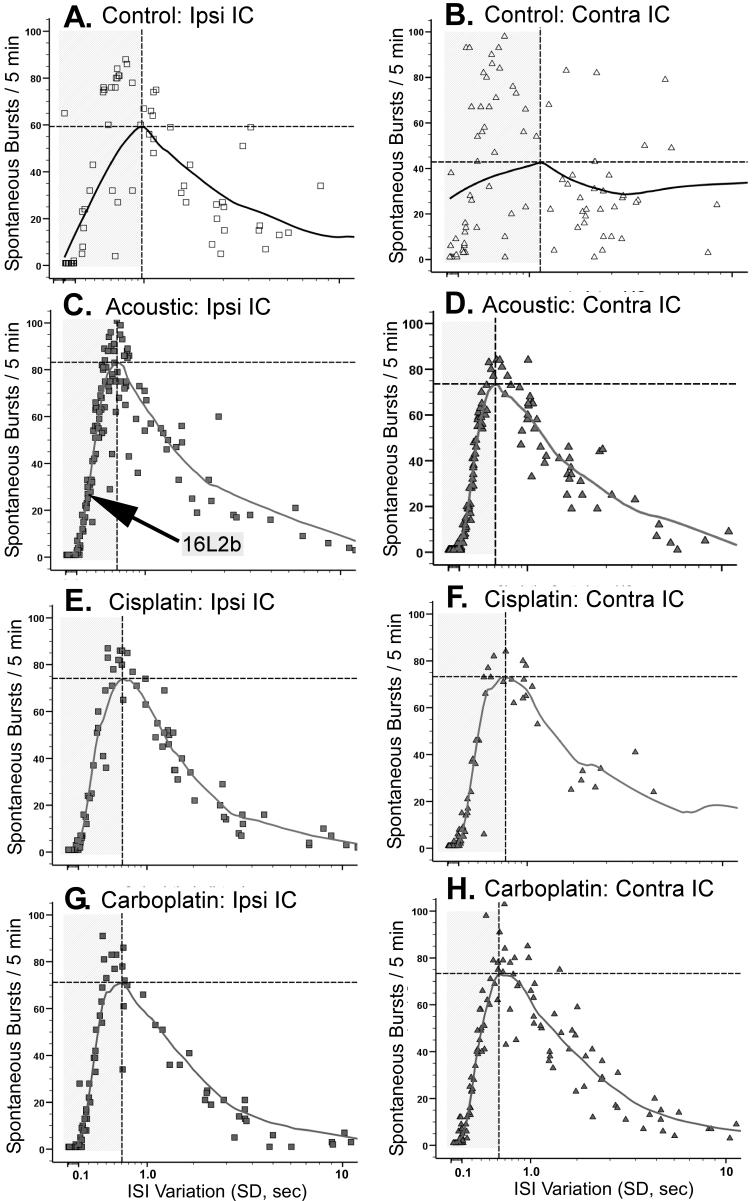
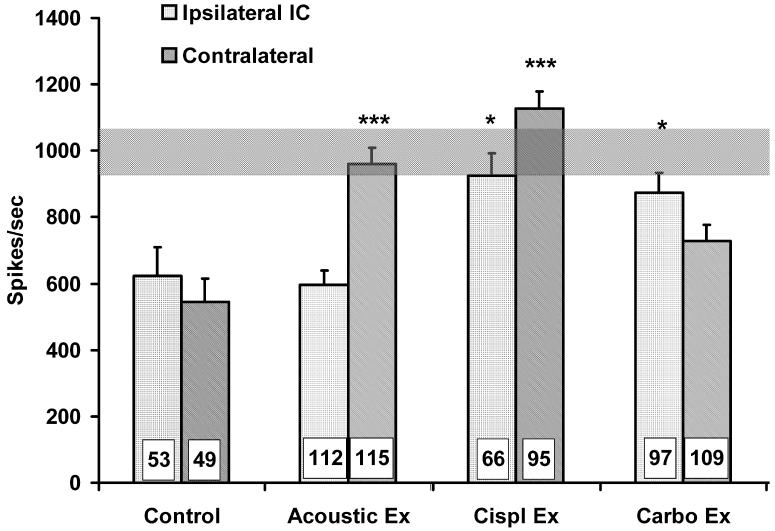
No single-dimensional measure of IC spontaneous activity was significantly different between the control group and all of the experimental groups. If a subpopulation of aberrant neurons underpins tinnitus, the pathological features of their activity may not clearly emerge when considering single-dimensional measures from a large sample of randomly selected neurons, as in the analysis described above. In an attempt to circumvent this problem, an analysis was made of multidimensional features of spontaneous activity which might serve to identify a specific population of neurons with an electrophysiological profile more pathognomonic for tinnitus. This analysis, which examined a large number of bivariate features of spontaneous activity, identified ISI variability and bursting as important parameters relevant to tinnitus. The neuronal subpopulation to emerge from this analysis was composed of bursting neurons with low ISI variance. This subpopulation is shown in the shaded areas of the Fig. 7 correlograms that depict spontaneous bursting as a function of ISI variability. The correlograms of animals with tinnitus showed a well-defined linear relationship between spike bursting and spike variance up to the regression line inflection point (Figs. 7C - 7H). The shaded areas of Fig. 7 highlight the leg of the bivariate functions, to the left of the inflection point, used to define this subpopulation of units. Note that the correlation between bursting and spike variance was much weaker for control animals (Figs. 7A - 7B). Linear regression coefficients for data points to the left of the inflection point are summarized in Table 1, and show a clear difference between control and experimental groups. Units comprising the linear leg of the correlogram define an ensemble of neurons that differed between the experimental groups and control. This subpopulation of units was evident in both the ipsilateral and contralateral IC of experimental animals, with linear coefficients for the contralateral IC’s being somewhat higher. Within-burst spontaneous activity in this ensemble of neurons was distinctly different between animals with tinnitus and controls. All experimental groups had significantly elevated within-burst peak spike frequencies, either contralaterally or bilaterally, when compared to controls (Fig. 8). The highest peak frequencies were generally seen in the contralateral IC of trauma-exposed animals, and they approximated the frequency (1 kHz, Fig. 8, horizontal bar) at which there was psychophysical evidence of tinnitus.
Fig.7.
Scatter-plot depiction of spontaneous bursting as a function of single unit inter-spike-interval (ISI) variation for each of the treatment groups. Each data point represents a single unit. All units meeting the sorting criteria outlined in Electrophysiology: Data analysis are plotted. The solid line is an iterative least-mean square regression line. The vertical and horizontal broken lines index the inflection point of the regression line. The shaded area to the left of the inflection point encompasses the units used for the linear regression analysis summarized in Table 1. Left-column panels show results from the ipsilateral IC; right-column panels show results from the contralateral IC. The arrow (panel C) indicates data point for unit 16L2b, depicted in Fig. 9. There was no significant left and right difference in total spikes per 5 min, bursts per 5 min, mean peak frequency within burst, ISI (SD) or ISI mode for the control group.
Table 1.
Spontaneous bursting vs ISI variance linear regression coefficients for units selected from the approximately linear region left of the inflection point (shaded area) of the correlograms depicted in Fig. 7. In this region the linear correlation between bursting and ISI variance was significant for all groups for both the ipsilateral and contralateral IC’s (p < 0.001), however the coefficients approached 1 for the exposed groups
| Treatment Group | Ipsilateral (Unexposed) IC | Contralateral (Exposed) IC |
|---|---|---|
| Unexposed Controls | 0.751 | 0.485 |
| Acoustic Exposed | 0.908 | 0.944 |
| Carboplatin Exposed | 0.915 | 0.910 |
| Cisplatin Exposed | 0.956 | 0.925 |
Fig.8.
Mean intra-burst peak spike frequency for the subpopulation of IC neurons falling within the shaded areas in Fig.7 is displayed for each group. The intra-burst peak frequency of the units in the exposed groups approximated the frequency at which the exposed animals showed psychophysical evidence of tinnitus (horizontal bar). All exposed groups were significantly different from controls, either contralaterally or bilaterally (* p < 0.05, *** p < 0.001). Error bars indicate the standard error of the mean (SEM). The horizontal gray bar represents ± 1 SEM for the unexposed control group.
In the present study the recording site of each unit was determined using an electrolytic lesioning technique (Brozoski et al. 2006). Subpopulation units were widely distributed across all partitions of the IC (Table 2). In general, compared to controls, there were more subpopulation units located in the contralateral IC core of the exposed animals (compare the top and bottom row of Table 2). The distribution of subpopulation units was quite variable along the dorso-ventral axis of the IC. In general, compared to controls, there were more subpopulation units located in the dorsal and middle third of the IC of the exposed animals (compare the top and bottom row of Table 2).
Table 2.
Distribution of subgroup neurons, as percent of neurons (subgroup + non-subgroup) recorded from each IC partition, for each treatment group. The left 4 columns show the percent of units located in the core and shell areas of the IC. The right 6 columns show the percent of units located in the dorsal, middle, and ventral 1/3 portions of the IC. The bottom row shows distribution of subunits for all three exposed groups combined
| Treatment Group | Ipsilateral IC | Contralateral IC | Ipsilateral IC | Contralateral IC | ||||||
|---|---|---|---|---|---|---|---|---|---|---|
| Core | Shell | Core | Shell | Dorsal | Middle | Ventral | Dorsal | Middle | Ventral | |
| Control | 65 | 59 | 57 | 47 | 77 | 51 | 56 | 44 | 57 | 82 |
| Acoustic Ex | 63 | 73 | 77 | 55 | 74 | 63 | 69 | 61 | 77 | 100 |
| Carboplatin Ex | 64 | 52 | 61 | 56 | 86 | 55 | 35 | 76 | 58 | 49 |
| Cisplatin Ex | 76 | 36 | 81 | 60 | 67 | 58 | --* | 86 | 83 | 53 |
| All Exposed | 67 | 58 | 71 | 57 | 77 | 59 | 49 | 68 | 69 | 57 |
No units were recorded from the ipsilateral ventral partition of cisplatin exposed. animals.
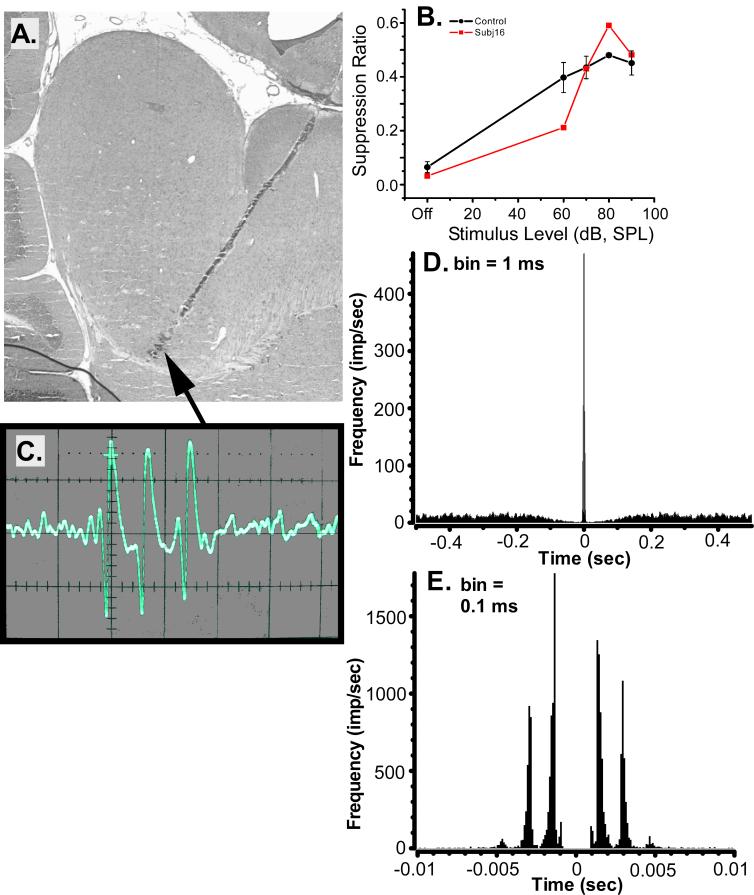
The spontaneous activity of neurons comprising the above-described subpopulation can be illustrated by single-unit data selected from an AEx animal (Fig. 9). The scatter-plot data point for this unit (16L2b) is indicated by the arrow in Fig. 7C. The psychophysical performance of the animal, from which the unit was selected, clearly indicates the presence of tinnitus (Fig. 9B). The depicted unit was recorded from a site in the ventral ipsilateral IC, shown in Fig. 9A. An oscilloscope trace of the unit’s activity (Fig. 9C) revealed robust action potentials with a regular burst pattern composed of 2 to 4 spikes (3 spikes in the portrayed trace) with a within burst ISI of about 1.5 msec. This unit remained on line with undiminished amplitude for an entire 60 min recording session, suggesting that it was undamaged by the electrode. The burst pattern, quantified for the 300 sec spontaneous-activity recording epoch, is depicted in the autocorrelograms shown in Figs. 9D and 9E. The high-resolution autocorrelogram (Fig. 9E) shows four distinct peaks separated by approximately 1.5 msec, while the low-resolution autocorrelogram shows the interburst interval was greater than 1 sec (Fig. 9D).
Fig.9.
An exemplary bursting unit, 16L2b, selected from an acoustic-exposed chinchilla with evidence of tinnitus. A. Sagittal IC section intersecting the track of the multiprobe site from which the unit was recorded. The arrow indicates the recording site of the unit. Distances between the lesion-marked recording sites were 100 μm. B. The psychophysical performance of subject 16 (square data points), from which unit 16L2b was obtained, compared to the performance of non-tinnitus control animals (circular data points, error bars represent the standard error of the mean). C. An oscilloscope trace of unit 16L2b showing its spontaneous burst pattern (minor tick marks: 0.5 msec). D. A low-resolution autocorrelogram of unit 16L2b, 1 sec window. E. A high-resolution autocorrelogram of unit 16L2b, 20 msec window.
IC Stimulus-driven Activity: No Significant Difference in Best Frequency
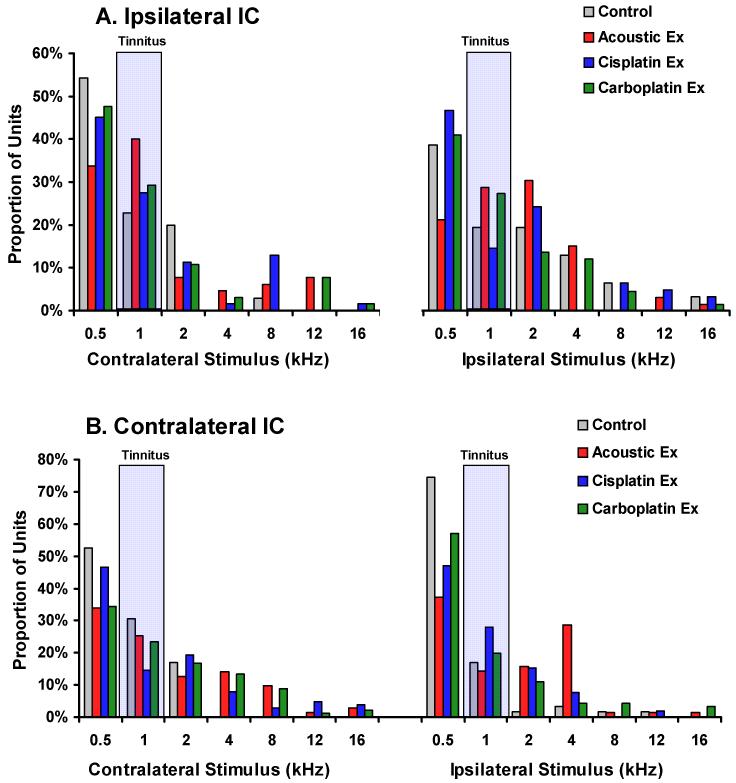
It often has been hypothesized that tinnitus may be reflected by a plastic shift in unit tuning (Cacace 2003; Norena et al. 2003; Seki and Eggermont 2002; Wang et al. 2002). In order to test this hypothesis, a multi-unit best frequency analysis was determined using rate-intensity data. Chi-square analysis revealed no significant difference in the proportionate distribution of best frequencies between the tinnitus groups and the control group (p = 0.359 to 0.994). The results are depicted in Fig. 10A for the ipsilateral IC and in Fig. 10B for the contralateral IC. These data therefore do not support the hypothesis of a frequency-dependent tuning bias in the IC of the tinnitus groups, or the presence of an audiometric edge effect in the IC.
Fig. 10.
Best frequency analysis of all confirmed recording sites. Multi-unit records were analyzed from the ipsilateral (A) and contralateral (B) IC for each treatment group. Best frequency was defined by the rate level function with the greatest stimulus-driven rate increase at asymptote. Both contralateral and ipsilateral pure tone stimuli were tested. There were no statistically significant differences between the control and experimental groups. Each panel summarizes the proportion of best frequencies for ipsilateral as well as contralateral stimulus driving.
Discussion
The primary findings of the present study were:
Three substantially different types of unilateral cochlear trauma produced similar significant psychophysical evidence of chronic tinnitus in chinchillas. HC damage in each experimental group differed in extent, from minimal to substantial, and in pattern, from sparse random IHC and OHC loss, to focal OHC and focal IHC loss. That similar tinnitus emerged from qualitatively and quantitatively different cochlear trauma suggests that cochlear trauma serves as a tinnitus trigger, with specific features of the trauma being relatively unimportant in the resulting qualitative features of tinnitus. It is entirely possible, however, that subtle aspects of asymmetric cochlear dysfunction, not reflected in HC loss, contributed to the emergence of tinnitus.
The AEx and CispEx groups displayed significantly increased spontaneous spiking and increased cross-fiber synchrony. It is tempting to functionally relate the observed changes to the psychophysical evidence of tinnitus. However, strong psychophysical evidence of tinnitus was also observed in the CarbEx animals, and the spontaneous neural activity in this group was similar to controls in both ipsilateral and contralateral IC. No single dimension of IC unit spontaneous activity was significantly elevated in all of the experimental groups, and none significantly correlated with evidence of tinnitus in individual animals.
A multi-dimensional analysis identified a subpopulation of IC neurons, evident in all animals, but most clearly defined in animals with tinnitus. This ensemble of neurons was characterized by a triad of features: Low ISI variation, elevated bursting, and spontaneous within-burst peak frequencies (1000 / sec) that approximated the psychophysically-defined tinnitus frequency (1 kHz). Spontaneous activity in this subpopulation of IC neurons may constitute one of the pathophysiological underpinnings of tinnitus. Units comprising the subpopulation were distributed throughout the IC, and may have been somewhat more prevalent in the core of the contralateral IC. There was significant variability in the distribution pattern of subpopulation neurons in the dorsal-middle-ventral partitions of both the ipsilateral and contralateral IC. The above evidence suggests that the neuropathy in the IC underpinning tinnitus may reside in a subpopulation of units. Moller has suggested that the IC shell with its extra-lemniscal input from the brainstem may be more sensitive to deafferentation pathology (Moller 2006; Moller 2007) than the classical afferent pathways. It also has been suggested that aberrant input to the IC shell from damaged cochlear nucleus neurons (Brozoski et al. 2002; Zhou and Shore 2006) may contribute to the sensation of tinnitus. The present data, however, point to a more widely distributed pathology of the IC in tinnitus, encompassing all regions.
A best-frequency analysis failed to find a tonotopic bias, an edge effect, or a tuning frequency shift in the IC of the experimental groups. There was no consistent difference in spontaneous activity as a function of dorso-ventral unit location. If an audiometric edge were present, one might predict differences in spontaneous activity across the dorso-ventral tonotopic gradient of the IC. More convincingly, there was no evidence that the tinnitus-inducing treatments biased best-frequency distributions of driven activity (Fig. 10).
It is widely believed that tinnitus clinically presents at a pitch higher than the locus of maximum hearing loss. However, a large database containing records from over 800 tinnitus patients indicates nearly one quarter match their tinnitus to a tone between 100 and 3500 Hz. Audiometric data for the same group show, on average, thresholds of 30 dB or less between 250 Hz and 3 kHz (Meikle et al. 2004). In addition, when acute tinnitus is experimentally induced in humans using acoustic exposure, the pitch of the resulting tonal tinnitus is quite variable. When the exposure stimulus was a pure tone, tinnitus frequency tended to be higher than the exposure frequency (Loeb and Smith 1967), but there was considerable interindividual differences in this relationship. Others have found that 1/3-octave band noise exposure produced tinnitus that was of lower frequency than the exposure stimulus (Atherley et al. 1968). These observations suggest only a limited association between locus of maximum hearing loss and tinnitus pitch match. In this and a previous experiment, acoustic exposure to a 4 kHz tone resulted in psychophysical evidence of tinnitus at 1 kHz in chinchillas (Brozoski et al. 2002). These observations are not inconsistent with the literature. The low-frequency tinnitus observed in these experiments may reflect a species-specific bias, or it may reflect what appears to be, in general, a poor correspondence between features of hearing loss, i.e., cochlear damage, and the qualitative features of tinnitus.
CarbEx animals showed strong evidence of tinnitus in the present study. This indicates that IHC loss was as effective, if not more effective, than OHC loss in causing tinnitus. Kaltenbach reported that OHC damage in hamsters, produced by systemic cisplatin, increased spontaneous multi-unit activity in the DCN (Kaltenbach et al. 2002). It was also reported that animals with both IHC and OHC damage showed less dramatically increased DCN activity. The present study is in partial agreement with Kaltenbach’s finding, in that selective IHC destruction in the CarbEx group did not lead to increased spontaneous spiking in the IC. On the other hand, the present study also showed that selective IHC destruction produced significant psychophysical evidence of tinnitus and was associated with spontaneous bursting in a subpopulation of IC shell neurons. Other experiments have established that stimulus-driven activity is enhanced in the chinchilla IC core after IHC damage with carboplatin (Alkhatib et al. 2006; Wang et al. 2002).
This study identified a subpopulation of IC neurons with distinctive electrophysiological features that may be responsible for tinnitus. Attributing causality to a limited neural population may be quite reasonable, given the clinical features of tinnitus. The typical clinical presentation of tinnitus is that of a low-intensity, but potentially very annoying, sensation (Tyler and Stouffer 1989). If tinnitus, per se, interferes with auditory perception, the interference appears to be very modest and does not cause measurable changes in speech discrimination, sound localization or threshold (Stouffer and Tyler 1990). Given these clinical observations, it seems unlikely that the pathophysiology of tinnitus would involve highly aberrant activity in a large proportion of neurons in a major processing area such as the IC. If that were the case, significant disruption of hearing would be expected. Following this line of reasoning, if a large proportion of IC neurons were involved in the pathophysiology of tinnitus, the aberrant effect in each neuron would have to be quite small; otherwise, thresholds and other fundamental aspects of hearing would be affected. However a small change in the spontaneous activity of neurons is inconsistent with the intense annoyance reported by many tinnitus patients. It would also be inconsistent with the often observed difficulty of masking tinnitus with an external sound (Penner and Bilger 1989). A reasonable alternative explanation would be that a pathological subpopulation of neurons is responsible for tinnitus, as suggested by the results of the present study.
The primary challenge presented by the current study is to understand how qualitatively and quantitatively different cochlear pathologies lead to qualitatively and quantitatively similar tinnitus. The present experiment suggests that a subpopulation of IC neurons, characterized by the triad of increased bursting associated with low ISI variability and high within-burst spiking, may underpin tinnitus. The results also indicate that even a very modest decrement in peripheral input is sufficient for triggering tinnitus. In a previous experiment, chinchillas exposed to acoustic trauma similar to that used in the present experiment showed increased DCN fusiform cell spontaneous activity and evidence of tinnitus (Brozoski et al. 2002). The mechanism behind the increased DCN output is unknown, but several lines of evidence suggest a loss of inhibition within the cochlear nucleus (Brozoski et al. 2002; Kaltenbach et al. 2004; Potashner et al. 2000). Important for the present research is that elevated DCN output constitutes increased drive to the IC. Bursting units with low ISI variance that resemble those measured in the present study have been modeled in an auditory circuit with recurrent inhibition and increased drive (Llano and Feng 2000). Lost recurrent inhibition in selective IC neurons, coupled with increased fusiform cell drive, could provide the mechanism to account for the present results. A simple increase in the DCN spontaneous output could therefore drive the complex bursting observed in a subpopulation of multimodal IC neurons under tonic recurrent inhibitory control.
Acknowledgements
Multiprobes donated by CNCT, supported by grants from NIH/NIBIB: P41-EB2030.
Grants.
Research supported by grants from the National Institute on Deafness and Other Communication Disorders: RO1 DC04830 to C. Bauer, and RO1 DC00151 to D. Caspary.
References
- Alkhatib A, Biebel UW, Smolders JW. Reduction of inhibition in the inferior colliculus after inner hair cell loss. Neuroreport. 2006;17(14):1493–1497. doi: 10.1097/01.wnr.0000234754.11431.ee. [DOI] [PubMed] [Google Scholar]
- Atherley GRC, Hempstock TI, Noble WG. Study of tinnitus induced temporarily by noise. J Acoustical Soc Amer. 1968;44(6):1503–1506. doi: 10.1121/1.1911288. [DOI] [PubMed] [Google Scholar]
- Bauer CA, Brozoski TJ. Assessing tinnitus and prospective tinnitus therapeutics using a psychophysical animal model. J of the Assoc for Res in Otolaryngol. 2001;2(1):54–64. doi: 10.1007/s101620010030. [DOI] [PMC free article] [PubMed] [Google Scholar]
- Bauer CA, Brozoski TJ. Cochlear structure and function after round window application of ototoxins. Hear Res. 2005;201(12):121–131. doi: 10.1016/j.heares.2004.09.008. [DOI] [PubMed] [Google Scholar]
- Bohne BA. Location of small cochlear lesions by phase contrast microscopy prior to thin sectioning. Laryngoscope. 1972;82(1):1–16. doi: 10.1002/lary.5540820101. [DOI] [PubMed] [Google Scholar]
- Brozoski TJ, Bauer CA, Caspary DM. Elevated fusiform cell activity in the dorsal cochlear nucleus of chinchillas with psychophysical evidence of tinnitus. J Neurosci. 2002;22(6):2383–2390. doi: 10.1523/JNEUROSCI.22-06-02383.2002. [DOI] [PMC free article] [PubMed] [Google Scholar]
- Brozoski TJ, Caspary DM, Bauer CA. Marking multi-channel silicon-substrate electrode recording sites using radiofrequency lesions. J Neurosci Methods. 2006;150(2):185–191. doi: 10.1016/j.jneumeth.2005.06.012. [DOI] [PubMed] [Google Scholar]
- Cacace AT. Expanding the biological basis of tinnitus: crossmodal origins and the role of neuroplasticity. Hear Res. 2003;175(12):112–132. doi: 10.1016/s0378-5955(02)00717-7. [DOI] [PubMed] [Google Scholar]
- Dominguez M, Becker S, Bruce I, Read H. A spiking neuron model of cortical correlates of sensorineural hearing loss: Spontaneous firing, synchrony, and tinnitus. Neural computation. 2006;18(12):2942–2958. doi: 10.1162/neco.2006.18.12.2942. [DOI] [PubMed] [Google Scholar]
- Eggermont JJ. On the pathophysiology of tinnitus; a review and a peripheral model. Hear Res. 1990;48(12):111–123. doi: 10.1016/0378-5955(90)90202-z. [DOI] [PubMed] [Google Scholar]
- Eggermont JJ, Roberts LE. The neuroscience of tinnitus. Trends Neurosci. 2004;27(11):676–682. doi: 10.1016/j.tins.2004.08.010. [DOI] [PubMed] [Google Scholar]
- Evered D, Lawrenson G. Tinnitus. viii. Ciba Pharmaceutical Co. Medical Education Administration; Summit, NJ: 1981. p. 325. [Google Scholar]
- Gerken GM. Central tinnitus and lateral inhibition: an auditory brainstem model. Hear Res. 1996;97(12):75–83. [PubMed] [Google Scholar]
- Greenwood DD. A cochlear frequency-position function for several species--29 years later. The Journal of the Acoustical Society of America. 1990;87(6):2592–2605. doi: 10.1121/1.399052. [DOI] [PubMed] [Google Scholar]
- Jastreboff PJ. Phantom auditory perception (tinnitus): mechanisms of generation and perception. Neurosci Res (N Y) 1990;8(4):221–254. doi: 10.1016/0168-0102(90)90031-9. [DOI] [PubMed] [Google Scholar]
- Jastreboff PJ, Sasaki CT. Salicylate-induced changes in spontaneous activity of single units in the inferior colliculus of the guinea pig. J Acoust Soc Am. 1986;80(5):1384–1391. doi: 10.1121/1.394391. [DOI] [PubMed] [Google Scholar]
- Kaltenbach JA, Afman CE. Hyperactivity in the dorsal cochlear nucleus after intense sound exposure and its resemblance to tone-evoked activity: a physiological model for tinnitus. Hearing Research. 2000;140(12):165–172. doi: 10.1016/s0378-5955(99)00197-5. [DOI] [PubMed] [Google Scholar]
- Kaltenbach JA, Rachel JD, Mathog TA, Zhang J, Falzarano PR, Lewandowski M. Cisplatin-induced hyperactivity in the dorsal cochlear nucleus and its relation to outer hair cell loss: relevance to tinnitus. J Neurophysiol. 2002;88(2):699–714. doi: 10.1152/jn.2002.88.2.699. [DOI] [PubMed] [Google Scholar]
- Kaltenbach JA, Zacharek MA, Zhang J, Frederick S. Activity in the dorsal cochlear nucleus of hamsters previously tested for tinnitus following intense tone exposure. Neurosci Lett. 2004;355(12):121–125. doi: 10.1016/j.neulet.2003.10.038. [DOI] [PubMed] [Google Scholar]
- Kaltenbach JA, Zhang J, Finlayson P. Tinnitus as a plastic phenomenon and its possible neural underpinnings in the dorsal cochlear nucleus. Hear Res. 2005;206(12):200–226. doi: 10.1016/j.heares.2005.02.013. [DOI] [PubMed] [Google Scholar]
- Kenmochi M, Eggermont JJ. Salicylate and quinine affect the central nervous system. Hearing Research. 1997;113(12):110–116. doi: 10.1016/s0378-5955(97)00137-8. [DOI] [PubMed] [Google Scholar]
- Kiang NY, Rho JM, Northrop CC, Liberman MC, Ryugo DK. Hair-cell innervation by spiral ganglion cells in adult cats. Science. 1982;217(4555):175–177. doi: 10.1126/science.7089553. [DOI] [PubMed] [Google Scholar]
- Komiya H, Eggermont JJ. Spontaneous firing activity of cortical neurons in adult cats with reorganized tonotopic map following pure-tone trauma. Acta Otolaryngol. 2000;120(6):750–756. doi: 10.1080/000164800750000298. [DOI] [PubMed] [Google Scholar]
- Llano DA, Feng AS. Computational models of temporal processing in the auditory thalamus. Biological cybernetics. 2000;83(5):419–433. doi: 10.1007/s004220000174. [DOI] [PubMed] [Google Scholar]
- Loeb M, Smith RP. Relation of induced tinnitus to physical characteristics of the inducing stimuli. J Acoustical Soc Amer. 1967;42(2):453–455. doi: 10.1121/1.1910600. [DOI] [PubMed] [Google Scholar]
- Ma WL, Hidaka H, May BJ. Spontaneous activity in the inferior colliculus of CBA/J mice after manipulations that induce tinnitus. Hear Res. 2006;212(12):9–21. doi: 10.1016/j.heares.2005.10.003. [DOI] [PubMed] [Google Scholar]
- Man A, Naggan L. Characteristics of tinnitus in acoustic trauma. Audiology. 1981;20(1):72–78. doi: 10.3109/00206098109072684. [DOI] [PubMed] [Google Scholar]
- Meikle MB, Creedon TA, Griest SE. Tinnitus Archive. 2004 [Google Scholar]
- Melamed SB, Kaltenbach JA, Church MW, Burgio DL, Afman CE. Cisplatin-induced increases in spontaneous neural activity in the dorsal cochlear nucleus and associated outer hair cell loss. Audiology. 2000;39(1):24–29. doi: 10.3109/00206090009073051. [DOI] [PubMed] [Google Scholar]
- Moller AR. Pathophysiology of tinnitus. Ann Otol Rhinol Laryngol. 1984;93(1 Pt 1):39–44. [PubMed] [Google Scholar]
- Moller AR. Neural plasticity in tinnitus. Progress in brain research. 2006;157:365–372. doi: 10.1016/S0079-6123(06)57022-0. [DOI] [PubMed] [Google Scholar]
- Moller AR. The role of neural plasticity in tinnitus. Progress in brain research. 2007;166:37–45. doi: 10.1016/S0079-6123(07)66003-8. [DOI] [PubMed] [Google Scholar]
- Moller AR, Rees A. Dynamic properties of the responses of single neurons in the inferior colliculus of the rat. Hear Res. 1986;24(3):203–215. doi: 10.1016/0378-5955(86)90019-5. [DOI] [PubMed] [Google Scholar]
- Nondahl DM, Cruickshanks KJ, Wiley TL, Klein R, Klein BE, Tweed TS. Prevalence and 5-year incidence of tinnitus among older adults: the epidemiology of hearing loss study. J Am Acad Audiol. 2002;13(6):323–331. [PubMed] [Google Scholar]
- Norena AJ, Eggermont JJ. Changes in spontaneous neural activity immediately after an acoustic trauma: implications for neural correlates of tinnitus. Hear Res. 2003;183(12):137–153. doi: 10.1016/s0378-5955(03)00225-9. [DOI] [PubMed] [Google Scholar]
- Norena AJ, Tomita M, Eggermont JJ. Neural changes in cat auditory cortex after a transient pure-tone trauma. J Neurophysiol. 2003;90(4):2387–2401. doi: 10.1152/jn.00139.2003. [DOI] [PubMed] [Google Scholar]
- Penner MJ, Bilger RC. Adaptation and the masking of tinnitus. J Speech Hear Res. 1989;32(2):339–346. doi: 10.1044/jshr.3202.339. [DOI] [PubMed] [Google Scholar]
- Potashner SJ, Suneja SK, Benson CG. Altered glycinergic synaptic activities in guinea pig brain stem auditory nuclei after unilateral cochlear ablation. Hear Res. 2000;147(12):125–136. doi: 10.1016/s0378-5955(00)00126-x. [DOI] [PubMed] [Google Scholar]
- Seki S, Eggermont JJ. Changes in cat primary auditory cortex after minor-to-moderate pure-tone induced hearing loss. Hear Res. 2002;173(12):172–186. doi: 10.1016/s0378-5955(02)00518-x. [DOI] [PubMed] [Google Scholar]
- Stouffer JL, Tyler RS. Characterization of tinnitus by tinnitus patients. J Speech Hear Disord. 1990;55(3):439–453. doi: 10.1044/jshd.5503.439. [DOI] [PubMed] [Google Scholar]
- Suneja SK, Potashner SJ, Benson CG. Plastic changes in glycine and GABA release and uptake in adult brain stem auditory nuclei after unilateral middle ear ossicle removal and cochlear ablation. Exp Neurol. 1998;151(2):273–288. doi: 10.1006/exnr.1998.6812. [DOI] [PubMed] [Google Scholar]
- Tonndorf J. A common genesis of hearing loss, tinnitus, and recruitment in a number of acute cochlear lesions. Trans Sect Otolaryngol Am Acad Ophthalmol Otolaryngol. 1977;84(2):475. [PubMed] [Google Scholar]
- Tonndorf J. Tinnitus and physiological correlates of the cochleo-vestibular system: peripheral; central. The Journal of laryngology and otology. 1981;4:18–20. [PubMed] [Google Scholar]
- Turner JG, Brozoski TJ, Bauer CA, Parrish JL, Myers K, Hughes LF, Caspary DM. Gap detection deficits in rats with tinnitus: a potential novel screening tool. Behav Neurosci. 2006;120(1):188–195. doi: 10.1037/0735-7044.120.1.188. [DOI] [PubMed] [Google Scholar]
- Tyler RS, Stouffer JL. A review of tinnitus loudness. Hearing Journal. Hearing Journal. 1989;42:52–57. [Google Scholar]
- Wang J, Ding D, Salvi RJ. Functional reorganization in chinchilla inferior colliculus associated with chronic and acute cochlear damage. Hear Res. 2002;168(12):238–249. doi: 10.1016/s0378-5955(02)00360-x. [DOI] [PubMed] [Google Scholar]
- Zhou J, Shore S. Convergence of spinal trigeminal and cochlear nucleus projections in the inferior colliculus of the guinea pig. J Comp Neurol. 2006;495(1):100–112. doi: 10.1002/cne.20863. [DOI] [PubMed] [Google Scholar]


