

Abstract
We explored frequency and intensity encoding in the inferior colliculus of the C57 mouse model of sensorineural hearing loss. Consistent with plasticity reported in the IC of other models of hearing loss, frequency response areas (FRAs) in hearing impaired (HI) mice were broader with fewer high-frequency units than normal-hearing (NH) mice. The broad FRAs recorded from HI mice had lower cutoffs on the low frequency edge of the FRA. Characteristic frequency (CF) and sharpness of tuning (Q10) calculated from the FRA were used to divide the sample into 4 categories: low-CF sharp-FRA, low-CF broad-FRA, high-CF sharp-FRA, and high-CF broad-FRA units. Rate-intensity functions (RIFs) for CF tones and noise were used to determine the minimum and maximum response counts as well as the sound pressure levels resulting in 10%, 50%, and 90% of the maximum spike count. Tone RIFs of broad FRA units were shifted to the right of tone RIFs of sharp FRA units in both NH and HI mouse IC, regardless of the unit CF. The main effects of hearing loss were seen in the noise RIFs. The low-CF broad-FRA units in HI mice had elevated response to noise, and the high-CF sharp-FRA units in HI mice had lower maximum rates, as compared to the units recorded from NH mice. These results suggest that, as the IC responds to peripheral hearing loss with changes in the representation of frequency, an altered balance between inhibitory and excitatory inputs to the neurons recorded from the HI mice alter aspects of the units’ intensity encoding. This altered balance likely occurs, at least in part, outside of the IC.
Keywords: plasticity, sensorineural hearing loss, C57 mouse, intensity encoding, central auditory nervous system
Sensorineural hearing loss occurs in almost 10% of the US population. One of the most debilitating side effects of this condition is difficulty with word comprehension, particularly when the listening environment is noisy (Needleman and Crandell, 1995). Treatment of hearing loss includes amplification, but it cannot be assumed that amplification restores normal perception. For instance, hearing loss alters the frequency tuning curves and rate-intensity functions (RIFs) in central auditory neurons (Willott, 1984, Willott, 1986), and these deficits cannot be compensated by simple amplification alone. In addition, the sensitivity of the auditory system of hearing impaired listeners may be altered by long-term amplification. For example, elderly listeners who were experienced with hearing aids rated sounds as less intense than listeners with equivalent hearing impairment but without hearing aid experience, that is, an 80 dB sound seemed less loud after hearing aid use (Philibert et al., 2002). Thus, treatment of hearing loss may induce changes in the auditory system. Knowledge of the effects of hearing loss on central auditory units is critical to understand how the CNS processes sound both before and after treatment of hearing loss, and to developing novel and effective treatments directed toward identified central processing deficits.
While direct physiological study of the central effects of hearing loss is not possible in human subjects, animal models of hearing loss are available to researchers. One is the C57BL/6 (C57) inbred mouse strain, which is homozygous for the recessive Ahl gene. C57 mice lose 50% of their basal inner hair cells by 3 months of age and this loss progresses toward the apex with age until it is almost complete at 26 months (Willott et al., 1991, Spongr et al., 1997). Spiral ganglion cell density also decreases during the first year of life, particularly in the basal region of the cochlea (Willott et al., 1991; Spongr et al., 1997). A concomitant high frequency hearing loss (Davis et al., 2001; Noben-Trauth et al., 2003) is observed as early as 3 months of age. It becomes severe by 7 months and by 16 months of age this strain has very little auditory function as measured by the auditory brainstem response (ABR; Li and Borg, 1991). Because of these characteristics, the C57 strain can be used as a model system for hearing loss in which the hearing loss develops gradually, as often happens in humans exposed to intermittent loud sounds or to ototoxic drugs such as aspirin.
A behavioral manifestation of cochlear changes in the C57 mouse can be seen in the acoustic startle reflex (ASR). Willott and colleagues (Parham and Willott, 1988, Willott et al., 1994) have found that elevated stimulus levels were needed to elicit a startle response for tones above 12 kHz in 6 mo old C57 mice, and for tones above 4 kHz in 10 mo old C57 mice (see also Ison and Allen, 2003). Surprisingly, the magnitude of the ASR to 4 kHz tones increases in C57 mice older than 4 months of age (Ison et al., 2005). Moreover, the ability of low frequency tones to inhibit the ASR (a measure of tone detection) was improved in 6-12 mo old C57 mice (Willott and Turner, 2000). These improvements in the ASR at lower frequencies suggest that high frequency hearing loss is not the only sequela of the Ahl gene.
Indeed, these increases in sensitivity to low-frequency tones could be accounted for by changes in the central auditory system detailed in the pioneering work of Willott and colleagues (Willott et al., 1984a, Willott, 1986, Willott et al., 1988, Willott et al., 1991, Willott et al., 1993). In young C57 mice the IC is tonotopically organized such that neurons with low (<15 kHz) characteristic frequencies (CFs, the frequency with the lowest threshold) are found in the dorsal half of the IC and neurons with high CFs (>15 kHz) are found in the ventral half. However, by 7 months of age, CFs become concentrated in the 8-15 kHz range throughout the dorsal-ventral extent of the IC. No units with CF >32 kHz were found after 7 months of age (Willott, 1984; Willott et al., 1988; Willott et al., 1991). Note the correspondence of these changes to the hearing losses documented by ABR and ASR, described above. Remarkably, the low- to mid-frequency CF units in the dorsal cochlear nucleus and IC of the older C57 mice had lower minimum thresholds than those measured in the ventral cochlear nucleus (Willott, 1986; Willott et al., 1991). These changes may be neural correlates of the improved ASR observed at lower frequencies (Willott and Turner, 2000). Finally, the IC frequency response areas (FRAs) recorded from C57 mice older than 7 months were generally broader than those recorded in the 1 mo old C57 mice (Willott, 1986). Interestingly, the incidence of nonmonotonic RIFs was lower in the older C57 mice (Willott et al., 1988).
Such observations are not limited to the C57 mouse model of hearing loss. Similar loss of the CF/depth relationship in the ventral IC was found in adult chinchillas whose hearing, as measured using ABR, was compromised after they had been given amakacin shortly after birth (Harrison et al., 1998). In that study, cochlear histology found damage consistent with the ABR results. Tonotopic changes can be observed almost immediately: after recording a FRA in cat IC using a fixed electrode, Snyder & Sinex (2002) made a mechanical lesion in the spiral ganglion to induce a hearing loss limited to a narrow range of frequencies. In less than 90 minutes post-lesion they found that the unit’s CF had shifted away from the lesion. Units had increased tone thresholds at the lesion frequencies, with unchanged or decreased thresholds at other frequencies in the FRA (Snyder and Sinex, 2002). These authors attributed their results to decreased excitation at the original CF and increased excitation at the post-lesion CF. Irvine et al. (2003) made mechanical lesions in cat cochlea resulting in high frequency hearing loss as measured by the compound action potential, and found that the CFs of units in the ventral IC ceased to increase with depth. Their post-lesion thresholds were elevated and within the range that would have been observed if the unit’s pre-lesion FRA had simply been truncated above the lesion frequency. Because of this they attributed the shift in CF to residual responses rather than unmasking or tonotopic reorganization.
However, when acoustic trauma was used to induce high frequency hearing loss, the pre- and post-exposure FRAs observed in chinchilla IC had the same CFs and thresholds (Wang et al., 1996). In this experiment, the post-exposure measures were obtained within one hour of the trauma, and it may be that the effects of noise trauma develop over a longer period of time than the effects of mechanical trauma. In addition, the trauma-induced lesions may involve a larger range of frequencies than mechanical lesions. The post-trauma FRAs were broadened on the low-frequency side and inhibitory sidebands were smaller, especially if the pre-lesion FRA had been narrow. FRAs that were closed pre-lesion became more open, and RIFs became more monotonic with higher driven spike counts, consistent with a change in the balance of inhibition and excitation in the auditory system. This suggests that changes in the balance of excitatory and inhibitory inputs to IC neurons may also play a role in central reorganization after hearing loss.
Thus, a variety of cochlear pathologies have been shown to result in reorganized maps, broader FRAs, and altered RIFs in the central auditory system, but the extent to which different mechanisms contribute to these changes is not at all clear. An examination of pre- and post- hearing loss RIFs may be informative here. If reorganization of the FRAs is simply the result of the loss of inputs to the high frequency side of the FRA (the residual FRA hypothesis), we would not expect the spike count in RIFs to change. If reorganization could be driven by changes in the balance between inhibition and excitation in the IC and/or any nuclei sending input to the IC (the inhibitory/excitatory hypothesis) we would predict that the driven activity in the RIFs would increase.
In addition, it is not known how spike count and threshold are dependent on CF and FRA shape. For instance, the response of units with sharp FRAs to noise may be lower than it is to tones, as inhibitory sidebands shaping them are stimulated by stimuli that include frequencies falling into these sidebands. If plastic changes associated with hearing loss cause the truncation of the high side of the FRA, than the response to tones and noise may be reduced in tandem. On the other hand, if the plastic changes involve the loss of the low frequency sideband, then the response of these units to broadband noise may become greater than their response to tones. Although it is likely that both truncated FRAs and altered inhibitory/excitatory balances contribute to plasticity in the IC, an examination of the relative responses to tones and noise in the IC of normal-hearing and hearing-impaired animals may prove informative.
The purpose of the current study was to further examine how units with different CFs and different FRA shapes encode intensity both before and after hearing loss. Following Willott’s (1984) report showing a loss of units with CF’s >15 kHz in the IC of C57 mice of 7 months and older, we split our sample at 15 kHz into low-CF and high-CF units because the effects of hearing loss on tone and noise RIFs may differ in the two CF ranges. Using a slightly stricter criterion than Ramachandran et al. (1999), we split the sample at Q10 = 6.00 into broad and sharp FRA units. The characteristics of rate/intensity functions were measured as in earlier RIF studies (Costalupes et al., 1984; Phillips and Hall, 1986; Rees and Palmer, 1988).
EXPERIMENTAL PROCEDURES
Animals
Single units were recorded from the right ICs of 8 C57/BL6 mice between 24 and 61 days of age, and 15 C57/BL6 mice between 183 and 300 days of age. The mice were bred in the University of Rochester Vivarium from a breeder pair obtained from Jackson Laboratories, and kept on a 12/12 hour light/dark cycle with ad lib water and food pellets. The ambient noise level in the Vivarium was less than 50 dB SPL from 2-20 kHz. Most of the noise energy was below 16 kHz, and the noise levels at 16 kHz were around 25 dB SPL. The mean ABR thresholds of C57 mice aged 21-64 days (150 mice) and 182-301 days (113 mice) were measured for at least 6 frequencies between 3 kHz and 48 kHz and found to differ by an average of 21.92 dB. On the basis of the consistent differences in the thresholds, the 24-61 day old mice were termed “normal hearing” (NH) and the 183-300 day old mice “hearing impaired” (HI). All procedures were fully approved by the University Committee on Animal Resources.
Surgery
Mice were anesthetized with tribromoethanol (Avertin® 2 mg per 10 g body weight i.p.) supplemented with methoxyflurane (Metafane®) inhalation as needed. The cranium was exposed, 2% lidocaine was applied to the wound, and a small metal tube was glued to the skull surface. An indifferent electrode made from tungsten wire was implanted in the skull so that it contacted the dura mater. Mice were allowed to recover at least one day before an experimental session.
For recording, mice were tranquilized with chlorprothixene (Taractin®, 5-12 μl per g i.m.) and, at least 30 minutes before recording, briefly anesthetized with methoxyflurane inhalation so that the IC could be localized stereotaxically (Slotnick and Leonard, 1975) and exposed by craniotomy. The head was immobilized by bolting the metal tube to a custom stereotaxic frame (Newport-Klinger) that was located in a heated (28-30° C) chamber (IAC) lined with sound-absorbing foam (Sonex®). Single units were isolated using conventional electrophysiological techniques, and action potentials (at least 2:1 SNR) were recorded using tungsten wire microelectrodes (WPI, tip impedance 1MΩ) or glass micropipettes (A-M systems) filled with either 3M KCL (tip impedance of 8-12 MΩ) or 10% horseradish peroxidase solution in normal saline, and there was no bias in the type of electrode used to record the units in each group. Recording sessions typically lasted 8-10 h. If at any time a mouse showed signs of discomfort, it was removed from the apparatus. Bone wax was used to protect the brain between sessions. Mice completed no more than 5 sessions, all within 14 days of surgery, and rested for at least one day between sessions. Units shown by histological analysis to be outside the IC were excluded from the study.
Stimuli
Stimulus generation was controlled with a personal computer using a digital signal-processing platform (TDT AP2) and custom software to control stimulus timing (TG6 clock) and spike acquisition (TDT spike discriminator SD1 and event timer ET1). Noise was digitally generated, equalized to within +/- 2 dB from 2 to 54 kHz by measuring the transfer function at the entrance to the external meatus (1/4” B&K microphone), inverting this function, and multiplying the inversion by the original noise buffer. Noise bursts were “fresh” in that segments were selected at random from a 7.2 s-long normalized buffer at temporally discrete points for every stimulus repetition. All stimuli were shaped by cosine-squared rise/fall times. Stimuli were transduced using a 16 bit DAC (DA3), attenuated (PA4), amplified (McIntosh M40) and presented from a high-frequency leaf tweeter (Panasonic TH-400) placed at 60° azimuth contralateral to the recording site, 22.5 cm from the ear of the mouse. Search stimuli were 70 dB SPL noise bursts, 100 ms long, and were presented at a rate of 4/s. When a unit was isolated, its characteristic frequency (CF) and minimum threshold were audiovisually determined. CF tone and noise rate-intensity functions (RIFs) were measured for each unit from at least 10 dB below, to 80 dB above threshold (or until evoked potential artifact was observed in the recording) in 5 dB steps, using 100 ms stimuli with 1 ms rise/fall times presented 4 times per sec for 25 repetitions at each intensity level.
Frequency FRAs were obtained by presenting 25 ms tones (30 ms acquisition time, 100 ms ISI) with 72 frequencies spaced equally (24 points per octave) across 3 octaves centered on the audiovisual CF, at 15 intensities separated by 5 dB steps. The lowest intensity was chosen to extend below the unit’s audiovisual threshold, and in no case was the highest intensity above 80 dB SPL. Each tone was presented once in pseudorandom order, but for units with low response rates up to 2 additional samples were taken. This procedure is adapted from Sutter and Schreiner (1991).
Data Analysis
FRAs were represented as 2 dimensional plots, with frequency on the abscissa and intensity on the ordinate. An example is shown in Fig. 1a. The neural response to each frequency/intensity combination is represented by a vertical line, with the thickness of each line proportional to the number of spikes. Following the method of Sutter and Schreiner (1991), the spontaneous count was estimated by averaging the spike counts in the 9-frequency by 5-intensity array located at the lower left (low intensity, low frequency) corner of the FRA, outside the range of response. The data were then smoothed using a 3-frequency by 3-intensity moving average, and the smoothed spike counts were compared to the estimated spontaneous count. Spike counts at least 20% over the estimated spontaneous count were considered to be driven responses. The CF and threshold values reported below are those determined from the FRA, where CF was the frequency that elicited a driven response at the lowest intensity, and that intensity was considered to be the threshold using the 20%-above-background-criterion. The highest frequency resulting in a driven response at each 5 dB increment above threshold was also determined. The regression line through these points defined the high-frequency edge of the FRA. The low frequency edge was defined in similar fashion. The slopes of these regression lines were calculated and used to find the low- and high-frequency cutoffs at 10 dB above threshold, designated by the intersection of the gray and black lines in the figure. These calculations were performed in MATLAB®, and an example of the resulting FRA analysis shown in Fig. 1b. Q10 values were found by placing the high-and low-frequency cutoffs into the formula used by other researchers (e.g., Kiang and Moxon, 1974, Willott, 1986, Schreiner and Langner, 1988):
Fig. 1.
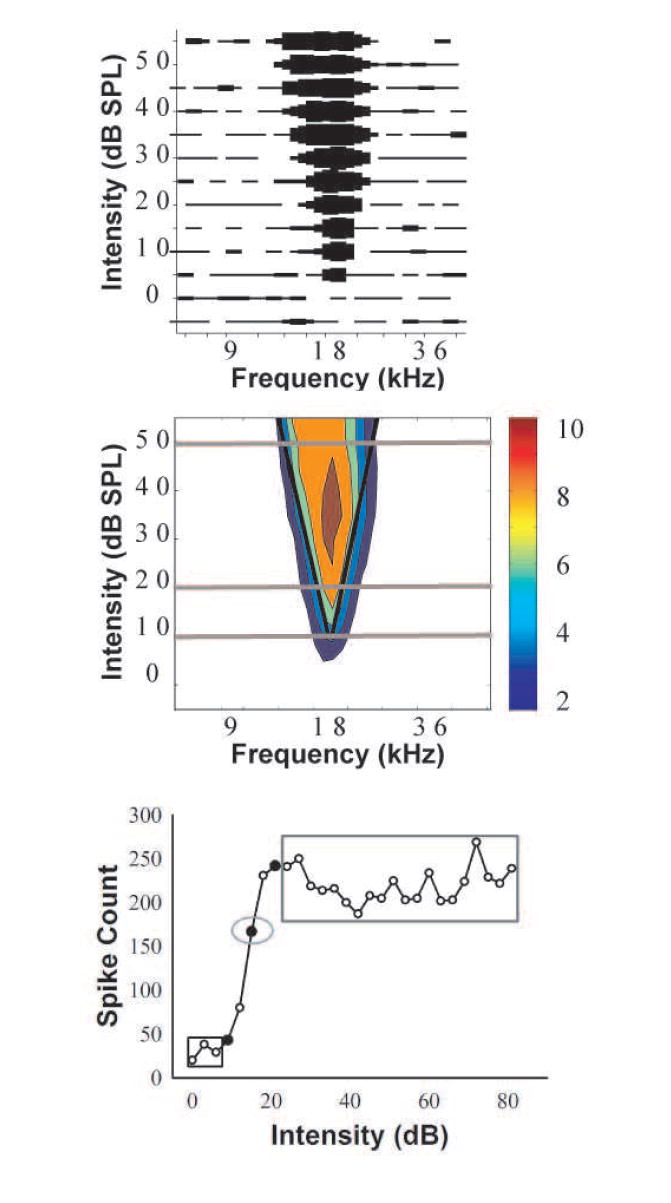
a) This is the raw FRA of an IC unit from a 2-mo-old NH C57 mouse. Driven activity is depicted by the thickness of the line at each frequency/intensity combination, and narrower lines indicate fewer spikes. In this example, the thickest bar represents 12 spikes. b) The smoothed FRA following automated analysis (see Methods) with the number of spikes indicated by color (color bar legend is shown to the right, and the maximum smoothed spike count is 10). The black lines indicate the best fit regression through the low- and high- frequency cutoffs, and define the driven response. These lines intersect at the CF. The gray lines denote the intensities representing the threshold, 10 dB above threshold, and 40 dB above threshold, and are extended beyond the FRA in order to increase their visibility. c) A sample RIF demonstrating the 3 intensity and 3 count measures obtained from each neuron. The 10% intensity is indicated by the leftmost filled circle, and the counts elicited by each of the three intensities below the 10% intensity, enclosed by the black rectangle, are averaged for the minimum count. The 50% intensity is indicated by the middle filled circle, and the spike count elicited by this intensity, enclosed by the gray oval, is the 50% count. The 90% intensity is indicated by the filled circle to the left of the 50% intensity. The counts elicited by each of the 20 intensities that were greater than the 90% intensity are enclosed by the gray rectangle, and these were averaged to yield the maximum count.
Based on earlier studies, the sample was divided into low-CF and high-CF units at 15 kHz (Willott, 1984), and within each frequency range into broad and sharp FRA units. Neurons having Q10s >= 6.00 were classified as sharp and the remaining units were classified as broad, a slightly stricter criterion than Ramachandran et al. (1999). The Q10 of 6.00 divided the entire sample composed of all units recorded from both NH and HI mice into approximately equal-sized groups of broad and sharp FRAs.
The RIFs were analyzed using spike counts within an analysis window of 50 ms starting with the onset of the stimulus. Rollover coefficients were calculated by dividing the spike count at the highest intensity by the maximum spike count. A rollover coefficient <0.80 was taken to indicate a nonmonotonic rate-intensity function. This criterion is similar to that used by Rees and Palmer (1988). There were 8 response types in the sample: on, on-sustained, on-pause, primary-like, sustained, on-off, buildup and inhibitory, defined as in previous studies (Willott et al., 1988; Le Beau et al., 1996; Wang et al., 1996; Barsz et al., 1998).
For each RIF, spike counts were first smoothed using a 3-intensity moving average. Smoothed RIFs were then normalized by subtracting the count at the lowest intensity from each count in the series, and then dividing each result by the greatest count in the series. Then 6 measures were derived from each RIF: 3 intensity measures and 3 count measures. The 3 intensity measures were the intensities at which the spike counts were 10% (10% intensity), 50% (50% intensity), and 90% (90% intensity) of the maximum count of the normalized RIF (Phillips and Hall, 1986, Rees and Palmer, 1988). An example RIF is shown in Fig. 1c, with the 10% intensity, 50% intensity, and 90% intensity indicated by the left, middle, and right filled circles, respectively. The 3 count measures were the minimum count, 50% count and maximum count. The minimum count was calculated by averaging the raw (not normalized) spike counts elicited by intensities below the 10% intensity, enclosed in the black rectangle in the figure. The 50% count for each RIF was the interpolated raw spike count elicited by the 50% intensity, and this is enclosed by the gray oval in the figure. The maximum count was the average of the raw spike counts elicited by each intensity above the 90% intensity. These counts are enclosed by the gray rectangle in the figure. Differences in proportions were tested with χ2. All other statistical comparisons were made with ANOVAs and t-tests performed upon the entire sample of data points (SPSS®).
RESULTS
The results are based on 90 IC units from NH mice and 156 IC units from HI mice. The CF of each unit is plotted against its threshold in Fig. 2a. All of the units with thresholds below 15 dB SPL were recorded from the NH mice, as were most of the units with CFs above 15 kHz. These observations are consistent with the mean ABR thresholds of the C57 colony mice shown in Fig. 2b. Typically, the HI mice had elevated ABR thresholds as compared to the NH mice, especially at high frequencies. We attempted to sample units across the complete dorso-ventral extent of the IC in both the HI and NH mice. The proportion of units at each recording depth in the IC, plotted in Fig. 2c, shows that the depths sampled within the IC were quite similar in the two groups of mice.
Fig. 2.
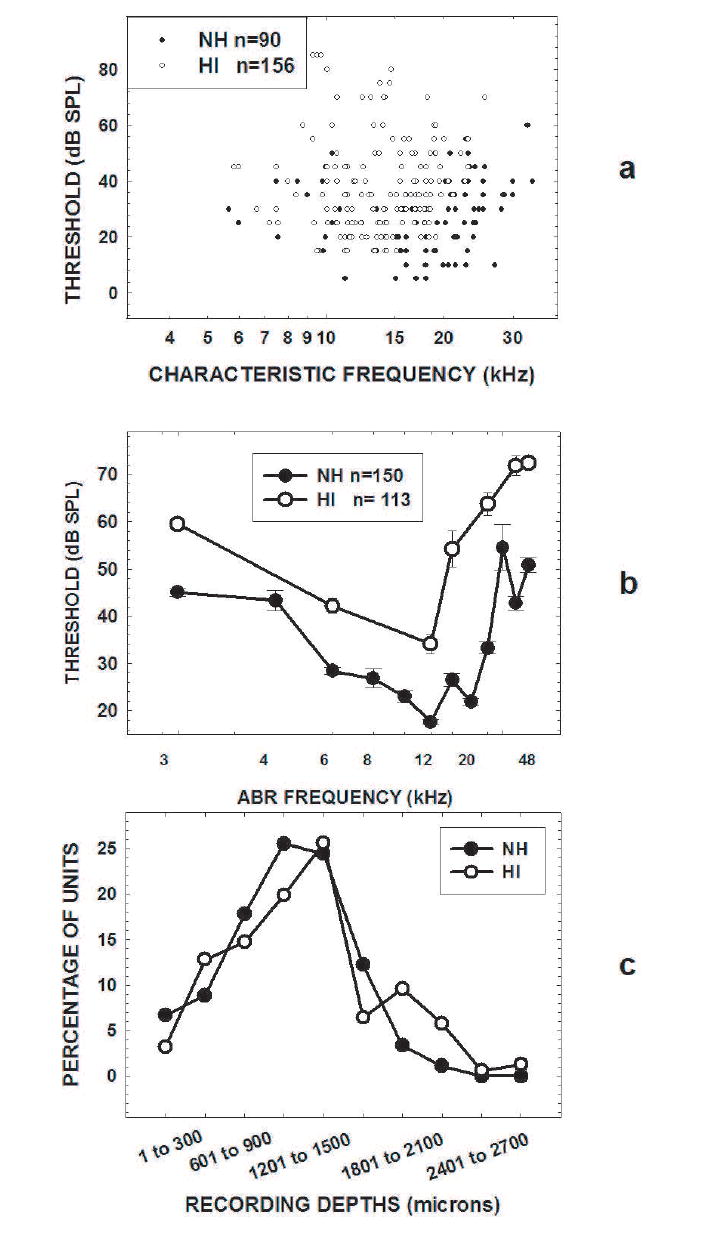
a) The scatter plot shows the CF and threshold of each unit included in the analysis. The filled circles represent units recorded from NH mice and open circles represent those recorded from HI mice. The CFs have been jittered to separate the points as much as possible. Note that fewer high-CF units were recorded from HI mice. b) Mean ABR thresholds (with standard error bars) for the 150 21-64 day old (NH, filled circles) mice and the 113 182-301 day old (HI, open circles) C57 mice in our colony. These thresholds are consistent with the single unit CF tone thresholds in Fig. 2a. Note that some standard errors bars are so small that they are covered by the symbols. c) Proportions of units recorded at different depths (300-μm bins) from NH mice (filled circles) and HI mice (open circles) do not differ systematically.
Tonotopic Reorganization
As expected, the HI mice had lower CFs (Mean=14.080 kHz, SE=0.307) than the NH mice (Mean=19.081 kHz, SE=0.650, p<.05) and, because the CFs were weighted to lower frequencies, the variability in CF was also lower in HI mice (HI SE=306.5, NH SE=650.4, p<.05). In general, the CFs in the HI mice were generally shifted toward more mid-range frequencies. Among units with CFs below 15 kHz (low-CF), the mean CF was significantly lower in NH mice (Mean = 9.623 kHz, SE = 0.506) than for HI mice (Mean = 11.600 kHz, SE = 0.222, p<.05). Among units with CFs above 15 kHz (high-CF), the mean CF was significantly lower in HI mice (Mean = 18.052 kHz, SE = 0.284, p<.05) than the NH mice (Mean = 21.445 kHz, SE = 0.504). Although the average threshold of low-CF units was lower in the NH mice (Mean = 29.2 dB SPL, SE = 2.8) than in the HI mice (Mean = 37.4 dB SPL, SE = 2.0), this difference was not significant (p>.05). In contrast, the average threshold of high-CF units was significantly lower in the NH mice (Mean = 26.7 dB SPL, SE = 1.5) as compared to the HI mice (Mean = 38.9 dB SPL, SE = 3.2, p<.05).
The shape of the FRAs was also examined. In HI mice, a greater proportion of FRAs were classified as broad as compared to the NH mice (NH = .45, HI = .68, p<.05), and Fig. 3a shows this effect in every frequency range except between 5-10 kHz. The high and low Q10 frequency cutoffs are plotted against each other in Fig. 3b, which shows that the low frequency cutoff increases with the high frequency cutoff (r = .82, p<.05) for both broad-FRA (squares) and sharp-FRA (inverted triangles) units. Nearly all the sharp FRAs from both the NH and HI mice were located above the 95% confidence intervals (solid lines) around the regression line (omitted for clarity) and close to the diagonal indicating that their high frequency cutoffs were similar to their low frequency cutoffs, as would be expected of sharp FRAs. In contrast, units whose data points fall below the unity line indicate that the low frequency cutoff is systematically reduced and it is noteworthy that most such units are derived from the HI animals. In fact, all of the furthest outliers from the diagnonal are from HI animals: 15% of the broad FRAs recorded from the NH mice (filled squares) fell below the 95% confidence interval, versus 30% of the broad FRAs recorded from the HI mice (open squares).
Fig. 3.
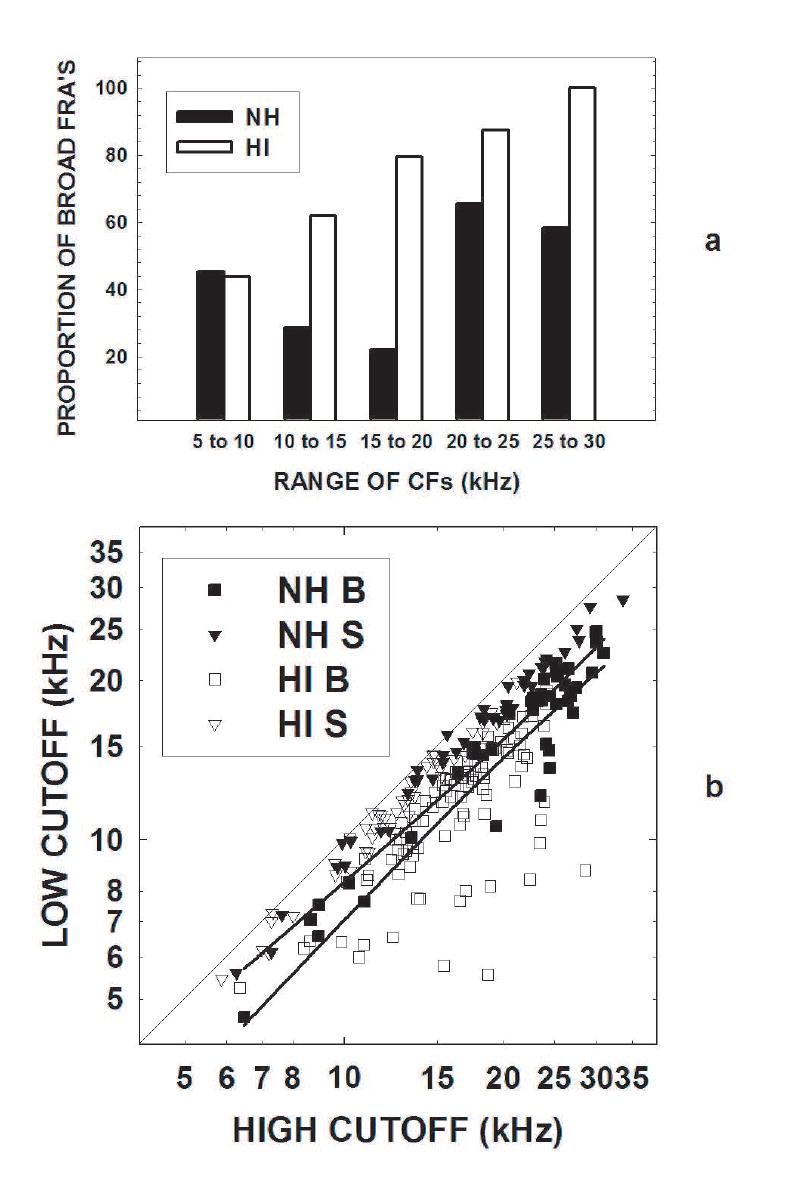
a) This bar graph shows the percentage of broad FRAs in 5 kHz-wide frequency bins from 5 to 30 kHz (solid bars for the NH mice, open bars for the HI mice). Note that the proportion of broad FRAs was greater in HI mice than in NH mice above 10 kHz. b) In order to show the effect of hearing loss on the relationship between the low- and high-frequency FRA cutoffs measured 10 dB above threshold, the cutoffs for each unit are plotted for the NH (closed symbols) and HI (open symbols) units. Sharp (S) units are plotted as inverted triangles and broad (B) units as squares. The solid lines indicate the 95% intervals around the regression line (all data, regression line not shown). If the cutoffs were equal, the data points would fall on the diagonal (gray dashed reference line). Instead, the low frequency cutoffs are typically lower than the high frequency cutoff, so that the data points fall below the line. The smallest difference between the cutoffs is 39.1 (for an HI unit); two other units had small differences: 48.6 (an NH unit) and 49.7 (an HI unit)However, the data points of the broad units recorded from the HI mice extend much further below the diagonal than data points recorded from the NH mice, and many fall below the 95% interval. This occurred because, for any given high frequency cutoff, the low frequency cutoffs are often lowest for the HI broad FRAs.
Response Types
The units were divided into the following four CF/FRA categories: low/sharp (low-CF sharp-FRA), low/broad (low-CF broad-FRA), high/sharp (high-CF sharp-FRA), and high/broad (high-CF broad-FRA). The proportion of on, on-sustained, on-pause, primary-like, sustained, on-off, buildup and inhibitory units were not significantly different (p>.05) in the HI as compared to the NH IC response types except for low/broad units. Among this group, there were more on (tone: 71%, noise: 71%) than on-sustained (tone: 28%, noise: 12%) or sustained (tone: 0%, noise: 0%) response types among the units recorded from NH mice (p<.05), but more on sustained (tone: 54%, noise: 66%) than on (tone: 28%, noise: 12%) or sustained (tone: 8%, noise: 14%) response types among the units recorded from HI mice (p<.05). The remaining units (NH – tone: 1%, noise: 10%; HI – tone: 18%, noise: 8%) were distributed among the other 5 response types.
RIFs
Example RIFs for each CF/FRA category are shown in Fig. 4. Each curve represents one of the units in the sample. Fig. 4a shows the response of low CF units to tones. The RIFs of the broad units (squares) are shifted to the right of those of the sharp units (inverted triangles) in both the NH (gray) and the HI (black) mice. The responses of 4 low CF units to noise bursts are plotted in Fig. 4b. In the NH group (gray), the broad unit (squares) had a very low spike count as compared to the other units in this panel, and with a rollover coefficient of 0.4 was strongly nonmonotonic. The NH sharp unit’s RIFs (grey inverted triangles) also had lower maximum counts than the two HI RIFs.
Fig. 4.
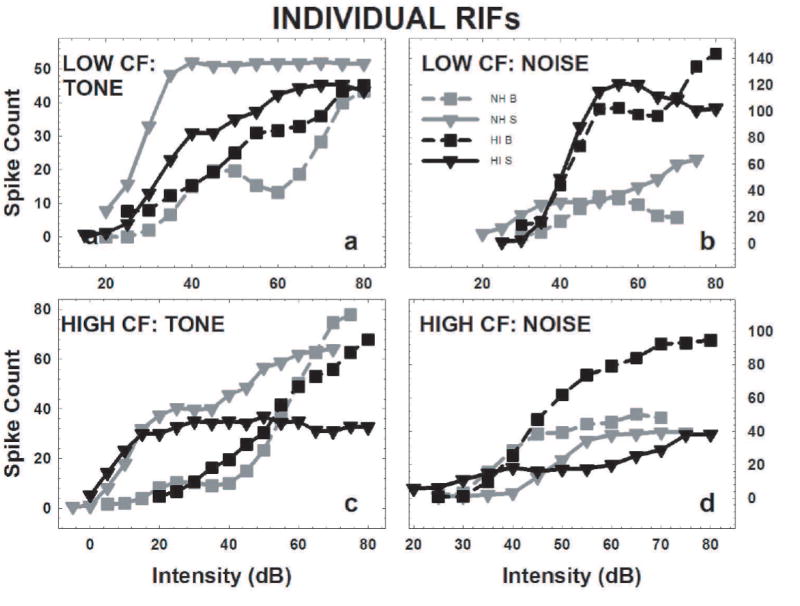
The RIFs of 8 NH units and 8 HI units illustrate how units in each CF/FRA category responded to CF tones and noise bursts that varied in intensity. Each of these RIFs was smoothed using a 3 intensity moving average in the same manner as the rest of the RIFs in the sample. The RIFs for the units with sharp (S) FRAs were displayed using inverted triangles, with the solid lines representing the fitted functions. Broad (B) FRAs are indicated by squares and dashed lines. RIFs obtained from NH IC are in gray, and RIFs obtained from HI IC are in black. The spike count tick labels were included on the right for ease of reading. a) The low/broad units’ tone-RIFs are shifted to the right of the low/sharp units’ tone-RIFs for both the NH and HI units. b) The NH low/broad units’ noise-RIF has the lowest response of any noise-RIF in this category. c) These high-CF tone-RIFs resemble those of the low CF units. d) The HI high/broad unit had the strongest noise response of the high-CF units shown here, and the noise-RIF of the NH high/sharp unit lay farthest to the right.
In the high CF examples, responses to tones (Fig. 4c) were very much like the low CF units in Fig. 4a, with the broad unit’s RIFs (squares) again shifted to the right of that of the sharp unit (triangles). However, in the HI mouse, the maximum count of the sharp unit (inverted triangles) was reduced. In response to noise (Fig. 4d) the broad and sharp units in the NH mice responded similarly. The broad unit in the HI example had the strongest noise response of the high-CF units shown here. Thus, the major differences between these NH and HI RIFs occurred in their response to noise rather than tones.
Similar trends can be seen in the mean RIFs shown for each category in Fig 5. Here, the mean 10%, 50%, and 90% intensities were plotted against the mean minimum, half, and maximum counts respectively for each of the CF/FRA categories to create the average RIFs shown in Fig. 5. Mean data and the standard errors are shown in Table 1 for tones and Table 2 for noise. To visualize how the averaged data points reflect the shapes of the RIFs in each category, they were fit with a 3-parameter sigmoid function (the solid/dashed lines in Fig. 5) using the following equation, where y is the spike count, a is the intercept, e ≈ 2.718 (the base of the natural logarithm), x is the intensity, X0 is the midpoint of the abscissa, and b is a parameter that governs the slope:
Fig. 5.
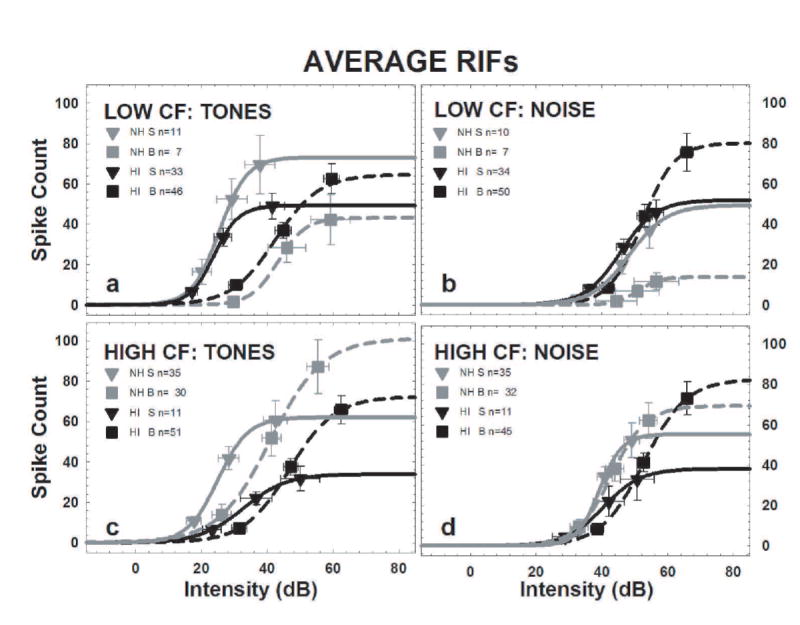
These average RIFs represent the central tendency of all the units in each CF/FRA category for the NH and the HI data. Each average RIF was constructed by plotting the count and intensity value at which the mean data, averaged for all units within the category, reached the 10%, 50%, and 90% points, and fitting those data points with a sigmoid function. Averages were calculated separately for NH and HI data, broad and sharp RIFs, and for CF tone and noise RIFs. The spike count tick labels were included on the right for ease of reading. The means for the units with sharp FRAs (S) were displayed using inverted triangles, with the solid lines representing the fitted functions. Broad FRAs (B) are indicated by squares and dashed lines. RIFs obtained from NH IC are in gray, and RIFs obtained from HI IC are in black. The minimum and maximum counts are themselves averages as described in the methods. a) The tone RIFs of the low/broad units RIFs were shifted to the right of the tone RIFs of the low/sharp units. There were no differences between the NH and HI mice and no systematic differences in the spike counts. b) The noise RIFs of NH low/broad units have striking low 50% and maximum spike counts. c) The tone RIFs of the high-CF units resemble those of the low-CF units. d) The noise RIFs of the HI high/broad units shifted to right of the HI high/sharp RIFs but the NH high/sharp RIFs were not shifted relative to the NH high/broad RIFs. The HI high/sharp RIFs had lower 50% and maximum counts than the other high CF noise RIFs. Note that, because of the hearing loss, there are more low frequency CFs in the HI mice.
Table 1.
The mean count and intensity values used to generate and plot the average tone-RIFs. The broad units’ RIFs have greater intensity values at the 10%, 50%, and 90% points, and the HI high/sharp RIFs have lower 50% and maximum counts.
| Category | Mean intensity | SE intensity | Mean count | SE count | |
|---|---|---|---|---|---|
| NH mice | |||||
| 10% | low/S | 20.23 | 2.88 | 16.40 | 6.18 |
| low/B | 29.76 | 1.40 | 1.64 | 0.90 | |
| high/S | 17.71 | 2.23 | 10.74 | 2.19 | |
| high/B | 26.17 | 2.89 | 13.76 | 5.06 | |
| 50% | low/S | 29.32 | 4.73 | 52.41 | 10.15 |
| low/B | 46.00 | 5.38 | 28.37 | 6.85 | |
| high/S | 28.29 | 3.17 | 41.77 | 5.76 | |
| high/B | 41.32 | 2.88 | 51.88 | 8.96 | |
| 90% | low/S | 37.82 | 4.60 | 69.47 | 14.39 |
| low/B | 59.31 | 5.54 | 42.29 | 11.55 | |
| high/S | 42.49 | 3.61 | 60.63 | 9.50 | |
| high/B | 55.44 | 3.29 | 87.06 | 13.19 | |
| HI mice | |||||
| 10% | low/S | 17.09 | 1.83 | 6.69 | 1.91 |
| low/B | 30.48 | 2.07 | 9.98 | 1.70 | |
| high/S | 23.22 | 2.83 | 6.50 | 1.46 | |
| high/B | 31.52 | 2.21 | 7.18 | 1.29 | |
| 50% | low/S | 26.62 | 2.65 | 33.53 | 4.51 |
| low/B | 44.85 | 2.40 | 36.89 | 3.77 | |
| high/S | 36.64 | 4.81 | 21.99 | 3.24 | |
| high/B | 47.21 | 2.16 | 37.51 | 4.09 | |
| 90% | low/S | 41.56 | 3.74 | 48.95 | 6.36 |
| low/B | 59.63 | 2.38 | 62.53 | 7.24 | |
| high/S | 50.11 | 5.99 | 31.70 | 6.13 | |
| high/B | 62.50 | 2.00 | 65.69 | 6.94 |
Table 2.
The mean count and intensity values used to generate and plot the average noise-RIFs. The NH low/broad units have low 50% and maximum counts, as do the HI high/sharp units.
| Category | Mean intensity | SE intensity | Mean count | SE count | |
|---|---|---|---|---|---|
| NH mice | |||||
| 10% | low/S | 32.59 | 2.13 | 3.00 | 0.80 |
| low/B | 44.41 | 5.82 | 1.76 | 0.66 | |
| high/S | 32.62 | 2.24 | 7.20 | 1.80 | |
| high/B | 33.11 | 2.70 | 9.50 | 3.40 | |
| 50% | low/S | 46.07 | 3.44 | 20.00 | 4.81 |
| low/B | 50.79 | 6.14 | 6.86 | 2.79 | |
| high/S | 40.84 | 2.33 | 34.23 | 5.02 | |
| high/B | 43.94 | 2.72 | 38.28 | 6.12 | |
| 90% | low/S | 54.51 | 3.78 | 36.96 | 9.00 |
| low/B | 56.56 | 6.29 | 11.62 | 33.83 | |
| high/S | 49.07 | 2.34 | 52.29 | 8.60 | |
| high/B | 54.16 | 2.68 | 62.07 | 8.68 | |
| HI mice | |||||
| 10% | low/S | 36.37 | 2.08 | 8.07 | 2.20 |
| low/B | 41.62 | 2.25 | 8.60 | 1.62 | |
| high/S | 28.84 | 3.91 | 4.45 | 1.78 | |
| high/B | 38.60 | 1.91 | 8.36 | 1.48 | |
| 50% | low/S | 46.68 | 2.26 | 28.59 | 3.93 |
| low/B | 53.04 | 2.24 | 44.06 | 5.54 | |
| high/S | 42.07 | 4.72 | 21.93 | 7.51 | |
| high/B | 52.70 | 1.84 | 41.31 | 4.48 | |
| 90% | low/S | 56.49 | 2.31 | 45.71 | 6.29 |
| low/B | 65.81 | 1.98 | 75.53 | 9.17 | |
| high/S | 50.76 | 5.19 | 32.88 | 10.46 | |
| high/B | 65.89 | 1.66 | 73.08 | 8.21 |
Note: S=sharp, B=broad
The average tone RIFs of the low CF units are shown in Fig. 5a. In general, tone RIFs for broad units (squares) were shifted to the right (higher intensities) than sharp units (triangles). That is, the mean 10%, 50%, and 90% intensities were all higher for broad units (squares) than for sharp units (triangles) in both the NH and HI groups (all p<.05). However, there were no significant differences in the tone RIFs of broad units between NH and HI mice (squares; p>.05), nor were there significant differences in the sharp RIFs (triangles) of the NH and HI groups. The mean spike counts did not differ systematically; in the NH mice the sharp units (gray triangles) had higher mean spike counts than the broad units (gray squares; all p<.05) but they did not differ from either of the HI average RIFs (all p<.05).
The average noise RIFs of the low-CF units are shown in Fig. 5b. The mean 90% intensity of the broad units of HI mice (black squares) was higher than the other 3 groups (p<.05). However, the most striking aspect of these average noise RIFs is the low maximum spike counts of the broad units in NH mice (p<.05 for the mean 50% and maximum counts); in contrast, the low/broad units in HI mice (gray squares) have high mean 50% and maximum counts (p<.05).
The average tone RIFs of the high CF units are shown in Fig. 5c. The mean 10%, 50%, and 90% intensities were all higher for the broad units (squares) recorded from both the NH and HI IC (p<.05). Thus, as seen in the low CF units, broad tone RIFs were shifted to the right of the sharp tone RIFs. The mean maximum count of the sharp RIFs in the HI mice (black triangles) units was low (p<.05) as compared to the other 3 groups. There were no other differences among the average high CF tone RIFs recorded from the NH and HI mice (p>.05).
The average noise RIFs of the high CF units are shown in Fig. 5d. The noise RIFs of the broad units were shifted to right of the sharp RIFs only in the HI group (p<.05 for all intensities). The broad RIFs were not shifted relative to the sharp RIFs in NH mice (p>.05). The sharp RIFs in HI mice (black triangles) also had lower mean 50% and maximum counts than the other high CF noise RIFs (p<.05)
In summary, broad RIFs were shifted to higher intensities as compared to sharp RIFs, except for high CF HI units responding to noise. The high/sharp units recorded from HI mice (black triangles) had consistently lower counts than the other high CF units. Finally, the noise RIFs of the NH low/broad units had low counts while those of the HI low/broad units had high counts.
Monotonicity
The proportion of nonmonotonic units in each category can be seen in Fig. 6a for NH mice. The NH low/broad units, when responding to noise, had the highest proportion of nonmonotonic responses (71%), and there was a significant correlation between the mean maximum count (shown above each bar) and the proportion of nonmonotonic units among the NH RIFs (r = .72, p<.05). The greater the number of nonmonotonic units in a category, the lower the mean maximum count was.
Fig. 6.
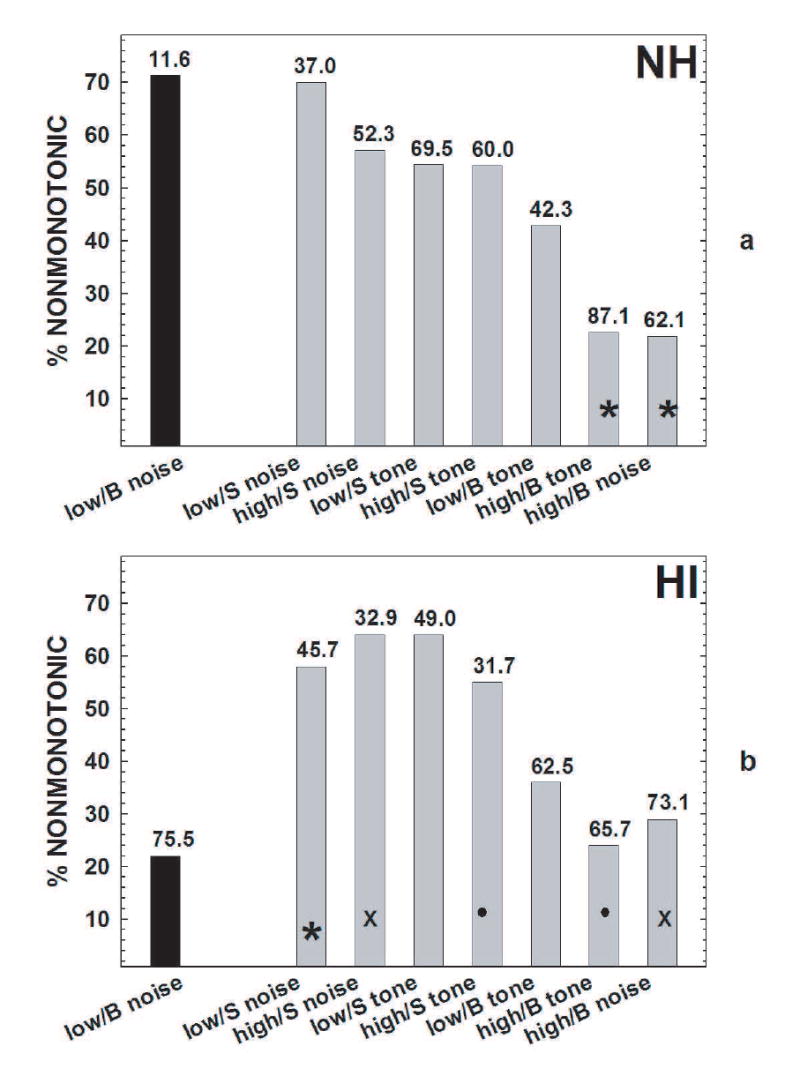
a) The proportion of nonmonotonic units for noise RIFs from low/broad units is indicated by the black bar. The gray bars show the proportion of nonmonotonic units in each of the other CF/FRA categories (low/sharp noise RIFs, high/sharp noise RIFs, low/sharp tone RIFs, high/sharp tone RIFs, low/broad tone RIFs, high/broad tone RIFs, and high/broad noise RIFs), ordered in descending proportions. The number above each bar is the mean maximum count in that category. The asterisks indicate the categories with proportions that are significantly different from the black bar (p<.05). Note that the low-CFs broad-FRA units (black bar) had a high proportion of nonmonotonic units and the lowest maximum count. b) The proportion of nonmonotonic units in the noise RIFs produced by low/broad units is indicated by the black bar. This proportion was significantly lower than among noise RIFs produced by low/sharp units, as indicated by the gray bar with the asterisk. The other gray bars show the proportion of nonmonotonic units in each of the other categories, ordered as in Fig. 6a. Among high-CF units, the sharp-FRA units had more nonmonotonic noise-RIFs (the gray bars marked by X’s) and tone-RIFs (the gray bars marked by filled circles) than the broad-FRA units. As in Fig. 6a, the numbers above the bars are the mean maximum counts in each category. Again, the rollover coefficient decreased (more nonmonotonic) with the maximum count.
Fig. 6b shows the proportion of nonmonotonic HI RIFs in each condition, with the order of conditions on the abscissa taken from Fig. 6a. The low/broad noise RIFs had significantly fewer nonmonotonic units (22%) than the low/sharp noise RIFs (58%, p<.05). Among high/sharp units, 55% of the tone-RIFs and 64% of noise RIFs were nonmonotonic, respectively while among high/broad units only 24% of the tone RIFs and 29% of the noise RIFs were nonmonotonic. This difference was significant for both the tone RIFs (bars marked with filled circles in Fig. 6) and noise-RIFs (bars marked with Xs, both p<.05), and corresponded to significant differences in the mean maximum count (see Fig. 5a and Fig. 5b: high CF sharp and broad tone RIFs and noise RIFs and the mean maximum count shown above the bars in Fig. 6b, both p<.05). The same significant correlation between the mean maximum count (shown above each bar) and the proportion of nonmonotonic units (r = .72, p<.05) occurred as in Fig. 6a: The more nonmonotonic units in a category, the lower the mean maximum count.
DISCUSSION
The current study demonstrates that normal excitatory FRA and intensity coding is disrupted by the severe sensorineural hearing loss in the C57 mouse. Although hearing loss develops as the C57 mouse ages, it has reached the severe to profound range before the mouse has lived out half its normal lifespan. The oldest mouse in our study was less than 1 year of age, and the median life span of the C57 strain is 27 months which can hardly be considered old. However, tonotopic reorganization in these HI mice was extensive, especially when compared to the tonotopic organization of old or very old CBA strain, which appears normal (Willott, 1986). Following earlier reports of IC tonotopic organization in the C57, we divided our sample into low CF and high CF units based on the 15 kHz in Willott (1984). Using a slightly stricter criterion than Ramachandran et al. (1999), we split the units within each CF range at Q10 = 6.00 into broad and sharp FRA units.
The development of hearing loss over the first year of life is seen in the C57 colony from which our sample mice were drawn (Fig. 2a) and is consistent with year-old C57 thresholds reported in the literature (Li and Borg, 1991; Willott et al., 1991). In the following discussion we will show the extent to which the tone and noise RIFS found in the NH mouse IC are altered in the HI mouse IC, and how changes in the balance of excitatory and inhibitory inputs, and/or residual FRAs, might contribute to these results.
Low CF Units
The number of units with low CFs encountered in the HI IC was significantly greater than in the NH IC even though the recording depths were quite similar to those sampled in the NH mice (Fig. 2c). This result is consistent with reports from Willott and colleagues (Willott et al., 1984b, Willott, 1986, Willott et al., 1991) as well as reports of altered topography with loss of peripheral input in the inferior colliculus of cats (Irvine et al., 2003) and chinchillas (Wang et al., 1996), and indeed other central auditory system nuclei (guinea pig auditory cortex: Robertson and Irvine, 1989, cat auditory cortex: Rajan et al., 1993, Eggermont and Komiya, 2000). It is likely that the low CF units observed in HI mice include units that were high/sharp units prior to the hearing loss. A greater proportion of low CF units may in turn contribute to the stronger behavioral response observed to low frequency tones found in HI C57 mice (Willott and Turner, 2000, Ison and Allen, 2003). Low CF units from HI mice also showed broadening on the low frequency side of the FRA (Fig. 3b), that is, in the frequency range of the remaining peripheral inputs. If the observed reorganization of the FRAs is simply the result of the loss of excitatory inputs to the high frequency side of the FRA (the residual FRA hypothesis), we would expect the spike count in these units to be maintained or reduced and the thresholds elevated (RIFs shifted to the right). An alternative explanation is that reorganization could be driven by changes in the balance between inhibition and excitation in the IC and/or nuclei sending input to the IC (the inhibitory/excitatory hypothesis). In this case we would predict that the driven activity to change. In this study, the tone RIFs of units with low CFs were not significantly shifted to higher intensities in the HI IC for units with broad or sharp FRAs (Figs. 5a and 5b), consistent with the inhibitory/excitatory hypothesis. In addition, while the tone response was not altered in the HI mice, there was an increase in the noise response of the HI low/broad units, again consistent with the inhibitory/excitatory explanation.
The increased responsivity of the HI low/broad units to noise (Fig. 5b) is also consistent with a reduction of inhibition after hearing impairment. Inhibitory input may be responsible for the normally sluggish response of the low/broad units to noise in normal hearing mice (Fig. 5b). The reduction in inhibition would appear to be off-CF, because the tone response of the NH low/broad units is not similarly suppressed, nor is the tone RIF altered after hearing-impairment. Thus, the balance between inhibitory and excitatory input to the high-frequency side of the FRA, perhaps originating outside the IC, may have been altered due to the peripheral deafferentation. This result is consistent with the observations that, after induced hearing loss, larger evoked excitatory synaptic responses are found in chinchilla IC neurons which respond with more spikes so that the RIFs become more monotonic (Wang et al., 1996). In other central auditory system nuclei, this phenomenon has been attributed to the loss of inhibition on the high-frequency side of the FRA (cochlear nucleus: Rajan and Irvine, 1998, auditory cortex: Rajan, 1998; Wang et al., 2002), and changes in the FRAs in these nuclei may alter the inputs to the IC. Although the HI mice in the present study are not old, they are uniformly older than the NH mice. Thus, age-related alterations in GABA and GABA receptors within the IC, which have been shown to develop with age (Gutierrez et al., 1994, Caspary et al., 1995, Caspary et al., 1999), may contribute to a change in the inhibitory/excitatory balance in the IC itself.
A final indicator of altered inhibition can be changes in the units’ temporal response patterns (Vater et al., 1992; Le Beau et al., 1996), and the low/broad units in this study changed towards more sustained responding in the HI IC. There is little consistency in the literature about the effects of hearing loss on response patterns. Wang et al. (1996) found that acoustic trauma had no effect on the on and on sustained units, although the pause in their on-pause units was shorter after the trauma. Willott et al. (1988) found no change in response type in their HI C57 mice, although they found an increase in spontaneous rate. Irvine et al. (2003) found that the onset response and late sustained response were affected similarly by the cochlear lesions that were used to create the hearing loss. Snyder and Sinex (2002) point out that a more restricted lesion, centered on the CF of a neuron, may not produce equivalent effects as a trauma-induced lesion. In addition, these studies did not separate their units on the basis of CF and FRA shape, which may have masked some interesting results.
Several different methods have been use to induce rapid reorganization of FRAs and many of the results support a change in the balance of excitation and inhibition. For example, using a two-tone stimulation paradigm to explore the inhibitory and excitatory FRAs, Mossop et al. (2000) performed a monaural cochlear ablation and found that, within minutes, the response of units in the IC contralateral to the ablation responded robustly to ipsilateral sounds. Although GABA synthesis decreased in the affected IC, this decrease was not found until 24 hours after the ablation and thus could not explain the change in the excitatory response. When the two-tone strategy is used to measure inhibitory sidebands, the off-CF tone is processed by all auditory system nuclei, so its inhibitory effect on the recorded IC neuron could derive from outside the IC. In contrast, iontophoretic applications of drugs directly onto the unit being recorded will affect only local inhibitory circuits. The application of GABA or glycine has been found to decrease the spike count in response to CF tones (Faingold et al., 1989, Le Beau et al., 1996), while the application of bicuculline or strychnine increases the response to tones (Le Beau et al., 1996, Palombi and Caspary, 1996a). However, the spontaneous rates were not affected (Le Beau et al., 1996), and the FRA bandwidth was rarely increased (Palombi and Caspary, 1996a). Thus, local inhibitory influences appear to be primarily on-CF, and truncating the high frequency side of an FRA could alter the on-CF inhibitory/excitatory balance, so that the “inhibitory/excitatory balance” explanation and the “truncated FRA” explanations of plasticity may not be entirely independent hypotheses.
Further, it has been shown that iontophoresis of GABA can change a unit’s tone RIF from nonmonotonic to monotonic, while blocking GABA with bicuculline could decrease monotonicity in some units (Faingold et al., 1991, Sivaramakrishnan et al., 2004). Their results highlight the complexity of inhibitory effects on responses, even when such effects are limited to local IC synapses. Interpretations of the effects of a peripheral insult, which may affect the excitatory/inhibitory balance at many nuclei in the auditory pathway, on the response of a single IC unit must therefore be approached with caution.
In both the NH and the HI IC, the low/broad units had tone RIFs shifted to higher intensities than the sharp FRA units, consistent with the observation of Ramachandran et al. (1999) that their type V units had higher tone thresholds than their type I units. Egorova et al. (2001) found similar threshold disparities between their Class I (sharper) and Class III (broader) neurons in the mouse IC, with the Class III units having higher thresholds. The increased threshold of the low/broad units relative to the low/sharp units may be the result of inhibitory inputs which are active at low levels and which prevent responses to low-level CF tones. Alternatively, low/broad units may have membrane properties that make them less sensitive, or perhaps their inputs come from more peripheral neurons with higher thresholds. In any case, the finding that the HI RIFs are not shifted to higher intensities than the NH RIFs suggests that the units in the reorganized IC encode intensity similarly to the normal hearing IC.
High CF Units
In high CF units from NH mice, tone RIFs for broadly tuned units’ were shifted to higher intensities than sharply tuned units at the 10%, 50% and 90% points. Mean spike counts were comparable. This is similar to the tone RIF result we found among the low CF units. The response to noise of the high/broad units, however, was not lower than that of the high/sharp units, suggesting less off-CF inhibition for high-CF than for low-CF broad FRA units. Egorova et al. (2001) have measured excitatory FRAs and high- and low-frequency inhibitory sidebands in the IC of the normal-hearing mouse and found that for Class I (sharp FRA) units both the excitatory and high frequency inhibitory sideband grow with CF. However, for Class III (broad FRA) units, the excitatory FRA grows as the CF increases, but the off-CF sidebands do not. One result of such a pattern might be that broad FRA units would be excited by a greater range of frequencies in a broadband stimulus as their CF increases, while the range of frequencies that are inhibitory remain constant. Such a decreased ratio of off-CF inhibition to on-CF excitation ratio would result in the higher spike count of high-CF broad FRA units. Perhaps this higher spike count accounts for the finding that, only for NH high-CF units responding to noise, the NH high/broad noise RIFs is not shifted to higher intensities than those of the NH high/sharp units.
Not surprisingly, there were very few high/sharp units encountered in the HI IC, and the ones that were found had significantly higher tone thresholds and lower spike counts for both tones and noise than the other high-CF units. The high frequency hearing loss reduces on-CF excitation thus suppresses response to tones for HI high/sharp units. However, the HI high/broad units did not have a reduced noise response. In this frequency range, spike count may be maintained by altered balance of off-CF inhibition and/or excitation in the same manner as described above for the NH broad-FRA units. As in the other CF/FRA groups, the noise RIFs of the HI high/broad units were shifted to higher intensities than those of the HI high/sharp units. The proportion of the different response types was similar in the HI and NH high-CF units, regardless of the shape of the FRA. Thus, the remaining HI high-CF units appear to be functioning normally, except for the elevated thresholds and reduced spike count of the high/sharp units.
Monotonicity
Across all CFs, 41% of our units were nonmonotonic using our rollover coefficient criterion of <0.8. This proportion is similar to Palombi and Caspary (1996b) who reported 35% of the units they recorded from the rat IC had rollover coefficients below 0.9. Aitkin et al., (1994) reported 13% nonmonotonic units in cat IC, but their criterion was a rollover coefficient below 50%. While the present sample has approximately equal numbers of nonmonotonic tone-RIFs as noise-RIFs, previous studies reported more nonmonotonic tone-RIFs than noise-RIFs in the IC (Ehret and Merzenich, 1988, Aitkin et al., 1994, Palombi and Caspary, 1996b). However, in all of those studies the animals received pentobarbital, which was supplemented with ketamine and xylazine in Aitkin et al. (1994) and Palombi and Caspary (1996b), which likely affected the balance between inhibition and excitation (Alkhatib et al., 2006). The majority of nonmonotonic units in the present study were classified as low-CF/broad units from the NH mice and were stimulated with noise bursts. These noise-RIFs had lower maximum counts and higher 10% intensities than all the other types of RIF from the NH mice (see Fig. 4). This result is in agreement with several other studies which show that driven response rates to noise bursts are typically lower than that elicited by tones. Palombi and Caspary (1996b) found a greater response rate to tones as compared to noise bursts, and Ehret and Merzenich (1988, Fig. 1) show only 2 of 36 units with higher rates to noise than tone (both in the IC). Aitkin et al.’s (1994) sample was biased to low CF IC units, and they found noise thresholds elevated while only 8 of 37 units had a higher response rate to broadband stimuli than to CF tones. These findings are all consistent with our results, which identify the low-CF units with broad FRAs as having elevated thresholds and lower driven rates for noise. In the present study, the animals were sedated with chlorprothixene instead of being lightly anesthetized with a barbiturate (Rennaker et al., 2007). Even light levels of anesthesia can effect IC neurons in ways consistent with an alteration in inhibition (Kuwada et al., 1989). In contrast, chlorprothixene induces sedation by blocking 5-HT2, D1, D2, D3, H1, muscarinic and Alpha1 postsynaptic receptors (Goodman and Gilman, 1996). The neurotransmitters that act on these receptors can modulate the response of the auditory system under aversive conditions through activity in other central nuclei but the drug does not directly alter the response of the primary IC receptors: GABA, glycine and glutamate (Winer and Schreiner, 2006). Therefore, any effect that chlorprothixene had on the inhibitory/excitatory balance in the IC is likely quite minimal, and its use might result in a proportion of nonmonotonic units that differs from the proportion found when light anesthesia is used.
Possible Implications
The changes described above could, in principle, be reversed if peripheral input is restored. Indeed, Willott (1996) has pointed out the importance of understanding auditory system plasticity in order to understand how the central auditory pathway will respond to the reintroduction of sounds by hearing aid amplification. Plasticity changes following hearing loss seem fairly well established, and there is evidence that physiological changes can also accompany restoration of hearing and which can, over a period of hearing aid use, impact speech perception (Palmer et al., 1998, Neuman, 2005). Learning as well as neural plasticity may contribute to improved perception of speech and non-speech sounds. Therefore, amplification in the form of hearing aids may be therapeutic for maintaining a healthy and functional auditory system. It has been shown that periodic stimulation with a 70 dB broad band stimulus can delay the onset of severe sensorineural hearing loss in several strains of mice (Turner and Willott, 1998, Willott and Turner, 1999, Willott and Turner, 2000), so that hearing aid use might usefully be started before significant hearing loss has occurred. The effect of an augmented auditory environment on plasticity and reversal of plasticity remain to be determined.
Conclusions
The C57 mouse displays many of the characteristics found in different types of human nonsyndromic progressive hearing loss. This and many other studies show that the central auditory system is profoundly affected by peripheral deafferentation, with tonotopic reorganization and altered intensity coding being observed in the auditory midbrain. Compared to 24-61 day-old (NH) C57/BL6 mice, the ABR thresholds of the 183-300 day-old (HI) mice were elevated, and we encountered more low-CF and broad-FRA units in the IC of the HI mice. Dividing our sample into 4 CF/FRA categories, we found that broad RIFs were shifted to higher intensities as compared to sharp RIFs, except for high CF HI units responding to noise. The high/sharp units recorded from HI mice had lower counts than the other high CF units. Finally, the noise RIFs of the NH low/broad units have low counts, perhaps serving to reduce the effect of background noise on the encoding of low frequency tones. In contrast, the noise RIFs of the HI low/broads have high counts, perhaps leaving the HI individual more vulnerable to the masking of low frequency sounds. These results are generally explicable in terms of altered excitatory/inhibitory balances in the auditory system. The effects of restoring peripheral input must be considered in light of this profoundly altered central auditory system, and the possibility that such restored peripheral input causes additional plastic changes must be also taken into account if treatments of sensorineural hearing loss are to be maximally effective.
Acknowledgments
This research was supported by the National Institute on Aging – NIH Grant: PO1 AG09524 and the International Center for Hearing and Speech Research. Jonathan Byrd and Michael Villano assisted with data collection, and Olga Vasilyeva directed us to information about the effects of chlorprothixene. Dr. William O’Neill made many helpful comments on an earlier version of this manuscript, and the comments of the reviewers were invaluable. Willard Wilson’s current address is: Tucker-Davis Technologies, 11930 Research Circle, Alachua, FL 32615
- ABR
auditory brainstem response
- ASR
acoustic startle reflex
- CF
characteristic frequency
- FRA
frequency response area
- HI
hearing impaired
- IC
inferior colliculus
- NH
normal hearing
- RIF
rate intensity function
Footnotes
Publisher's Disclaimer: This is a PDF file of an unedited manuscript that has been accepted for publication. As a service to our customers we are providing this early version of the manuscript. The manuscript will undergo copyediting, typesetting, and review of the resulting proof before it is published in its final citable form. Please note that during the production process errors may be discovered which could affect the content, and all legal disclaimersthat apply to the journal pertain.
References
- Aitkin L, Tran L, Syka J. The responses of neurons in subdivisions of the inferior colliculus of cats to tonal, noise and vocal stimuli. Exp Brain Res. 1994;98:53–64. doi: 10.1007/BF00229109. [DOI] [PubMed] [Google Scholar]
- Alkhatib A, Biebel UW, Smolders JW. Inhibitory and excitatory response areas of neurons in the central nucleus of the inferior colliculus in unanesthetized chinchillas. Exp Brain Res. 2006;174:124–143. doi: 10.1007/s00221-006-0424-8. [DOI] [PubMed] [Google Scholar]
- Barsz K, Benson PK, Walton JP. Gap encoding by inferior collicular neurons is altered by minimal changes in signal envelope. Hear Res. 1998;115:13–26. doi: 10.1016/s0378-5955(97)00173-1. [DOI] [PubMed] [Google Scholar]
- Caspary DM, Holder TM, Hughes LF, Milbrandt JC, McKernan RM, Naritoku DK. Age-related changes in GABA(A) receptor subunit composition and function in rat auditory system. Neuroscience. 1999;93:307–312. doi: 10.1016/s0306-4522(99)00121-9. [DOI] [PubMed] [Google Scholar]
- Caspary DM, Milbrandt JC, Helfert RH. Central auditory aging: GABA changes in the inferior colliculus. Exp Gerontol. 1995;30:349–360. doi: 10.1016/0531-5565(94)00052-5. [DOI] [PubMed] [Google Scholar]
- Costalupes JA, Young ED, Gibson DJ. Effects of continuous noise backgrounds on rate response of auditory nerve fibers in cat. J Neurophysiol. 1984;51:1326–1344. doi: 10.1152/jn.1984.51.6.1326. [DOI] [PubMed] [Google Scholar]
- Davis RR, Newlander JK, Ling X, Cortopassi GA, Krieg EF, Erway LC. Genetic basis for susceptibility to noise-induced hearing loss in mice. Hear Res. 2001;155:82–90. doi: 10.1016/s0378-5955(01)00250-7. [DOI] [PubMed] [Google Scholar]
- Eggermont JJ, Komiya H. Moderate noise trauma in juvenile cats results in profound cortical topographic map changes in adulthood. Hear Res. 2000;142:89–101. doi: 10.1016/s0378-5955(00)00024-1. [DOI] [PubMed] [Google Scholar]
- Egorova M, Ehret G, Vartanian I, Esser KH. Frequency response areas of neurons in the mouse inferior colliculus. I. Threshold and tuning characteristics. Exp Brain Res. 2001;140:145–161. doi: 10.1007/s002210100786. [DOI] [PubMed] [Google Scholar]
- Ehret G, Merzenich MM. Neuronal discharge rate is unsuitable for encoding sound intensity at the inferior-colliculus level. Hear Res. 1988;35:1–7. doi: 10.1016/0378-5955(88)90035-4. [DOI] [PubMed] [Google Scholar]
- Faingold CL, Boersma Anderson CA, Caspary DM. Involvement of GABA in acoustically-evoked inhibition in inferior colliculus neurons. Hear Res. 1991;52:201–216. doi: 10.1016/0378-5955(91)90200-s. [DOI] [PubMed] [Google Scholar]
- Faingold CL, Gehlbach G, Caspary DM. On the role of GABA as an inhibitory neurotransmitter in inferior colliculus neurons: iontophoretic studies. Brain Res. 1989;500:302–312. doi: 10.1016/0006-8993(89)90326-0. [DOI] [PubMed] [Google Scholar]
- Goodman LS, Gilman A. Goodman & Gilman’s the pharmacological basis of therapeutics. McGraw-Hill; New York, NY: 1996. [Google Scholar]
- Gutierrez A, Khan ZU, Morris SJ, De Blas AL. Age-related decrease of GABAA receptor subunits and glutamic acid decarboxylase in the rat inferior colliculus. J Neurosci. 1994;14:7469–7477. doi: 10.1523/JNEUROSCI.14-12-07469.1994. [DOI] [PMC free article] [PubMed] [Google Scholar]
- Harrison RV, Ibrahim D, Mount RJ. Plasticity of tonotopic maps in auditory midbrain following partial cochlear damage in the developing chinchilla. Exp Brain Res. 1998;123:449–460. doi: 10.1007/s002210050589. [DOI] [PubMed] [Google Scholar]
- Irvine DR, Rajan R, Smith S. Effects of restricted cochlear lesions in adult cats on the frequency organization of the inferior colliculus. J Comp Neurol. 2003;467:354–374. doi: 10.1002/cne.10921. [DOI] [PubMed] [Google Scholar]
- Ison JR, Allen P. A diminished rate of “physiological decay” at noise offset contributes to age-related changes in temporal acuity in the CBA mouse model of presbycusis. J Acoust Soc Am. 2003;114:522–528. doi: 10.1121/1.1577553. [DOI] [PubMed] [Google Scholar]
- Ison JR, Rivoli P, Moore J, Allen PD. Exaggerated Startle Reflex to Low Frequency Tone Bursts in C5BL/6J Mice with Progressive Hearing Loss: A Longitudinal Aging Study. Proceedings of the Association for Research in Otolaryngology Abstracts. 2005;28:430. [Google Scholar]
- Kiang NYS, Moxon EC. Tails of tuning curves of auditory nerve fibers. Journal of the Acoustical Society of America. 1974;55:620–630. doi: 10.1121/1.1914572. [DOI] [PubMed] [Google Scholar]
- Kuwada S, Batra R, Stanford TR. Monaural and binaural response properties of neurons in the inferior colliculus of the rabbit: effects of sodium pentobarbital. J Neurophysiol. 1989;61:269–282. doi: 10.1152/jn.1989.61.2.269. [DOI] [PubMed] [Google Scholar]
- Le Beau FE, Rees A, Malmierca MS. Contribution of GABA- and glycine-mediated inhibition to the monaural temporal response properties of neurons in the inferior colliculus. J Neurophysiol. 1996;75:902–919. doi: 10.1152/jn.1996.75.2.902. [DOI] [PubMed] [Google Scholar]
- Li HS, Borg E. Age-related loss of auditory sensitivity in two mouse genotypes. Acta Otolaryngol. 1991;111:827–834. doi: 10.3109/00016489109138418. [DOI] [PubMed] [Google Scholar]
- Mossop JE, Wilson MJ, Caspary DM, Moore DR. Down-regulation of inhibition following unilateral deafening. Hear Res. 2000;147:183–187. doi: 10.1016/s0378-5955(00)00054-x. [DOI] [PubMed] [Google Scholar]
- Needleman AR, Crandell CC. Speech recognition in noise by hearing-impaired and noise-masked normal-hearing listeners. J Am Acad Audiol. 1995;6:414–424. [PubMed] [Google Scholar]
- Neuman AC. Central auditory system plasticity and aural rehabilitation of adults. J Rehabil Res Dev. 2005;42:169–186. doi: 10.1682/jrrd.2005.01.0020. [DOI] [PubMed] [Google Scholar]
- Noben-Trauth K, Zheng QY, Johnson KR. Association of cadherin 23 with polygenic inheritance and genetic modification of sensorineural hearing loss. Nat Genet. 2003;35:21–23. doi: 10.1038/ng1226. [DOI] [PMC free article] [PubMed] [Google Scholar]
- Palmer CV, Nelson CT, Lindley GA. The functionally and physiologically plastic adult auditory system. J Acoust Soc Am. 1998;103:1705–1721. doi: 10.1121/1.421050. [DOI] [PubMed] [Google Scholar]
- Palombi PS, Caspary DM. GABA inputs control discharge rate primarily within frequency receptive fields of inferior colliculus neurons. J Neurophysiol. 1996a;75:2211–2219. doi: 10.1152/jn.1996.75.6.2211. [DOI] [PubMed] [Google Scholar]
- Palombi PS, Caspary DM. Physiology of the young adult Fischer 344 rat inferior colliculus: responses to contralateral monaural stimuli. Hear Res. 1996b;100:41–58. doi: 10.1016/0378-5955(96)00115-3. [DOI] [PubMed] [Google Scholar]
- Parham K, Willott JF. Acoustic startle response in young and aging C57BL/6J and CBA/J mice. Behav Neurosci. 1988;102:881–886. doi: 10.1037//0735-7044.102.6.881. [DOI] [PubMed] [Google Scholar]
- Philibert B, Collet L, Vesson JF, Veuillet E. Intensity-related performances are modified by long-term hearing aid use: a functional plasticity? Hear Res. 2002;165:142–151. doi: 10.1016/s0378-5955(02)00296-4. [DOI] [PubMed] [Google Scholar]
- Phillips DP, Hall SE. Spike-rate intensity functions of cat cortical neurons studied with combined tone-noise stimuli. J Acoust Soc Am. 1986;80:177–187. doi: 10.1121/1.394178. [DOI] [PubMed] [Google Scholar]
- Rajan R, Irvine DR. Absence of plasticity of the frequency map in dorsal cochlear nucleus of adult cats after unilateral partial cochlear lesions. J Comp Neurol. 1998;399:35–46. [PubMed] [Google Scholar]
- Rajan R, Irvine DR, Wise LZ, Heil P. Effect of unilateral partial cochlear lesions in adult cats on the representation of lesioned and unlesioned cochleas in primary auditory cortex. J Comp Neurol. 1993;338:17–49. doi: 10.1002/cne.903380104. [DOI] [PubMed] [Google Scholar]
- Rajan R. Receptor organ damage causes loss of cortical surround inhibition without topographic map plasticity. Nat Neurosci. 1998;1:138–143. doi: 10.1038/388. [DOI] [PubMed] [Google Scholar]
- Ramachandran R, Davis KA, May BJ. Single-unit responses in the inferior colliculus of decerebrate cats. I. Classification based on frequency response maps. J Neurophysiol. 1999;82:152–163. doi: 10.1152/jn.1999.82.1.152. [DOI] [PubMed] [Google Scholar]
- Rees A, Palmer AR. Rate-intensity functions and their modification by broadband noise for neurons in the guinea pig inferior colliculus. J Acoust Soc Am. 1988;83:1488–1498. doi: 10.1121/1.395904. [DOI] [PubMed] [Google Scholar]
- Rennaker RL, Carey HL, Anderson SE, Sloan AM, Kilgard MP. Anesthesia suppresses nonsynchronous responses to repetitive broadband stimuli. Neuroscience. 2007;145:357–369. doi: 10.1016/j.neuroscience.2006.11.043. [DOI] [PubMed] [Google Scholar]
- Robertson D, Irvine DR. Plasticity of frequency organization in auditory cortex of guinea pigs with partial unilateral deafness. J Comp Neurol. 1989;282:456–471. doi: 10.1002/cne.902820311. [DOI] [PubMed] [Google Scholar]
- Schreiner CE, Langner G. Periodicity coding in the inferior colliculus of the cat. II. Topographical organization. J Neurophysiol. 1988;60:1823–1840. doi: 10.1152/jn.1988.60.6.1823. [DOI] [PubMed] [Google Scholar]
- Sivaramakrishnan S, Sterbing-D’Angelo SJ, Filipovic B, D’Angelo WR, Oliver DL, Kuwada S. GABA(A) synapses shape neuronal responses to sound intensity in the inferior colliculus. J Neurosci. 2004;24:5031–5043. doi: 10.1523/JNEUROSCI.0357-04.2004. [DOI] [PMC free article] [PubMed] [Google Scholar]
- Slotnick BM, Leonard CM. A Stereotaxic Atlas of the Albino Mouse Forebrain. U.S. Department of Health, Education, and Welfare; Rockville, MD: 1975. [Google Scholar]
- Snyder RL, Sinex DG. Immediate changes in tuning of inferior colliculus neurons following acute lesions of cat spiral ganglion. J Neurophysiol. 2002;87:434–452. doi: 10.1152/jn.00937.2000. [DOI] [PubMed] [Google Scholar]
- Spongr VP, Flood DG, Frisina RD, Salvi RJ. Quantitative measures of hair cell loss in CBA and C57BL/6 mice throughout their life spans. J Acoust Soc Am. 1997;101:3546–3553. doi: 10.1121/1.418315. [DOI] [PubMed] [Google Scholar]
- Sutter ML, Schreiner CE. Physiology and topography of neurons with multipeaked tuning curves in cat primary auditory cortex. J Neurophysiol. 1991;65:1207–1226. doi: 10.1152/jn.1991.65.5.1207. [DOI] [PubMed] [Google Scholar]
- Turner JG, Willott JF. Exposure to an augmented acoustic environment alters auditory function in hearing-impaired DBA/2J mice. Hear Res. 1998;118:101–113. doi: 10.1016/s0378-5955(98)00024-0. [DOI] [PubMed] [Google Scholar]
- Vater M, Habbicht H, Kossl M, Grothe B. The functional role of GABA and glycine in monaural and binaural processing in the inferior colliculus of horseshoe bats. J Comp Physiol [A] 1992;171:541–553. doi: 10.1007/BF00194587. [DOI] [PubMed] [Google Scholar]
- Wang J, McFadden SL, Caspary D, Salvi R. Gamma-aminobutyric acid circuits shape response properties of auditory cortex neurons. Brain Research. 2002;944:219–231. doi: 10.1016/s0006-8993(02)02926-8. [DOI] [PubMed] [Google Scholar]
- Wang J, Salvi RJ, Powers N. Plasticity of response properties of inferior colliculus neurons following acute cochlear damage. J Neurophysiol. 1996;75:171–183. doi: 10.1152/jn.1996.75.1.171. [DOI] [PubMed] [Google Scholar]
- Willott JF. Changes in frequency representation in the auditory system of mice with age-related hearing impairment. Brain Res. 1984;309:159–162. doi: 10.1016/0006-8993(84)91022-9. [DOI] [PubMed] [Google Scholar]
- Willott JF. Effects of aging, hearing loss, and anatomical location on thresholds of inferior colliculus neurons in C57BL/6 and CBA mice. J Neurophysiol. 1986;56:391–408. doi: 10.1152/jn.1986.56.2.391. [DOI] [PubMed] [Google Scholar]
- Willott JF. Physiological plasticity in the auditory system and its possible relevance to hearing aid use, deprivation effects, and acclimatization. Ear Hear. 1996;17:66S–77S. doi: 10.1097/00003446-199617031-00007. [DOI] [PubMed] [Google Scholar]
- Willott JF, Aitkin LM, McFadden SL. Plasticity of auditory cortex associated with sensorineural hearing loss in adult C57BL/6J mice. J Comp Neurol. 1993;329:402–411. doi: 10.1002/cne.903290310. [DOI] [PubMed] [Google Scholar]
- Willott JF, Carlson S, Chen H. Prepulse inhibition of the startle response in mice: relationship to hearing loss and auditory system plasticity. Behav Neurosci. 1994;108:703–713. doi: 10.1037//0735-7044.108.4.703. [DOI] [PubMed] [Google Scholar]
- Willott JF, Demuth RM, Lu SM. Excitability of auditory neurons in the dorsal and ventral cochlear nuclei of DBA/2 and C57BL/6 mice. Exp Neurol. 1984a;83:495–506. doi: 10.1016/0014-4886(84)90118-3. [DOI] [PubMed] [Google Scholar]
- Willott JF, Kulig J, Satterfield T. The acoustic startle response in DBA/2 and C57BL/6 mice: relationship to auditory neuronal response properties and hearing impairment. Hear Res. 1984b;16:161–167. doi: 10.1016/0378-5955(84)90005-4. [DOI] [PubMed] [Google Scholar]
- Willott JF, Parham K, Hunter KP. Response properties of inferior colliculus neurons in middle-aged C57BL/6J mice with presbycusis. Hear Res. 1988;37:15–27. doi: 10.1016/0378-5955(88)90074-3. [DOI] [PubMed] [Google Scholar]
- Willott JF, Parham K, Hunter KP. Comparison of the auditory sensitivity of neurons in the cochlear nucleus and inferior colliculus of young and aging C57BL/6J and CBA/J mice. Hear Res. 1991;53:78–94. doi: 10.1016/0378-5955(91)90215-u. [DOI] [PubMed] [Google Scholar]
- Willott JF, Turner JG. Prolonged exposure to an augmented acoustic environment ameliorates age-related auditory changes in C57BL/6J and DBA/2J mice. Hear Res. 1999;135:78–88. doi: 10.1016/s0378-5955(99)00094-5. [DOI] [PubMed] [Google Scholar]
- Willott JF, Turner JG. Neural plasticity in the mouse inferior colliculus: relationship to hearing loss, augmented acoustic stimulation, and prepulse inhibition. Hear Res. 2000;147:275–281. doi: 10.1016/s0378-5955(00)00137-4. [DOI] [PubMed] [Google Scholar]
- Winer JA, Schreiner CE. Inferior Colliculus. Springer; New York, NY: 2006. pp. 294–302. [Google Scholar]