Abstract
When gene regulatory networks operate in regimes where the number of protein molecules is so small that the molecular species are on the verge of extinction, the death and resurrection of the species greatly modifies the attractor landscape. Deterministic models and the diffusion approximation to the master equation break down at the limits of protein populations in a way very analogous to the breakdown of geometrical optics that occurs at distances <1 wavelength of light from edges. Stable stochastic attractors arise from extinction and resurrection events that are not predicted by the deterministic description. With this view, we explore the attractors of the regular toggle switch and the exclusive switch, focusing on the effects of cooperative binding and the production of protein in bursts. Our arguments suggest that the stability of lysogeny in the λ-phage may be influenced by such extinction phenomena.
Keywords: cooperativity, regulation, stochasticity
Genetic networks are nonlinear stochastic systems. The genes, single DNA molecules, are regulated by transcription factors, proteins that are themselves products of other genes within the network (1). The dependence of the expression of a gene directly or indirectly on its own products makes gene switches intrinsically nonlinear (2, 3). Additional nonlinearity also can arise from details of promoter architecture such as binding-site overlap or cooperative binding of proteins to the DNA (4). The discreteness of the molecular entities involved makes genetic networks also intrinsically stochastic (5, 6). Individual binding transitions and the events leading to the production and destruction of gene products introduce “shot noise” into the description of genetic networks (7, 8). Shot noise does not simply modify deterministic behavior. Although continuous deterministic descriptions that neglect the noise present in genetic networks give insight into their behavior, molecular discreteness can lead to entirely novel network behaviors (9, 10). The most dramatic of these effects is the possible extinction of molecular species involved in cellular regulation. After a molecular extinction event occurs, other stochastic molecular processes may resurrect such a species, resetting the dynamics. Such extinction and resurrection events cannot be described simply as the perturbative effects of noise on deterministic behavior (11, 12). Behavior of just this sort is seen in the simplest self-activating gene switch and is manifested in the exact analytical solution of the statistical steady state for that system (13). The exact solution yields a bimodal probability distribution for the gene product concentration, whereas deterministic equations (with additive noise) that average over DNA occupancy would show only a single-peaked unimodal distribution for the protein concentration. The extra peak at low protein number is an effect that depends on the unique single-molecule nature of the gene. The unexpected peak disappears when binding/unbinding events are averaged over as in the macroscopic kinetic description. Effects of this nature where binding/unbinding events are discrete also occur when competition for a binding site is important, as in the combinatorial logic of a gene switch (14). In this article, we more closely examine the nature of the stochastic attractors that arise from extinction events coming from the binding/unbinding of proteins to the DNA. We argue they arise from a breakdown of the Langevin noise description or equivalently the diffusion approximation to the master equation that is commonly used (15, 16). Such a description does not correctly describe the system near the boundaries of the allowed protein concentration, i.e., when species can go extinct. This failure is quite analogous to the breakdown of geometrical optics due to diffraction from edges (17). Although we highlight the phenomenon in different versions of the so-called “toggle switch” (18), a simple network that consists of a pair of mutually repressing genes, these molecular discreteness effects also arise in much more complex genetic networks. In our view, the role of extinction and resurrection in multigene networks is likely to be of general importance.
The Toggle Switch
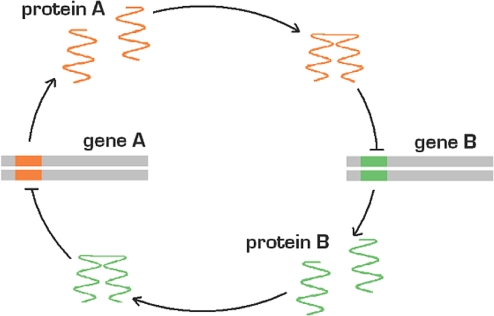
The Toggle Switch is a small network of 2 genes (A and B) in which the 2 gene products mutually repress each other (18–20) (Fig. 1). If A is on, B will be turned off and vice versa. Such simple verbal reasoning would suggest that this system could always show bistability. Deterministic mathematical analysis, on the other hand, argues otherwise. For simplicity, consider the case where both genes have the same binding characteristics and production rates. The deterministic kinetic rate equations for the concentration of proteins a and b are:
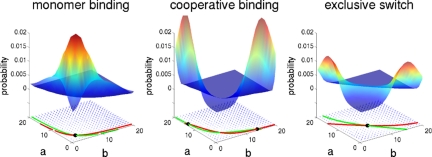
where g1 and g0 are the unrepressed and repressed protein synthesis rates respectively, k is the protein degradation rate and Xeq is the dissociation constant of the binding of proteins to DNA. The exponent x is the degree of cooperativity in the binding of the gene. x = 1 corresponds to a linear repression and the uncooperative binding of monomers, whereas x = 2 means that the transcription factors bind cooperatively as dimers. The deterministic description suggests binding cooperativity is essential for the switch to show bistability. For monomer binding (x = 1) the kinetic rate equations allow only 1 fixed point: a = b = − Xeq/2, when g0 = 0. The plots of nullclines and flow field for the switches with similar parameters (Fig. 2) show a single steady state for the binding of monomers. But for binding of dimers (x = 2) the deterministic toggle switch can have 2 fixed points when Xeq is small enough. To achieve this, the repression must be strong enough to avoid a situation where both proteins are expressed in large quantities. The bifurcation point is Xeq ≈ (Xad)x, where Xad = (g1 + g0)/2k is the protein concentration for half-repression.
Fig. 1.
The toggle switch. The protein produced by gene A represses gene B and vice versa. Depending on the parameters used, this system can show bistability.
Fig. 2.
Nullclines, flow field, fixed points, and probability distributions. Plots of strong repression, for the cases of toggle switch with monomer binding, toggle switch with dimer binding and the exclusive switch. Strong repression is necessary for bistability. The exclusive switch shows a bimodal distribution even for the case of monomer binding, which has only one stable fixed point.
Verbal arguments also suggest that another source of nonlinearity in which there are sterically conflicting DNA binding scenarios for the gene products may also produce bistability. In the exclusive-or switch, which is involved in λ-phage regulation, 2 genes, A and B, have promoters overlapping in such a way that the binding of one of the proteins prevents the other protein from binding (4). The competition for binding to the same part of the genome means that both sites cannot be simultaneously accessed. The deterministic equations for the symmetric exclusive repressor switch with monomer binding are:
We see again that these deterministic equations yield only 1 fixed point. In the case of a symmetric switch with g0 = 0, the stable fixed point is a = b = ( + g1/k − Xeq)/4. Nevertheless, the possibility of extinction of the protein species does allow the existence of multimodal distributions even when the deterministic description seems to yield unique behavior (10).
In keeping with the simple verbal arguments, the stochastic description of a toggle switch allows up to 4 different attractors, corresponding to the 4 different DNA binding states. A useful bistable switch would show 2 attractors (bound/unbound and unbound/bound binding states), and, when stable, spontaneous switching times are much longer than the elementary processes involved. Strength of repression and cooperativity play a major role in the stochastic stability of the switch. The repression has to be strong enough to prevent both proteins from being expressed simultaneously at high levels, whereas cooperativity can prevent a situation where both proteins are weakly expressed (19). The nonlinear response obtained by cooperative binding is necessary to prevent the genes from being repressed by too small a concentration of repressors. In Fig. 2, we plot probability distributions obtained from solving the zero eigenvector problem of the stochastic master equations in matrix form: dP/dt = AP [see supporting information (SI)]. In systems where the repression is too weak, there is no bistability, independent of the binding scenario or type of toggle switch. Cooperative binding is necessary for bistability in the case of the regular toggle switch (21, 22). As an alternative to introducing cooperativity, the exclusive switch prevents the simultaneous repression of both genes by disallowing the bound/bound state. The probability distribution of the exclusive switch can show 2 peaks even when the deterministic analysis shows only 1 solution.
In the exclusive switch, the competition for the single binding site couples the protein concentration degrees of freedom and the gene occupancy degrees of freedom. In the regular toggle switch, the binding site of each gene can change independently. If the binding and unbinding of transcription factors are fast enough to come to equilibrium rapidly, the effective occupancy of each binding site will be an equilibrium average of the bound and unbound state, regardless of the state of the other gene.
In the exclusive switch the gene states are coupled—the state of 1 gene depends on the state of the other gene. Because the binding rates to the mutual promoter depend on the concentration of the 2 proteins and the concentrations of the proteins depend on the occupancy states of the gene, effectively, the protein concentration and gene occupancy degrees of freedom are coupled in a nontrivial way that makes stochastic events play an important role. In this system with explicit molecular level competition, only 1 gene can be repressed at a time. The unrepressed gene will produce proteins at a high level, leading to large imbalances between the concentrations of 1 protein and the other. Despite the fast binding and unbinding of the repressor from the binding site, the concentration of the protein produced by the gene that is, on average, repressed is very small (proportional to the production rate in the bound state). Therefore, the probability of rebinding of a repressor protein produced by the previously unrepressed gene is much higher than binding of the repressor produced by the repressed gene. As a result, the repressed gene remains stably repressed. In Fig. 2, we see that the exclusive switch is able to have a 2-peak probability distribution even when the deterministic analysis shows only 1 stable fixed point. We will now explore the details of the repression mechanism and the stability of the exclusive switch further.
Life and Death on the Boundaries
Why does the stochastic description of the system show apparent attractors under the same conditions where the deterministic description shows no fixed points? Adding linear Gaussian noise to the corresponding deterministic equations would not change the attractor structure. The corresponding diffusion approximation to the master equation does not take into account the discrete nature of both protein concentration and gene occupancy. The discrete nature of the gene is especially important around the boundaries of the possible protein concentrations, where proteins can become extinct. Let us consider the situation around the attractor represented by one of the peaks in the probability distribution of the exclusive switch around the boundaries of the system, where protein a is present at very small numbers, and the repressing protein b is abundant. When the binding (h) and unbinding (f) reactions are fast enough (ω = f/k > 1), and the repression strong enough (Xeq/b ≪ 1), the average synthesis rate will be gav = (hbg0 + fg1)/(hb + f) ≈ g0 + (Xeq/b)g1. For strong enough repression, gav ≈ g0, and the ability of the system to escape from extinction at the boundary will depend on the ratio of the basal rate of expression g0 and the degradation rate k. Even a small basal rate of repression, comparable with the degradation rate of a single molecule, greatly modifies the attractor behavior near the unstable point of zero protein concentration. Strongly repressed systems with a very low basal synthesis rate will display an apparent attractor on the boundary that is not predicted by deterministic analysis. If the basal rate of expression becomes large enough so that the boundary peak in the probability distribution, located at a = g0/k, would instead be located ≈1 unit away from the boundary (g0 ≈ k), the dynamics begins to obey the deterministic equations with noise. This situation is analogous to diffraction in optics, where the classical geometrical optics approximation fails within a wavelength of the boundary.
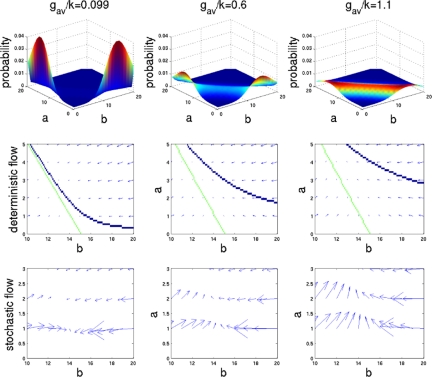
Fig. 3 shows that increasing the basal rate of protein production from zero to a number comparable to the degradation rate (1 unit of synthesis/degradation) causes the boundary peak in the probability distribution to disappear. Analyzing the deterministic and stochastic flow fields, we see how the stability around the border makes sense only within the stochastic description of the system. The arrows in the deterministic flow fields illustrate the direction and value of the gradient of protein concentration at a given point in space: v⃗d(a, b) = â + b̂. The arrows point toward the stable attractors. In a similar way, we can follow the evolution of the change in the probability distributions at given concentrations calculated for the stochastic system. The arrows in the flow field represent the sum of the vectors representing the probabilities of transitions to neighboring states: v⃗s(a, b) = [P(a → a + 1) − P(a → a − 1)] â + [P(b → b + 1) − P(b → b − 1)] b̂. By analyzing the stochastic flow fields, we see that for g0 ≈ 0, there is significant flow of probability to the apparent attractor at low concentrations and very little flow out from that attractor (Fig. 3). As a result, we see accumulation of probability in the bound/unbound situation of gene occupancy. As g0 increases, the number of proteins produced by the repressed protein increases and so does the flow out of the bound/unbound occupation state, which can clearly be seen in Fig. 3. In the case of relatively large production in the bound state, the stochastic solution no longer shows peaks at the boundaries. However, the solution still does not show a defined peak at the deterministic fixed point. The proximity of the nullclines makes a large region in the vicinity of the fixed point near-stable, spreading the peak. When both binding and unbinding from the promoter are fast, as g0 increases, binding of both repressors becomes competitive, and the states with small number of proteins are stabilized. In this limit, the proteins effectively lose their repressor characteristics, and many concentration substates are equally likely. In the unlikely parameter regime where the synthesis rate g0 of the gene when repressed becomes comparable with the rate g1 when the gene is unrepressed, the stochastic solution tends toward the deterministic solution weakly modified by noise.
Fig. 3.
Exclusive Switch: Probability distributions, deterministic flow (with nullclines) and stochastic flow for different values of g0. For lower values of gav probability accumulates at the boundary, because the probability of a degradation event is larger than the probability of a synthesis event.
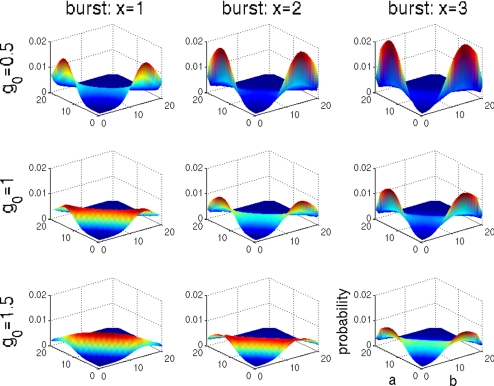
To test the analogy to diffraction, we must change the analogue of wavelength for this problem—the number of proteins synthesized in a single event. In fact, because of the intervention of mRNA, synthesis of proteins actually does occur in bursts when many copies are translated from a single messenger (23). One DNA transcription event yields 1 copy of RNA, but the translation of this copy of RNA in turn produces, generally, many copies of the encoded protein. Proteins are therefore not produced at a steady rate but in bursts with sizes corresponding to the protein yield of 1 RNA molecule. Increasing the size of protein synthesis bursts would correspond, in the optical analogy, to increasing the wavelength of the diffracted wave. Allowing synthesis to be “bursty” while keeping the average production rate fixed is expected to extend the range of the boundary effects. In Fig. 4, we see this extension of the boundary effect. When bursting occurs, the peak of the probability distribution at the boundary is maintained to much higher basal synthesis rates g0 and disappears only when g0 corresponds to a single burst size per unit time. Synthesis of protein in bursts therefore acts to stabilize the stochastic attractors resulting from extinction of proteins. Instead of the synthesis of a single protein molecule, a more infrequent mRNA synthesis event leading to a burst is necessary to escape the boundary. The smaller frequency at which production occurs decreases the escape rates and stabilizes the boundary states. When bursting is prominent, very stable attractors can exist at the boundaries that are completely unexpected from the deterministic description.
Fig. 4.
Exclusive switch: Probability distributions for different values of g0 and different sizes of synthesis burst. Larger sizes of synthesis burst increase the probability of extinction of the proteins.
It is fairly straightforward to obtain an estimate of the extent of the boundary effects, even for complex problems, from a simplified version of the given problem valid near the boundary. Consider the 1-dimensional case where protein a is on the verge of extinction when protein b is abundant. Considering the production of a in bursts of size x, we define a normalized average burst rate for a which is g = gav/kx, such that the master equation describing the number of proteins a at the boundary is:
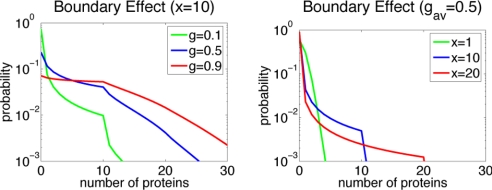
If production occurs without bursts (x = 1), this equation has a solution P(a) = gae−g/a!, a Poissonian distribution. When synthesis does take place in bursts, the distribution is P(a) = [(g + a − 1)a/a!] P(0) for a ≤ x and decays rapidly after that. P(0) can be found by normalizing the distribution. Fig. 5 shows the probability distributions that result from this 1-dimensional simplification for different values of g and x. Smaller values of g increase the probability of total extinction of the protein. Production in bursts extends the boundary effects until n = x. In reality, bursts are not of fixed size, but follow a geometric distribution (24, 25). This spread in burst size smoothes out the kink in the distribution around burst size, which would no longer be observed.
Fig. 5.
Probability distributions for the unidimensional case of stochastic genetic regulation. Smaller values of g (synthesis) cause more pronounced effects at the boundary. Larger values of x (burst size) extend the boundary effects to larger number of proteins.
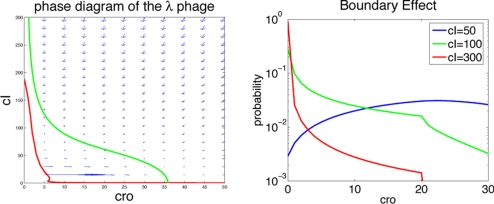
To get a quantitative idea about how significant boundary effects may be, it is worth finding about the well-studied genetic switch involved in λ-phage lifestyle choice (1). In the λ-switch decision (lysis/lysogeny), 2 protein species, the repressor cI (b) and cro (a), compete for binding 3 shared operators. Abundance of cI repressor leads to the repression of cro and ensures the persistence of lysogeny, where the virus simply stays incorporated in its host's DNA. Stress signals deactivate the repressor and flip the switch. Low levels of cI repressor increase the abundance of cro, taking the virus to the lytic state, at which time the virus reproduces and kills the host, leading to the infection of other cells. The modeling of Aurell and Sneppen (26) describes the binding affinities of the 2 transcription factors to the 3 operators on the DNA and can be used to calculate the probabilities of the different promoter occupancy states (SI). The λ-phage case corresponds reasonably well to the toggle switches we have concentrated on but has a more complicated binding scenario. Averaged synthesis rates for the λ-switch are not simple functions of the number of protein species, but can still be evaluated for any configuration of the system from the probability distribution of promoter occupancy states. The deterministic differential equations = ga(a, b) − ka and = gb(a, b) − kb can be evaluated at different points to generate nullclines and flow fields, by using the same parameters as ref. 26. Fig. 6 shows that a fixed point exists for the lytic scenario, but no fixed point is observed corresponding to lysogeny in the deterministic mode of description. Extinction boundary effects can be evaluated by using Eq. 5 with a protein number-dependent synthesis rate: = [g(a − x) P(a − x) − g(a)P(a)] + [(a + 1)P(a + 1) − aP(a)]. The probability distribution for the number of cro molecules is shown in Fig. 6 for several different levels of regulation by repressor cI. We see that for the levels encountered in the cell during lysogeny (b = 300), boundary effects can ensure stability. For lower cI repressor concentrations, lysogeny is no longer stable, and the virus goes into the lytic state.
Fig. 6.
Boundary effects in the λ-phage. (Left) Nullclines and flow field in the phase diagram of the λ-switch. There is a fixed point corresponding to the lytic phase, but no clear fixed point corresponding to lysogeny. (Right) Probability distributions of cro around extinction, showing that border effects can guarantee stability of lysogeny at high concentrations of repressor. At lower concentrations of repressor, lysogeny is no longer stable.
Escape Mechanisms
A 2-peaked probability distribution does not guarantee that a system is kinetically bistable in the sense of there being a large time-scale separation. The extinction peak is transient. We may discuss a switch's stability by comparing the average spontaneous switching time between the 2 attractors to the intrinsic molecular timescales. Time scales of stochastic rare events of complete switching are not trivially obvious from inspection of the system input parameters. Direct simulations of such rare events are computationally expensive, because the system manifests long uninteresting waiting times in which the dynamics is essentially consistent with the expected deterministic behavior. An analytical framework and numerical methods exist for treating switching times in stochastic genetic networks (11, 12, 15, 16, 19, 27). It is interesting to devise a transition state or stochastic separatrix specifying conditions from which there is equal probability of reaching both attractors of the system. This delimits a natural border between the 2 attractors and helps in the definition of order parameters. We can define the mean first passage time (MFPT) as the average time that it takes to reach the transition state ensemble starting from a set of initial conditions taken from the statistical steady state. In the case of the toggle switch, these initial conditions correspond to those representative of one of the attractors. The transition state ensemble consists of those states lying on the stochastic separatrix, which is the curve specifying those states from which there is equal probability of first reaching either attractor (27). In a switch having equal parameters for both genes, symmetry dictates that the separatrix is the diagonal containing the states where na = nb. To compute mean first-passage times, we may consider a master equation where the boundary conditions reflect the fact that when a trajectory reaches the separatrix, the trajectory is terminated while the rest of the boundaries are still reflecting. In the matrix representation of the master equation, the transition matrix A that acts on the state vector P(na, nb, t) no longer conserves probability for the mean first-passage time problem. This “lost” probability corresponds to the probability that the system already has crossed the separatrix. The probability that the system is still unreacted at time t can now be calculated by
 |
The mean first-passage time is calculated from this probability as
 |
Combining these 2 expressions and inverting the order of integration yields
 |
Because ∫0∞ P(na, nb, t)dt = −A−1 P(na, nb, 0), we see that the mean first-passage time can be calculated by using the inverse of the transition matrix:
 |
Because unreacted probability is not conserved, the transition matrix with absorbing boundary conditions at the separatrix does not have a zero eigenvalue. Therefore det(A) ≠ 0, so the transition matrix is invertible.
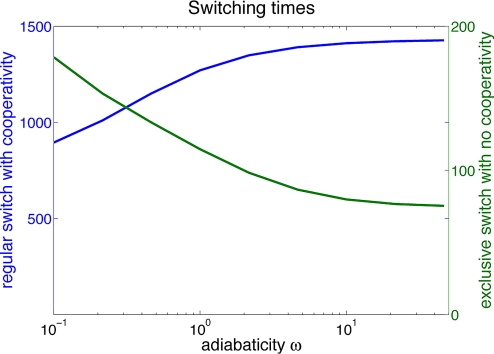
This method was used to calculate the switching times for different binding scenarios in Fig. 7. We plot the results as a function of the adiabaticity parameter ω = f/k, which measures how fast the binding/unbinding processes are in comparison with protein synthesis and degradation while other parameters were kept constant. The results from the matrix inversion agree with the switching times obtained by averaging many stochastic simulations. These calculations indicate that the nature of the escape routes for the regular toggle switch and the exclusive toggle switch are very different. For the regular toggle switch, in the limit of fast binding and unbinding, the escape mechanism consists of a gradual diffusion of protein numbers due to frequent binding and unbinding events on an effective deterministic potential, which reflects the effective production rates as a function of concentrations. The deterministic bistability of the toggle switch relies on the cooperative nature of repressor binding. We have determined that the bistability of the exclusive switch, on the other hand, is a result of coupling between the protein concentrations and the gene occupancy states. In the limit of strong repression, the effective gene-expression state is not well approximated by the equilibrium average of the bound and unbound states, and nonadiabatic effects play a role (13, 19, 28, 29). One of the gene occupancy states, (bound/unbound or unbound/bound), is stabilized by the proteomic atmosphere, and the effective gene expression state changes on slower time scales than would be predicted from binding and unbinding rates alone. In Fig. 7, a comparison of the switching times of the regular and exclusive switch is plotted. The figure indicates the nonadiabatic nature of the escape mechanism of the exclusive switch. The regular toggle switch behaves much like in the adiabatic case. Even when binding occurs from monomers, except in the strictly nonadiabatic limit, the spontaneous switching times of the exclusive switch are significantly longer then the binding/unbinding times, which shows the stabilization of the effective gene expression state by the proteomic atmosphere. Many attempts at unbinding and rebinding of the same type of repressor protein are needed in order for a production event in the unbound state to occur that will increase the number of proteins produced by the repressed gene and thus allow for an escape. In the strongly nonadiabatic limit, the rate of unbinding and unbinding becomes so small that the protein number equilibrates before the gene expression state can change and the unbound/unbound state becomes occupied. In this limit, the probability distribution has 3 peaks, and the steady states are different from the ones we have discussed above.
Fig. 7.
Switching times for different binding scenarios. Stochasticity coming from binding and unbinding events increases the stability of the stochastic attractor of the exclusive switch while decreasing the stability of the deterministic attractor of the regular switch with binding of dimers.
For all values of adiabaticity, the toggle switch with dimer binding has spontaneous switching times much larger than the molecular binding times themselves. The switching times of the dimer switch increase in the adiabatic limit of fast binding/unbinding. The regular toggle switch with dimer binding has much larger switching times in the adiabatic limit. The stability of this switch follows from rare excursions away from the deterministic fixed points. In contrast, the spontaneous switching times for the exclusive switch are smaller in the adiabatic limit. This decrease of switching times with more rapid binding shows that the stability of the exclusive switch indeed comes from the extinction/resurrection effects. As the number of unbinding events increases with the decrease of 1/f, the number of attempts at escape also increases. When escaping from the bound/unbound occupancy state, the system first finds itself in the unbound/unbound or unbound/bound state but with a small number of proteins produced by the gene that had previously been repressed. In these states, the number of proteins has an opportunity to increase, allowing the escape to become successful.
A reasonable estimate of the adiabaticity parameter in natural systems can be obtained by using recent measurements that show that a single transcription factor takes ≈65–360 s to find its target inside the cell (30). In the case of the λ-phage, where 150 dimers of repressor keep the promoter occupied 99.9% of the time, and the lifetime of the proteins is ≈3,000 s, the effective adiabaticity parameter would thus be in the range of ω ≈ 1 − 10.
Discussion
The stochastic attractors of gene networks arise from the way in which the discrete nature of protein concentrations and DNA occupancy dominate the dynamics around the limits of molecular populations in the system. Near those borders, the diffusion approximation to the master equations used in the small fluctuation analysis is not valid. Production of proteins in bursts, a discretization effect, further enhances these boundary effects. Extinction and resurrection of protein species, as well as production of proteins in bursts, are all very common scenarios in genetic networks, so such stable stochastic attractors are probably quite widespread. The importance of discreteness around the boundaries of a system finds parallels in other areas of physics, such as in the diffraction of waves, where classical optics also fails to describe light propagation within 1 wavelength of an edge. Similar effects of molecular discreteness have been shown to be involved in the propagation of instabilities at the interface of a reaction front, controlling pattern formation in nonequilibrium systems (31) and the statistics of epidemics.
Supplementary Material
Acknowledgments.
We thank X. Sunney Xie, Ulrich Gerland, Devarajan Thirumalai, Eshel Ben Jacob, and Herbert Levine for helpful comments. This work was supported by National Science Foundation-sponsored Center for Theoretical Biological Physics Grant PHY-0822283.
Footnotes
The authors declare no conflict of interest.
This article contains supporting information online at www.pnas.org/cgi/content/full/0810366105/DCSupplemental.
References
- 1.Ptashne M. A Genetic Switch. 3rd Ed. Cold Spring Harbor, NY: Cold Spring Harbor Lab Press; 1992. pp. 1–64. [Google Scholar]
- 2.Becskei A, Seraphin B, Serrano L. Positive feedback in eukaryotic gene networks: Cell differentiation by graded to binary response conversion. EMBO J. 2001;20:2528–2535. doi: 10.1093/emboj/20.10.2528. [DOI] [PMC free article] [PubMed] [Google Scholar]
- 3.Weinberger LS, Shenk T. An HIV feedback resistor: Auto-regulatory circuit deactivator and noise buffer. PLoS Biol. 2007;5:67–81. doi: 10.1371/journal.pbio.0050009. [DOI] [PMC free article] [PubMed] [Google Scholar]
- 4.Warren PB, ten Wolde PR. Enhancement of the stability of genetic switches by overlapping upstream regulatory domains. Phys Rev Lett. 2004;92:128101. doi: 10.1103/PhysRevLett.92.128101. [DOI] [PubMed] [Google Scholar]
- 5.Swain PS, Elowitz MB, Siggia ED. Intrinsic and extrinsic contributions to stochasticity in gene expression. Proc Natl Acad Sci USA. 2002;99:12795–12800. doi: 10.1073/pnas.162041399. [DOI] [PMC free article] [PubMed] [Google Scholar]
- 6.Elowitz MB, Levine AJ, Siggia ED, Swain PS. Stochastic gene expression in a single cell. Science. 2002;297:1183–1186. doi: 10.1126/science.1070919. [DOI] [PubMed] [Google Scholar]
- 7.Thattai M, van Oudenaarden A. Intrinsic noise in gene regulatory networks. Proc Natl Acad Sci USA. 2001;98:8614–8619. doi: 10.1073/pnas.151588598. [DOI] [PMC free article] [PubMed] [Google Scholar]
- 8.Paulsson J. Summing up the noise in gene networks. Nature. 2004;427:415–418. doi: 10.1038/nature02257. [DOI] [PubMed] [Google Scholar]
- 9.Andrecut M, Cloud D, Kauffman SA. Monte Carlo simulation of a simple gene network yields new evolutionary insights. J Theor Biol. 2008;250:468–474. doi: 10.1016/j.jtbi.2007.10.035. [DOI] [PubMed] [Google Scholar]
- 10.Lipshtat A, Loinger A, Balaban NQ, Biham O. Genetic toggle switch without cooperative binding. Phys Rev Lett. 2006;96:188101. doi: 10.1103/PhysRevLett.96.188101. [DOI] [PubMed] [Google Scholar]
- 11.Sasai M, Wolynes PG. Stochastic gene expression as a many-body problem. Proc Natl Acad Sci USA. 2003;100:2374–2379. doi: 10.1073/pnas.2627987100. [DOI] [PMC free article] [PubMed] [Google Scholar]
- 12.Metzler R, Wolynes PG. Number fluctuations and the threshold model of kinetic switches. Chem Phys. 2002;284:469–479. [Google Scholar]
- 13.Hornos JEM, et al. Self-regulating gene: An exact solution. Phys Rev E. 2005;72 doi: 10.1103/PhysRevE.72.051907. 051907. [DOI] [PubMed] [Google Scholar]
- 14.Buchler NE, Gerland U, Hwa T. On schemes of combinatorial transcription logic. Proc Natl Acad Sci USA. 2003;100:5136–5141. doi: 10.1073/pnas.0930314100. [DOI] [PMC free article] [PubMed] [Google Scholar]
- 15.Kepler TB, Elston TC. Stochasticity in transcriptional regulation: Origins, consequences, and mathematical representations. Biophys J. 2001;81:3116–3136. doi: 10.1016/S0006-3495(01)75949-8. [DOI] [PMC free article] [PubMed] [Google Scholar]
- 16.Ao P. Potential in stochastic differential equations: Novel construction. J Phys A. 2004;37:L25–L30. [Google Scholar]
- 17.Wang J, Wolynes PG. Instantons and the fluctuating path description of reactions in complex environments. J Phys Chem. 1995;100:1129–1136. [Google Scholar]
- 18.Gardner TS, Cantor CR, Collins JJ. Construction of a genetic toggle switch in Escherichia coli. Nature. 2000;403:339. doi: 10.1038/35002131. [DOI] [PubMed] [Google Scholar]
- 19.Schultz D, Onuchic JN, Wolynes PG. Understanding stochastic simulations of the smallest genetic networks. J Chem Phys. 2007;126:245102. doi: 10.1063/1.2741544. [DOI] [PubMed] [Google Scholar]
- 20.Ushikubo T, Inoue W, Yoda M, Sasai M. Testing the transition state theory in stochastic dynamics of a genetic switch. Chem Phys Lett. 2006;430:139. [Google Scholar]
- 21.Walczak AM, Onuchic JN, Wolynes PG. Absolute rate theories of epigenetic stability. Proc Natl Acad Sci USA. 2005;102:18926–18931. doi: 10.1073/pnas.0509547102. [DOI] [PMC free article] [PubMed] [Google Scholar]
- 22.Bialek W, Setayeshgar S. Cooperativity, sensitivity, and noise in biochemical signaling. Phys Rev Lett. 2008;100:258101. doi: 10.1103/PhysRevLett.100.258101. [DOI] [PubMed] [Google Scholar]
- 23.McAdams HH, Arkin A. Stochastic mechanisms in gene expression. Proc Natl Acad Sci USA. 1997;94:814–819. doi: 10.1073/pnas.94.3.814. [DOI] [PMC free article] [PubMed] [Google Scholar]
- 24.Yu J, Xiao J, Ren X, Lao K, Xie XS. Probing gene expression in live cells, one protein molecule at a time. Science. 2006;311:1600–1603. doi: 10.1126/science.1119623. [DOI] [PubMed] [Google Scholar]
- 25.Paulsson J, Ehrenberg M. Random signal fluctuations can reduce random fluctuations in regulated components of chemical regulatory networks. Phys Rev Lett. 2000;84:5447–5450. doi: 10.1103/PhysRevLett.84.5447. [DOI] [PubMed] [Google Scholar]
- 26.Aurell E, Sneppen K. Epigenetics as a first exit problem. Phys Rev Lett. 2002;88 doi: 10.1103/PhysRevLett.88.048101. 048101. [DOI] [PubMed] [Google Scholar]
- 27.Morelli MJ, Tanase-Nicola S, Allen RJ, ten Wolde PR. Reaction coordinates for the flipping of genetic switches. Biophys J. 2008;94:3413–3423. doi: 10.1529/biophysj.107.116699. [DOI] [PMC free article] [PubMed] [Google Scholar]
- 28.Walczak AM, Sasai M, Wolynes PG. Self-consistent proteomic field theory of stochastic gene switches. Biophys J. 2005;88:828. doi: 10.1529/biophysj.104.050666. [DOI] [PMC free article] [PubMed] [Google Scholar]
- 29.Schultz D, Ben Jacob E, Onuchic JN, Wolynes PG. Molecular level stochastic model for competence cycles in Bacillus subtilis. Proc Natl Acad Sci USA. 2007;104:17582–17587. doi: 10.1073/pnas.0707965104. [DOI] [PMC free article] [PubMed] [Google Scholar]
- 30.Elf J, Li GW, Xie XS. Probing transcription factor dynamics at the single-molecule level in a living cell. Science. 2007;316:1191–1194. doi: 10.1126/science.1141967. [DOI] [PMC free article] [PubMed] [Google Scholar]
- 31.Kessler DA, Levine H. Fluctuation-induced diffusive instabilities. Nature. 1998;394:556–558. [Google Scholar]
Associated Data
This section collects any data citations, data availability statements, or supplementary materials included in this article.


