Abstract
The activity of the ERK has complex spatial and temporal dynamics that are important for the specificity of downstream effects. However, current biochemical techniques do not allow for the measurement of ERK signaling with fine spatiotemporal resolution. We developed a genetically encoded, FRET-based sensor of ERK activity (the extracellular signal-regulated kinase activity reporter, EKAR), optimized for signal-to-noise ratio and fluorescence lifetime imaging. EKAR selectively and reversibly reported ERK activation in HEK293 cells after epidermal growth factor stimulation. EKAR signals were correlated with ERK phosphorylation, required ERK activity, and did not report the activities of JNK or p38. EKAR reported ERK activation in the dendrites and nucleus of hippocampal pyramidal neurons in brain slices after theta-burst stimuli or trains of back-propagating action potentials. EKAR therefore permits the measurement of spatiotemporal ERK signaling dynamics in living cells, including in neuronal compartments in intact tissues.
Keywords: fluorescence lifetime imaging microscopy, FRET, MAPK
The MAPK family is a class of serine/threonine kinases that includes the ERK, p38, and JNK subfamilies. Members of the ERK subfamily are essential for numerous, diverse physiological functions, including cellular differentiation, proliferation and neuronal plasticity, and their activities are up-regulated in many cancers (1). ERK signaling spans multiple subcellular compartments (1, 2). For example, in neurons ERK is activated at synapses and regulates gene transcription in the nucleus, hundreds of micrometers away (1). The spatial and temporal dynamics of ERK activity are likely critical in establishing the specificity of downstream signals. In PC12 cells, for example, epidermal growth factor (EGF) induces transient ERK activity only in the cytoplasm, leading to cellular proliferation; whereas, neural growth factor (NGF) triggers long-lasting ERK activity in both the cytoplasm and nucleus, resulting in cellular differentiation (2).
Traditional methods to measure ERK signaling, by Western blotting or immunostaining for phosphorylated, active ERK, have provided valuable insight into ERK function. However, these methods present a static snapshot of cellular events; they do not allow for the dynamic examination of ERK activity with fine spatial resolution. Recently developed imaging approaches that use fluorescent sensors of signaling activities can overcome these shortcomings (3). FRET-based reporters have been used in living cells to monitor the spatiotemporal patterns of Ca2+ signaling and enzymatic activities (4). We therefore created a genetically encoded FRET-based sensor of ERK activity that selectively reports ERK signaling in living cells.
Results
Design and Function of EKAR.
To create a genetically encoded fluorescent sensor of ERK activity, we customized a generic design for FRET-based kinase activity reporters (5–8). Our ERK activity sensor, named EKAR (extracellular signal-regulated kinase activity reporter), includes a fluorescent protein FRET pair well suited for 2-photon fluorescence lifetime imaging (2pFLIM; EGFP and mRFP1) (9, 10), a substrate phosphorylation peptide from Cdc25C containing the consensus MAPK target sequence (PRTP) (11), and the proline-directed WW phospho-binding domain (12) (Fig. 1). ERK activation leads to phosphorylation of the substrate sequence and subsequent binding by the phospho-binding domain. The resulting conformational rearrangement triggers a change in FRET between the donor (EGFP) and acceptor (mRFP1) fluorophores. Because specificity in MAPK signaling depends on docking domains (13), we added an ERK-specific, 4-aa (FQFP) docking site adjacent to the phosphorylation sequence (14). Finally, we included a central linker consisting of 72 glycine residues (15). EKAR expression was restricted to the nucleus likely because of the nuclear localization of the WW domain (16). Addition of a C-terminal nuclear export sequence resulted in cytoplasmic expression, providing a cytoplasmic form of the sensor (EKARcyto).
Fig. 1.
Schematic of EKAR. ERK phosphorylation of EKAR triggers a conformational change and an increase in FRET between EGFP and mRFP1.
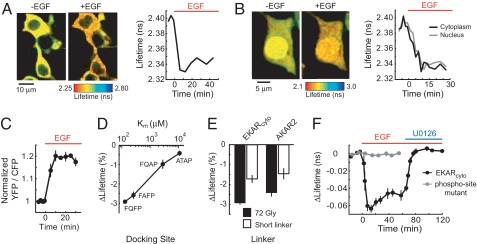
To test the sensor's function in living cells, HEK293 cells expressing EKAR were stimulated with EGF (100 ng/ml) to strongly activate ERK signaling. FRET was quantified and imaged by using 2pFLIM (9, 10, 17, 18). The fluorescence lifetime of the donor fluorophore (EGFP), defined as the average time between fluorophore excitation and photon emission, is related to FRET efficiency and the fraction of donors interacting with acceptors (binding fraction) (3). A shorter lifetime implies higher FRET. The fluorescence lifetime of EKARcyto decreased rapidly following stimulation with EGF (ΔLifetime = −2.92 ± 0.07%, P < 0.001; Fig. 2 A, B, and F). In cells coexpressing EKARcyto and EKARnuclear, the time courses and magnitudes of EGF-induced responses in the nucleus and cytoplasm were similar (Fig. 2B). We also measured the responses of a CFP-YFP version of EKARcyto, containing Cerulean (19) and Venus (20), by using intensity-based ratiometric methods. EGF stimulation triggered an increase in the ratio (R) of acceptor to donor fluorescence in HEK293 cells expressing this version of EKARcyto (ΔR/RYFP/CFP = 20.9 ± 1.0%, P < 0.001; Fig. 2C). EKARcyto therefore undergoes a stimulus-dependent FRET change.
Fig. 2.
Function of EKAR. (A) (Left) Fluorescence lifetime images of HEK293 cells transfected with EKARcyto before (−5 min) and after (12 min) addition of EGF (100 ng/ml). (Right) Time course of the EGF-induced ERK activation. (B) (Left) Fluorescence lifetime images of HEK293 cells transfected with EKARcyto and EKARnuclear before (−4 min) and after (15 min) addition of EGF. EKAR concentration was higher in the nucleus. (Right) Time course of ERK activation in the nucleus and cytoplasm. (C) EGF-induced ERK activation, measured as the ratio of acceptor-to-donor fluorescence, in HEK293 cells expressing a CFP-YFP version of EKARcyto. Each region-of-interest (ROI) contained 2–6 cells. Data are mean ± SEM for 5 ROIs from 5 dishes. (D) EGF-induced lifetime changes in HEK293 cells expressing EKARcyto variants containing docking sites with different affinities for ERK. Km values are from ref. 14. Data for each docking site are mean ± SEM for ≥5 ROIs from 2 dishes. (E) Lifetime changes in HEK293 cells expressing central linker variants of EKARcyto and an EGFP-mRFP1 version of AKAR2 after EGF stimuli or application of the adenylate cyclase activator forskolin (25 μM) and the phosphodiesterase inhibitor IBMX (100 μM), respectively. The sequence of the short glycine-rich linker is GNNGGNGGS (7) for EKAR and SAGKPGSGEGSTKG for AKAR2 (21). Data are mean ± SEM for ≥7 ROIs from ≥2 dishes for each condition. (F) EGF-induced lifetime changes for EKARcyto and EKARcyto mutated (Thr-to-Ala) at the phosphorylation site in the substrate peptide. For the wild type sensor, 10 μM U0126 was added 65 min after EGF application. Data are mean ± SEM for ≥9 ROIs from ≥2 dishes for each condition.
The ERK-specific docking site (FQFP) was necessary for this FRET change. The inclusion of docking sites with lower affinities for ERK (14) greatly reduced the signal of EKARcyto (Fig. 2D). Also, EKARcyto with the 72-glycine-residue central linker had a larger signal than a version with a shorter Gly-rich linker (7) used in other sensors of this type (ΔLifetime72-Gly = −2.92 ± 0.07%, ΔLifetimeshort linker = −1.72 ± 0.18%, P < 0.01; Fig. 2E). Consistently, the 72-glycine linker also improved the signal of an EGFP-mRFP1 version of AKAR2 (21), a FRET-based sensor of PKA activity, in response to adenylate cyclase activation and phosphodiesterase inhibition in HEK293 cells (ΔLifetime72-Gly = −2.41 ± 0.18%, ΔLifetimeshort linker = −1.45 ± 0.29%, P < 0.02; Fig. 2E). Other components of EKAR, including the fluorescent proteins, phospho-binding domain and substrate peptide, were also optimized [see supporting information (SI) Table S1].
Relationship Between EKAR Signals and ERK Activity.
To examine the relationship between ERK activation and the EKARcyto signal, we mutated the MAPK phosphorylation site in the Cdc25C peptide (Thr-to-Ala substitution). The mutant sensor was insensitive to stimulation with EGF (ΔLifetime = −0.08 ± 0.11%, P > 0.6; Fig. 2F), indicating that the phosphorylation of the MAPK substrate peptide is necessary for the FRET change. In addition, preincubation with the ERK pathway inhibitor U0126 (10 μM) eliminated the EGF-induced decrease in fluorescence lifetime (ΔLifetime = −0.05 ± 0.09%, P > 0.8). Furthermore, application of U0126 following EGF-induced ERK activation caused a rapid (≈5 min) increase of the fluorescence lifetime to slightly above baseline levels (Fig. 2F). These results suggest that EKARcyto reversibly reports ERK activity with rapid kinetics.
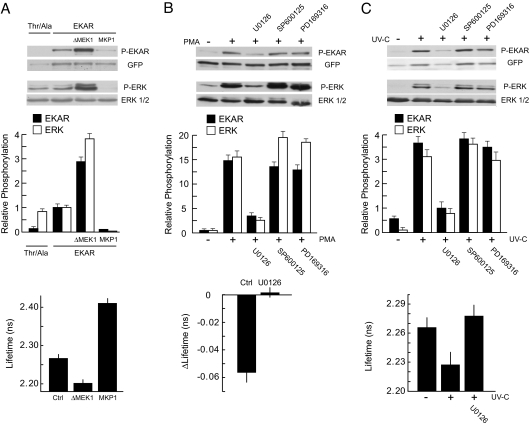
To examine further the relationship between EKARcyto signals and ERK activity, we simultaneously measured ERK phosphorylation and EKARcyto phosphorylation at the Cdc25C peptide by using a biochemical approach. Both ERK and EKARcyto had low levels of baseline phosphorylation in COS7 cells (Fig. 3). Expression of a constitutively active form of MEK1 (ΔMEK1), to activate the ERK subfamily of MAPKs (22), caused a robust phosphorylation of both ERK and EKARcyto (Fig. 3A). Overexpression of a MAPK phosphatase (MKP1), to inhibit ERK activation (23), eliminated phosphorylation of both EKARcyto and ERK (Fig. 3A). Consistently, in the presence of ΔMEK1 or MKP1 EKARcyto-expressing cells had, on average, lower or higher fluorescence lifetimes, respectively, in comparison to control cells. Furthermore, stimulation of COS7 cells with phorbol myristate acetate (PMA, 1 μM) triggered strong phosphorylation of ERK and EKARcyto that was prevented by the addition of the ERK pathway blocker U0126 (10 μM; Fig. 3B). The addition of PMA also triggered an ERK-dependent decrease in fluorescence lifetime (Fig. 3B). Therefore, EKARcyto phosphorylation and EKARcyto signals correlate with the activation of endogenous ERK.
Fig. 3.
Analysis of the relationship between ERK phosphorylation, EKAR phosphorylation, and EKAR signals. (A) Correlation between ERK phosphorylation, EKAR phosphorylation, and EKAR signals in COS7 cells. (Top and Middle) Cells were transfected with EKARcyto or EKARcyto (Thr-to-Ala). ERK activity was modulated by cotransfection with a constitutively active MEK (ΔMEK1) or a MAPK phosphatase (MKP1). An example Western blot is shown. Relative phosphorylation is the ratio of phosphorylated protein to total protein. Data are mean ± SEM from 3 experiments. (Bottom) Fluorescence lifetimes in cells expressing EKARcyto in control, ΔMEK1, and MKP1 conditions. Data for each condition are mean ± SEM for >20 cells from 2 dishes. (B) PMA-induced ERK phosphorylation, EKAR phosphorylation, and EKAR signals in COS7 cells transfected with EKARcyto. Cells were stimulated with PMA (1 μM; 10 min). MAPK pathways were blocked by preincubation (30 min) with ERK (10 μM U0126), JNK (10 μM SP600125), and p38 (10 μM PD169316) pathway inhibitors. (Top and Middle) An example Western blot is shown. Data are mean ± SEM from 3 experiments. (Bottom) Changes in lifetime after PMA application with and without U0126 (10 μM). Data for each condition are mean ± SEM for 10 cells from 2 dishes. (C) UV irradiation-induced ERK phosphorylation, EKAR phosphorylation, and EKAR signals in COS7 cells transfected with EKARcyto. Cells were irradiated with 60 J/m2 UV-C and then incubated for 1 h. Drugs are the same as in B. (Top and Middle) An example Western blot is shown. Data are mean ± SEM from 3 experiments. (Bottom) Fluorescence lifetimes in cells expressing EKARcyto after UV-C treatment with and without U0126 (10 μM). Data for each condition are mean ± SEM for >20 cells from 2 dishes.
Because the MAPK family members have similar target phosphorylation sequences, EKAR may also be sensitive to p38 and JNK activities, despite the inclusion of the ERK-specific docking domain. To address this possibility, we irradiated COS7 cells with UV light, which strongly induces p38 and JNK activity, while only modestly elevating ERK activity (Fig. S1) (24). UV irradiation triggered EKARcyto phosphorylation that was eliminated in the presence of the ERK pathway blocker U0126 (10 μM) but was insensitive to p38 (10 μM PD169316) and JNK (10 μM SP600126) inhibitors (Fig. 3C). Consistently, UV irradiation decreased the fluorescence lifetime, on average, in EKARcyto-expressing cells in an ERK-dependent manner (Fig. 3C). EKARcyto therefore selectively reports the activity of ERK and does not report the activities of closely related members of the MAPK family.
EKAR in Pyramidal Neurons.
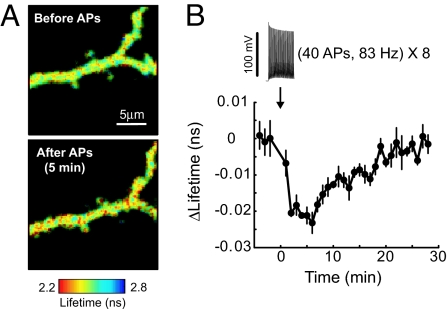
We also examined EKARcyto function in pyramidal neurons in organotypic hippocampal brain slices. We monitored EKARcyto signals in apical dendrites following high-frequency trains of back-propagating action potentials (40 action potentials at 83 Hz, repeated 8 times at 0.2 Hz), which cause relatively global Ca2+ influx through voltage-gated Ca2+ channels (VGCCs) to activate Ras (10, 25). VGCC-dependent Ca2+ influx triggered ERK activation in proximal dendrites, as reported by EKARcyto, that peaked within several minutes and decayed to baseline levels within 30 min (ΔLifetime = −0.97 ± 0.12%, P < 0.01; tpeak, ERK = 5.5 ± 0.7 min; τdecay, ERK = 10.7 ± 1.1 min, obtained by dividing the area by the peak amplitude of the transient; Fig. 4). The time course of ERK activation was longer than for Ras activation following the same stimulus (tpeak, Ras < 2 min; τdecay, Ras = 4.7 ± 0.6 min) (10), which is consistent with ERK's role as a downstream effector of Ras. EKAR's sensitivity is therefore sufficient to study ERK signaling in neurons in intact tissue.
Fig. 4.
EKAR function in hippocampal neurons. (A) Fluorescence lifetime images of dendrites from a pyramidal neuron in a cultured hippocampal brain slice before and after trains of back-propagating action potentials (40 APs at 83 Hz, repeated 8 times at 0.2 Hz). (B) Time course of ERK activity. Each ROI contained a ≈20-μm stretch of apical dendrite <70 μm from the soma. In the example image, the entire field of view was used as the ROI. Data are mean ± SEM for 7 cells.
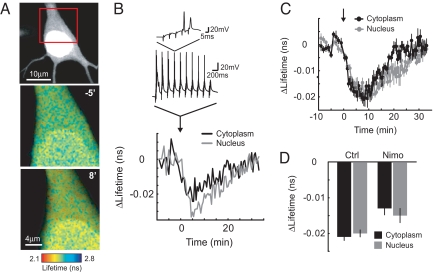
We used EKAR to study the dynamics of ERK signaling in the cytoplasm and nucleus of hippocampal pyramidal neurons in cultured brain slices. In neurons, ERK signals trigger downstream effects in both the cytoplasm and the nucleus (1). However, it is not known whether the dynamics and regulation of ERK activation are similar in these compartments. We therefore cotransfected pyramidal neurons with EKARcyto and EKARnuclear and used synaptic stimulation (5 stimuli at 100 Hz repeated 10 times at 5 Hz, all repeated 3 times at 0.1 Hz) to activate neurons in a theta-burst pattern (2–3 action potential bursts repeated at a theta frequency of 5 Hz), which mimics hippocampal firing patterns in awake animals and induces long-term potentiation (26). Theta-burst stimuli triggered robust ERK activation in the somatic cytoplasm and the nucleus (ΔLifetimecytoplasm = −0.88 ± 0.04%, ΔLifetimenucleus = −0.83 ± 0.05%; Fig. 5 A–C) with similar time courses; ERK activity peaked within 10 min (tpeak, cytoplasm = 7.8 ± 1.2 min, tpeak, nuclear = 8.4 ± 1.0 min, P > 0.5; Fig. 5 B and C) and decayed to baseline levels within 35 min (τdecay, cytoplasm = 10.9 ± 2.8 min, τdecay, nuclear = 14.7 ± 2.1 min, P > 0.2; Fig. 5 A–C). Previous studies suggest that ERK signaling may be preferentially activated by Ca2+ influx through L-type VGCCs (27–29). Application of the L-type VGCC blocker nimodipine (20 μM) reduced ERK activation to similar extents in the nucleus and cytoplasm (ΔLifetimecytoplasm = −0.54 ± 0.08%, ΔLifetimenucleus = −0.63 ± 0.08%, P > 0.4; Fig. 5D), indicating that Ca2+ influx through L-type VGCCs is an important trigger for ERK signaling. The dynamics and regulation of ERK activity following theta-burst stimuli are therefore similar in the somatic cytoplasm and nucleus, possibly because of action potential-evoked ERK activation by relatively global Ca2+ influx (30) and rapid diffusional exchange between the 2 compartments (31).
Fig. 5.
ERK activation in the cytoplasm and nucleus after theta-burst stimuli. (A) (Top) GFP fluorescence image of a hippocampal pyramidal neuron expressing EKARcyto and EKARnuclear in a cultured brain slice. (Middle and Bottom) Fluorescence lifetime images of the same cell (boxed area). Images are from before (−5 min) and after (8 min) theta-burst stimuli. (B) Changes in lifetime in the cytoplasm and nucleus for the example shown in A. At time = 0, theta-burst stimuli (5 synaptic stimuli at 100 Hz, repeated 10 times at 5 Hz) were delivered 3 times with 10-second intervals. Example perforated patch recordings at the soma are shown. ROIs for the cytoplasm and nucleus were distinguished based on fluorescence intensity. (C) Time course of ERK activation in the nucleus and cytoplasm after theta-burst stimuli. Data are from 7 cells. (D) Lifetime changes following theta-burst stimuli in the nucleus and cytoplasm in the presence or absence of the L-type VGCC blocker nimodipine (20 μM). Lifetime changes were the average of 3 time points around the maximum change within 15 min of the stimulus. Data are from 7 and 6 cells for control and nimodipine conditions, respectively.
Comparison of ERK Activity Reporters.
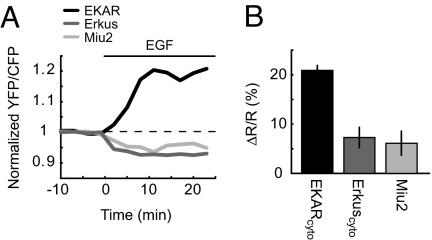
Several fluorescent indicators of ERK activity have been described previously (32–34). We compared the response of EKARcyto with published reporters (Miu2 and Erkus) side-by-side in HEK293 cells stimulated with EGF. Miu2 consists of ERK tagged with CFP and YFP and undergoes a conformational change upon unbinding of MEK (33). Erkus is a sensor based on design principles similar to those used in EKAR, but with a different substrate peptide, phospho-binding domain, docking site, and linkers (34). EGF stimulation triggered small increases in the ratio of donor to acceptor fluorescence in cells expressing Miu2 or Erkuscyto (ΔR/RCFP/YFP, Miu2 = 6.1 ± 2.5%, P < 0.05; ΔR/RCFP/YFP, Erkus = 7.3 ± 2.1%, P < 0.01; Fig. 6). The signal of EKARcyto under the same conditions was approximately 3 times as large as those of Miu2 and Erkuscyto (ΔR/RYFP/CFP = 20.9 ± 1.0%; versus Miu2: P < 0.01; versus Erkuscyto: P < 0.01; Fig. 6). Consistently, the fluorescence lifetime change for a mRFP1-EGFP version of Miu2 was smaller than that of EKARcyto (ΔLifetimeMiu2 = +0.56 ± 0.16%, ΔLifetimeEKAR = −2.92 ± 0.07%, P < 0.01; Table S1). EKAR is therefore likely preferable for monitoring ERK activity, especially in small compartments.
Fig. 6.
Comparison of ERK activity reporters. (A) EGF-induced changes in the acceptor-to-donor fluorescence ratio in HEK293 cells expressing CFP-YFP versions of EKARcyto, Erkuscyto, or Miu2. Example traces from individual experiments are shown. (B) Ratio changes for CFP-YFP versions of EKARcyto, Erkuscyto, and Miu2 in HEK293 cells after EGF application. The ratio, R, was measured as the YFP/CFP ratio for EKARcyto and the CFP/YFP ratio for Erkuscyto and Miu2. Data are mean ± SEM for ≥5 ROIs from 5 dishes.
Signal-to-Noise Ratios of FLIM and Ratiometric FRET Measurements.
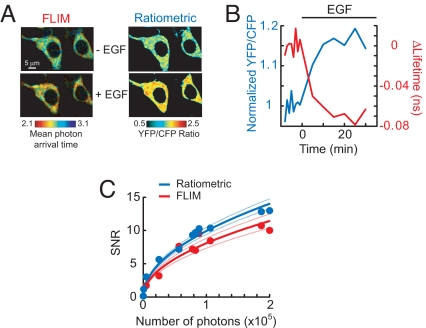
We measured EKAR FRET signals by using both 2pFLIM (e.g., Fig. 2A) and intensity-based ratiometric measurements (Fig. 2C). Theory predicts that ratiometric methods may have a higher signal-to-noise ratio (SNR) than FLIM measurements (3, 35). We therefore used EKAR to compare the SNRs directly. We acquired interleaved intensity and FLIM images of HEK293 cells expressing the CFP-YFP version of EKARcyto before and after EGF stimulation (Fig. 7A). The excitation and fluorescence detection parameters were identical for both sets of images. No corrections were made for spectral bleed-through in the intensity images. The SNR was calculated as the EGF-induced change in YFP/CFP ratio (ΔR/R) or fluorescence lifetime divided by the standard deviation of baseline fluctuations. Intensity-based measurements provided a slightly higher SNR than FLIM across a wide range of photon counts (P < 0.05; Fig. 7C), although the differences were surprisingly small (< 20%). Therefore, intensity-based FRET measurements may be preferable to FLIM in certain experimental situations (see Discussion). We also attempted to compare SNRs using the EGFP-mRFP1 version of EKARcyto; however, the acceptor fluorescence of this sensor was too dim to provide a useable signal, likely because of the poor quantum yield of mRFP1 (36).
Fig. 7.
Signal-to-noise ratios of FLIM and intensity-based FRET measurements. (A) FLIM and YFP/CFP ratio images of HEK293 cells transfected with a CFP-YFP version of EKARcyto before and after EGF (100 ng/ml) application. The FLIM image is color-coded based on mean photon arrival times (see SI Text). (B) Lifetime (red) and ratio (blue) changes for the example shown in A. (C) SNRs of FLIM and ratiometric measurements at various numbers of donor photons (N). Each data point represents a single experiment; FLIM and intensity images were interleaved. The data were fitted by using the relationship SNR ∼ (N)1/2. Light blue and light red lines indicate the 95% confidence intervals.
Discussion
We have designed and tested EKAR, a genetically encoded, FRET-based sensor of ERK activity. EKAR selectively and reversibly reported ERK activity after EGF stimulation in HEK293 cells and following back-propagating action potentials or theta-burst stimuli in hippocampal pyramidal neurons in brain slices. EKAR therefore allows for the analysis of ERK signaling in living cells.
Is EKAR's signal sufficient to address biological questions related to ERK signaling? We used EKAR to measure simultaneously the dynamics of ERK activity in the nucleus and cytoplasm of pyramidal neurons following physiological theta-burst stimuli (Fig. 5). Ca2+ influx through L-type VGCCs was an important trigger for ERK activity in both compartments (Fig. 5D). We also used EKAR in pyramidal neurons to monitor ERK activity in small dendrites following back-propagating action potentials (Fig. 4), and we measured EGF-induced ERK activation in 2 subcellular compartments simultaneously in HEK293 cells (Fig. 2B). EKAR responses in HEK293 cells following EGF stimulation had high SNRs even with modest numbers of photons (Fig. 7C), indicating that the SNR is sufficient to measure ERK activity following physiological stimuli and in small compartments with limited photon counts. Furthermore, the CFP-YFP version of EKARcyto provided an acceptor-to-donor fluorescence ratio change of ≈20% (Fig. 2C), which is comparable to those of other sensors, such as AKAR2 (21) and the CaMKII sensor Camuiα (37), that have been used to study the spatiotemporal dynamics of signaling events in living cells. We therefore conclude that EKAR's signal is sufficient to examine the spatial and temporal dynamics of ERK signaling under biologically relevant conditions in living cells. We note, however, that EKAR's signal is smaller than those of the best reporters, such as Ras sensors (10, 38) and AKAR3 (39). Also, as with all sensors, EKAR expression may perturb endogenous signaling, thus requiring experiments to measure sensor-dependent effects in each experimental preparation (4, 25, 40).
The design principles demonstrated here should be applicable to the design of similar kinase activity reporters. In particular, the addition of EKAR's central linker will likely improve the signals of other sensors of this type, including the PKC sensor CKAR (41), Src reporters (42), and reporters of receptor phosphorylation (6, 7), as we demonstrated for AKAR2 (Fig. 2E). Also, the inclusion of docking sites will aid the design of new, selective sensors for kinases with nonspecific substrate phosphorylation sequences, such as p38 and JNK (13).
We measured stimulus-induced EKAR FRET changes with both 2pFLIM and intensity-based ratiometric methods. Ratiometric FRET methods provided a slightly higher SNR than did FLIM measurements. It might therefore be advantageous to use ratiometric intensity methods in certain experimental situations, such as when using an intramolecular sensor to measure FRET signals before and after a stimulus in the same sample. However, under most experimental conditions, FLIM is likely preferable, especially for quantitative FRET measurements and comparisons of FRET across samples in light scattering tissue (3).
Materials and Methods
Sensor Construction.
EKAR was assembled in the pCI vector (Promega) behind the CMV promoter. EKARnuclear contains in the 5′ to 3′ direction: mRFP1 (36), the WW domain of Pin1 (amino acids 1–54 of human Pin1), a 72-glycine linker (3 24-Gly segments separated by Ala-Arg and Ala-Ser) (15), a Cdc25C peptide (PDVPRTPVGK, amino acids 43–52 of human Cdc25C) (43), the ERK docking site (FQFP) (14) and EGFP. The linkers adjacent to mRFP1 and EGFP are DLKL and RAREP, respectively. The nuclear export sequence of MEK (LQKKLEELELDE) (44) was included at the 3′ end of EGFP for EKARcyto. The CFP-YFP versions of EKARnuclear and EKARcyto were made by changing the fluorescent proteins to monomeric Cerulean (A206K mutation) (19) and monomeric Venus (A206K mutation) (20) at the N and C terminus, respectively. The linkers adjacent to Cerulean and Venus are RIH and PRAREI, respectively.
Preparations.
HEK293 cells were cultured in DMEM with 10% FBS and were transfected with EKAR by using Lipofectamine 2000 (Invitrogen) or FuGENE (Roche). One-to-2 days after transfection, the cells were serum starved in 0.2% FBS overnight (≈12 h). Imaging was carried out in a solution containing: 25 mM Hepes (pH 7.4), 114 mM NaCl, 2.2 mM KCl, 2 mM CaCl2, 2 mM MgCl2, 22 mM NaHCO3, 1.1 mM NaH2PO4 and 2 mM glucose at room temperature. EGF (100 ng/ml final concentration, Calbiochem) was applied to cells plated in a 35-mm culture dish by using a pipette. Cells expressing AKAR2 were stimulated with an adenylate cyclase activator (25 μM forskolin) and a phosphodiesterase inhibitor (100 μM IBMX).
Hippocampal slice cultures were prepared from postnatal day 6–8 rats, as described (45), in accordance with the animal care and use guidelines of Cold Spring Harbor Laboratory and Janelia Farm Research Campus. After 5–8 days in culture, cells were transfected by ballistic gene transfer. Neurons were imaged 2 days after transfection in artificial cerebral spinal fluid (ACSF) containing: 127 mM NaCl, 2.5 mM KCl, 4 mM CaCl2, 4 mM MgCl2, 25 mM NaHCO3, 1.25 mM NaH2PO4 and 25 mM glucose aerated with 95% O2 and 5% CO2 at room temperature.
Imaging and Electrophysiology.
2pFLIM was performed as described previously (10, 25). In brief, we used a custom-built 2-photon microscope with custom software integrated into ScanImage (46). A Ti:Sapphire laser tuned to 910 nm was used to excite EGFP for fluorescence lifetime measurements. Fluorescence decay curves were measured by comparing the times of laser pulses (80 MHz) detected by a photodiode (FDS010; Thorlabs) and photon pulses from a fast PMT (H7422–40; Hamamatsu) by using a time-correlated single-photon counting board (SPC-730; Becker–Hickl) (10, 47). Red fluorescence photons were acquired simultaneously by using a second PMT (R3896; Hamamatsu). Only epifluorescence photons were collected. “Green” and “red” fluorescence photons were separated with a dichroic mirror (565 nm) and barrier filters (510/70, 635/90; Chroma). A similar setup was used for CFP-YFP EKAR imaging, except with 800-nm excitation light and different detection optics (dichroic mirror: 505 nm; filters: 480/40, 535/50).
Perforated patch-clamp recordings (Figs. 4 and 5), back-propagating action potential stimuli (Fig. 4), and synaptic stimulation (Fig. 5) were performed as previously described (10, 25, 48). See SI Text for details.
Biochemistry.
EKARcyto-expressing COS7 cells were cotransfected with constitutively active MEK or MKP1, stimulated with 60 J/m2 UV-C, or activated with 1 μM PMA (10 min). Standard Western blot analysis was performed. See SI Text for details.
Data Analysis.
We used fluorescence lifetime measurements to quantify the FRET signals reported by EKAR. Fluorescence lifetimes were measured by using time-correlated single-photon counting following pulsed excitation, as described previously (10) (see SI Text).
Fluorescence lifetime changes were measured for the entire field-of-view, typically containing 2 or 3 HEK293 cells or a ≈20 μm stretch of pyramidal neuron dendrite. Because EGF was applied to HEK293 cells in a dish by using a pipette, the onset kinetics of the EKAR signal depended on both the diffusion of EGF to the cell of interest and the activation of ERK, resulting in large jitter of response onset times. We therefore calculated the lifetime change as the maximum lifetime change within 20 min after EGF application.
All P values are from 2-tailed t tests. The null hypothesis for all tests stated that the mean was equal to zero, except for the comparisons between linkers (Fig. 2E), sensors (Fig. 6B), and SNRs (Fig. 7C) for which the null hypothesis stated that the means were the same.
SNR Comparison of FLIM and Intensity-Based Measurements.
Standard ratiometric and FLIM imaging methods were performed in HEK293 cells expressing the CFP-YFP version of EKARcyto. See SI Text and Fig. S2 for details.
Supplementary Material
Acknowledgments.
We thank B. Burbach, C. Zhang, H. White, B. Shields, S. Winfrey, and N. Ghitani for technical assistance; D. Yue (John Hopkins, Baltimore) for the glycine linker; D. Litchfield (University of Western Ontario, London, Ontario, Canada) for Pin1; D. Morrsion (National Cancer Institute, Rockville, MD) for Cdc25C; J. Blenis (Harvard Medical School, Boston) for murine RSK2; A. Miyawaki (RIKEN, Saitama, Japan) for the circularly permuted Venus variants; R. Tsien (University of California at San Diego, La Jolla, CA) for AKAR2; M. Matsuda (Osaka University, Osaka, Japan) for Miu2; and Y. Umezawa (University of Tokyo, Tokyo, Japan) for Erkus. This work was supported by the Howard Hughes Medical Institute, the National Institutes of Health, and a David and Fanny Luke Fellowship (to C.D.H.).
Footnotes
The authors declare no conflict of interest.
This article is a PNAS Direct Submission.
This article contains supporting information online at www.pnas.org/cgi/content/full/0804598105/DCSupplemental.
References
- 1.Thomas GM, Huganir RL. MAPK cascade signalling and synaptic plasticity. Nat Rev Neurosci. 2004;5:173–183. doi: 10.1038/nrn1346. [DOI] [PubMed] [Google Scholar]
- 2.Marshall CJ. Specificity of receptor tyrosine kinase signaling: transient versus sustained extracellular signal-regulated kinase activation. Cell. 1995;80:179–185. doi: 10.1016/0092-8674(95)90401-8. [DOI] [PubMed] [Google Scholar]
- 3.Yasuda R. Imaging spatiotemporal dynamics of neuronal signaling using fluorescence resonance energy transfer and fluorescence lifetime imaging microscopy. Curr Opin Neurobiol. 2006;16:551–561. doi: 10.1016/j.conb.2006.08.012. [DOI] [PubMed] [Google Scholar]
- 4.Miyawaki A. Visualization of the spatial and temporal dynamics of intracellular signaling. Dev Cell. 2003;4:295–305. doi: 10.1016/s1534-5807(03)00060-1. [DOI] [PubMed] [Google Scholar]
- 5.Zhang J, Ma Y, Taylor SS, Tsien RY. Genetically encoded reporters of protein kinase A activity reveal impact of substrate tethering. Proc Natl Acad Sci USA. 2001;98:14997–15002. doi: 10.1073/pnas.211566798. [DOI] [PMC free article] [PubMed] [Google Scholar]
- 6.Ting AY, Kain KH, Klemke RL, Tsien RY. Genetically encoded fluorescent reporters of protein tyrosine kinase activities in living cells. Proc Natl Acad Sci USA. 2001;98:15003–15008. doi: 10.1073/pnas.211564598. [DOI] [PMC free article] [PubMed] [Google Scholar]
- 7.Sato M, et al. Fluorescent indicators for imaging protein phosphorylation in single living cells. Nat Biotechnol. 2002;20:287–294. doi: 10.1038/nbt0302-287. [DOI] [PubMed] [Google Scholar]
- 8.Ni Q, Titov DV, Zhang J. Analyzing protein kinase dynamics in living cells with FRET reporters. Methods. 2006;40:279–286. doi: 10.1016/j.ymeth.2006.06.013. [DOI] [PubMed] [Google Scholar]
- 9.Peter M, et al. Multiphoton-FLIM quantification of the EGFP-mRFP1 FRET pair for localization of membrane receptor-kinase interactions. Biophys J. 2005;88:1224–1237. doi: 10.1529/biophysj.104.050153. [DOI] [PMC free article] [PubMed] [Google Scholar]
- 10.Yasuda R, et al. Supersensitive Ras activation in dendrites and spines revealed by two-photon fluorescence lifetime imaging. Nat Neurosci. 2006;9:283–291. doi: 10.1038/nn1635. [DOI] [PubMed] [Google Scholar]
- 11.Gonzalez FA, Raden DL, Davis RJ. Identification of substrate recognition determinants for human ERK1 and ERK2 protein kinases. J Biol Chem. 1991;266:22159–22163. [PubMed] [Google Scholar]
- 12.Lu PJ, Zhou XZ, Shen M, Lu KP. Function of WW domains as phosphoserine- or phosphothreonine-binding modules. Science. 1999;283:1325–1328. doi: 10.1126/science.283.5406.1325. [DOI] [PubMed] [Google Scholar]
- 13.Bardwell L. Mechanisms of MAPK signalling specificity. Biochem Soc Trans. 2006;34:837–841. doi: 10.1042/BST0340837. [DOI] [PMC free article] [PubMed] [Google Scholar]
- 14.Jacobs D, et al. Multiple docking sites on substrate proteins form a modular system that mediates recognition by ERK MAP kinase. Genes Dev. 1999;13:163–175. [PMC free article] [PubMed] [Google Scholar]
- 15.Mori MX, Erickson MG, Yue DT. Functional stoichiometry and local enrichment of calmodulin interacting with Ca2+ channels. Science. 2004;304:432–435. doi: 10.1126/science.1093490. [DOI] [PubMed] [Google Scholar]
- 16.Lu PJ, et al. Critical role of WW domain phosphorylation in regulating phosphoserine binding activity and Pin1 function. J Biol Chem. 2002;277:2381–2384. doi: 10.1074/jbc.C100228200. [DOI] [PubMed] [Google Scholar]
- 17.Piston DW, Sandison DR, Webb WW. In: Time-Resolved Laser Spectroscopy in Biochemistry III. Lakowicz J R, editor. Bellingham, WA: SPIE; 1992. pp. 379–389. [Google Scholar]
- 18.Gratton E, et al. Fluorescence lifetime imaging for the two-photon microscope: Time-domain and frequency-domain methods. J Biomed Opt. 2003;8:381–390. doi: 10.1117/1.1586704. [DOI] [PubMed] [Google Scholar]
- 19.Rizzo MA, Springer GH, Granada B, Piston DW. An improved cyan fluorescent protein variant useful for FRET. Nat Biotechnol. 2004;22:445–449. doi: 10.1038/nbt945. [DOI] [PubMed] [Google Scholar]
- 20.Nagai T, et al. A variant of yellow fluorescent protein with fast and efficient maturation for cell-biological applications. Nat Biotechnol. 2002;20:87–90. doi: 10.1038/nbt0102-87. [DOI] [PubMed] [Google Scholar]
- 21.Zhang J, et al. Insulin disrupts beta-adrenergic signalling to protein kinase A in adipocytes. Nature. 2005;437:569–573. doi: 10.1038/nature04140. [DOI] [PubMed] [Google Scholar]
- 22.Mansour SJ, et al. Transformation of mammalian cells by constitutively active MAP kinase kinase. Science. 1994;265:966–970. doi: 10.1126/science.8052857. [DOI] [PubMed] [Google Scholar]
- 23.Sun H, Charles CH, Lau LF, Tonks NK. MKP-1 (3CH134), an immediate early gene product, is a dual specificity phosphatase that dephosphorylates MAP kinase in vivo. Cell. 1993;75:487–493. doi: 10.1016/0092-8674(93)90383-2. [DOI] [PubMed] [Google Scholar]
- 24.Davis RJ. Signal transduction by the JNK group of MAP kinases. Cell. 2000;103:239–252. doi: 10.1016/s0092-8674(00)00116-1. [DOI] [PubMed] [Google Scholar]
- 25.Harvey CD, Yasuda R, Zhong H, Svoboda K. The spread of Ras activity triggered by activation of a single dendritic spine. Science. 2008;321:136–140. doi: 10.1126/science.1159675. [DOI] [PMC free article] [PubMed] [Google Scholar]
- 26.Larson J, Wong D, Lynch G. Patterned stimulation at the theta frequency is optimal for the induction of hippocampal long-term potentiation. Brain Res. 1986;368:347–350. doi: 10.1016/0006-8993(86)90579-2. [DOI] [PubMed] [Google Scholar]
- 27.Wu GY, Deisseroth K, Tsien RW. Spaced stimuli stabilize MAPK pathway activation and its effects on dendritic morphology. Nat Neurosci. 2001;4:151–158. doi: 10.1038/83976. [DOI] [PubMed] [Google Scholar]
- 28.Dolmetsch RE, et al. Signaling to the nucleus by an L-type calcium channel-calmodulin complex through the MAP kinase pathway. Science. 2001;294:333–339. doi: 10.1126/science.1063395. [DOI] [PubMed] [Google Scholar]
- 29.Dudek SM, Fields RD. Somatic action potentials are sufficient for late-phase LTP-related cell signaling. Proc Natl Acad Sci USA. 2002;99:3962–3967. doi: 10.1073/pnas.062510599. [DOI] [PMC free article] [PubMed] [Google Scholar]
- 30.Adams JP, Dudek SM. Late-phase long-term potentiation: getting to the nucleus. Nat Rev Neurosci. 2005;6:737–743. doi: 10.1038/nrn1749. [DOI] [PubMed] [Google Scholar]
- 31.Wiegert JS, Bengtson CP, Bading H. Diffusion and not active transport underlies and limits ERK1/2 synapse-to-nucleus signaling in hippocampal neurons. J Biol Chem. 2007;282:29621–29633. doi: 10.1074/jbc.M701448200. [DOI] [PubMed] [Google Scholar]
- 32.Green HM, Alberola-Ila J. Development of ERK activity sensor, an in vitro, FRET-based sensor of extracellular regulated kinase activity. BMC Chem Biol. 2005;5:1. doi: 10.1186/1472-6769-5-1. [DOI] [PMC free article] [PubMed] [Google Scholar]
- 33.Fujioka A, et al. Dynamics of the Ras/ERK MAPK cascade as monitored by fluorescent probes. J Biol Chem. 2006;281:8917–8926. doi: 10.1074/jbc.M509344200. [DOI] [PubMed] [Google Scholar]
- 34.Sato M, Kawai Y, Umezawa Y. Genetically encoded fluorescent indicators to visualize protein phosphorylation by extracellular signal-regulated kinase in single living cells. Anal Chem. 2007;79:2570–2575. doi: 10.1021/ac062171d. [DOI] [PubMed] [Google Scholar]
- 35.Neher RA, Neher E. Applying spectral fingerprinting to the analysis of FRET images. Microsc Res Tech. 2004;64:185–195. doi: 10.1002/jemt.20078. [DOI] [PubMed] [Google Scholar]
- 36.Campbell RE, et al. A monomeric red fluorescent protein. Proc Natl Acad Sci USA. 2002;99:7877–7882. doi: 10.1073/pnas.082243699. [DOI] [PMC free article] [PubMed] [Google Scholar]
- 37.Takao K, et al. Visualization of synaptic Ca2+/calmodulin-dependent protein kinase II activity in living neurons. J Neurosci. 2005;25:3107–3112. doi: 10.1523/JNEUROSCI.0085-05.2005. [DOI] [PMC free article] [PubMed] [Google Scholar]
- 38.Mochizuki N, et al. Spatio-temporal images of growth-factor-induced activation of Ras and Rap1. Nature. 2001;411:1065–1068. doi: 10.1038/35082594. [DOI] [PubMed] [Google Scholar]
- 39.Allen MD, Zhang J. Subcellular dynamics of protein kinase A activity visualized by FRET-based reporters. Biochem Biophys Res Commun. 2006;348:716–721. doi: 10.1016/j.bbrc.2006.07.136. [DOI] [PubMed] [Google Scholar]
- 40.Neher E, Augustine GJ. Calcium gradients and buffers in bovine chromaffin cells. J Physiol. 1992;450:273–301. doi: 10.1113/jphysiol.1992.sp019127. [DOI] [PMC free article] [PubMed] [Google Scholar]
- 41.Violin JD, Zhang J, Tsien RY, Newton AC. A genetically encoded fluorescent reporter reveals oscillatory phosphorylation by protein kinase C. J Cell Biol. 2003;161:899–909. doi: 10.1083/jcb.200302125. [DOI] [PMC free article] [PubMed] [Google Scholar]
- 42.Wang Y, et al. Visualizing the mechanical activation of Src. Nature. 2005;434:1040–1045. doi: 10.1038/nature03469. [DOI] [PubMed] [Google Scholar]
- 43.Verdecia MA, et al. Structural basis for phosphoserine-proline recognition by group IV WW domains. Nat Struct Biol. 2000;7:639–643. doi: 10.1038/77929. [DOI] [PubMed] [Google Scholar]
- 44.Fukuda M, Gotoh I, Gotoh Y, Nishida E. Cytoplasmic localization of mitogen-activated protein kinase kinase directed by its NH2-terminal, leucine-rich short amino acid sequence, which acts as a nuclear export signal. J Biol Chem. 1996;271:20024–20028. doi: 10.1074/jbc.271.33.20024. [DOI] [PubMed] [Google Scholar]
- 45.Stoppini L, Buchs PA, Muller DA. A simple method for organotypic cultures of nervous tissue. J Neurosci Methods. 1991;37:173–182. doi: 10.1016/0165-0270(91)90128-m. [DOI] [PubMed] [Google Scholar]
- 46.Pologruto TA, Sabatini BL, Svoboda K. ScanImage: Flexible software for operating laser-scanning microscopes. Biomed Eng Online. 2003;2:13. doi: 10.1186/1475-925X-2-13. [DOI] [PMC free article] [PubMed] [Google Scholar]
- 47.Lakowicz JR. Principles of Fluorescence Spectroscopy. New York: Plenum; 1999. [Google Scholar]
- 48.Harvey CD, Svoboda K. Locally dynamic synaptic learning rules in pyramidal neuron dendrites. Nature. 2007;450:1195–1200. doi: 10.1038/nature06416. [DOI] [PMC free article] [PubMed] [Google Scholar]
Associated Data
This section collects any data citations, data availability statements, or supplementary materials included in this article.


