

SUMMARY
Why do the epileptogenic foci appear hypometabolic on interictal glucose metabolism positron emission tomography (PET) in a substantial proportion of patients with focal epilepsy but appear normo- or even hyper-metabolic in others? Such observations on interictal PET have not been fully explained by the frequency of interictal spike discharges alone. In the present study using digital electrocorticography monitoring system with high-frequency sampling, we determined how well regression models using spectral ECoG measures and spike frequency derived from 651 intracranial electrode sites explained cortical glucose metabolic patterns in six children with nonlesional focal epilepsy. Univariate regression analysis demonstrated that spectral amplitudes at gamma ranges (32–64, 64–100, and 100–200 Hz) were tightly correlated with interictal glucose uptake in the given electrode site in all children. Spike frequency was negatively correlated with interictal glucose uptake in three patients, whose epileptogenic focus appeared hypometabolic and interictal epileptiform discharge often consisted of a spike followed by a subsequent delta-wave. Conversely, spike frequency was positively correlated with interictal glucose uptake in the other three patients, whose epileptogenic foci appeared more hypermetabolic compared to the surrounding regions and associated with frequent interictal spike bursts. The spatial pattern of interictal glucose metabolism in nonlesional focal epilepsy may be better explained by gamma-oscillations derived from epileptiform and physiological neuronal activities rather than the frequency of interictal epileptiform discharges alone.
Keywords: subdural electroencephalography (EEG) recording, interictal fast wave activity, epilepsy surgery, functional MRI (fMRI), interictal glucose hypermetabolism
INTRODUCTION
Glucose metabolism positron emission tomography (PET) imaging using a tracer of 2-deoxy-2-[18F] fluoro-D-glucose (FDG) has been widely utilized as a part of presurgical evaluation for patients with medically-uncontrolled focal epilepsy (Koepp and Woermann, 2005). Focal glucose hypometabolism on interictal FDG PET has been considered a good indicator of the dysfunctional cortex involving the epileptogenic focus especially in patients with nonlesional focal epilepsy (Chugani et al., 1990; Lee et al., 2005). Yet, other studies reported that the presumed epileptogenic focus can be hypermetabolic (Chugani et al., 1993; Maquet et al., 1995; De Tiege et al., 2004) or normo-metabolic (Juhász et al., 2000; Lee et al., 2005) on interictal FDG PET in patients with nonlesional focal epilepsy. Why do the epileptogenic foci appear hypometabolic on interictal FDG PET in a substantial proportion of patients with focal epilepsy but appear normo- or even hyper-metabolic in others? The mechanism of altered metabolic pattern in nonlesional focal epilepsy has not been fully explained by the frequency of interictal epileptiform discharges alone (Engel et al., 1982). Previous studies using PET and functional magnetic resonance imaging (MRI), for example, suggested that frequent interictal epileptiform discharges may induce metabolic and hemodynamic activation in some population with focal epilepsy (Chugani et al., 1993; Maquet et al., 1995; De Tiege et al., 2004; Gotman et al., 2006; Kobayashi et al., 2006a). Yet, our recent study of children with lesional epilepsy associated with tuberous sclerosis complex showed that frequent interictal epileptiform discharges were rather associated with glucose hypometabolism (Nishida et al., 2007), and other functional MRI studies demonstrated that interictal epileptiform discharges were associated with hemodynamic deactivation in some patients with focal epilepsy (Federico et al., 2005; Kobayashi et al., 2006b). Association between frequent interictal spike activity and glucose hypometabolism as well as cortical deactivation was attributed to slow-wave components following spike discharges in these studies (Kobayashi et al., 2006b; Nishida et al., 2007).
In the present study, we hypothesized that the fast-wave electrocorticography (ECoG) components such as gamma-range oscillations derived from physiological and pathological neuronal activities are associated with high glucose metabolism, whereas slow-wave components are associated with decreased glucose metabolism in nonlesional focal epilepsy. It has been reported that cortical gamma activities are tightly linked with various forms of physiological activity (Crone et al., 1998; Fries et al., 2001; Womelsdorf et al., 2006; Lachaux et al., 2007) and well correlated with hemodynamic activation on functional MRI (Niessing et al., 2005). In the present study using digital ECoG monitoring system with a sampling frequency of 1,000 Hz, we measured spectral amplitudes ranging from delta to high-frequency gamma activity (0.5 – 200 Hz) in each subdural electrode site, and subsequently determined how well electrophysiology measures including spectral amplitudes and spike frequency explained cortical glucose metabolic patterns in nonlesional focal epilepsy.
METHODS
Patients
The inclusion criteria of the present study included: (i) age ranging from 0.5 years to 17 years, (ii) diagnosis of uncontrolled focal epilepsy, (iii) absence of cortical abnormalities (such as tumor or cortical dysplasia) visualized on MRI (Juhász et al.,2000), (iv) two-stage epilepsy surgery using extraoperative ECoG monitoring in Children’s Hospital of Michigan, Detroit between April 2006 and July 2007, (v) FDG PET performed within 12 months prior to the implantation of subdural electrodes (Nishida et al., 2007), and (vi) ECoG data sampling frequency set at 1,000 Hz. The exclusion criteria included history of previous epilepsy surgery. We studied a consecutive series of six children (age: 3 years – 16 years; four girls and two boys) who satisfied the inclusion and exclusion criteria (Table 1). All six children underwent scalp video-electroencephalography (EEG) monitoring, MRI, FDG PET, and chronic intracranial ECoG monitoring with subdural electrodes as part of their pre-surgical evaluation. The study has been approved by the Institutional Review Board at Wayne State University, and written informed consent was obtained from the parents or guardians of all subjects.
Table 1. Patient Data.
y: year. mo: month. G: girl. B: boy. F: frontal. C: central. P: parietal. O: occipital. T: temporal. Lt: left. Rt: right. SBS: secondary bilateral synchrony. VNS: vagus nerve stimulator.
| Patient Number | Age at surgery | Gender | Location of Interictal Spikes on Scalp EEG | Surgical Resection | Pathology | State during FDG PET Uptake Period | Finding of Interictal FDG PET | Interval between PET and ECoG measurements |
|---|---|---|---|---|---|---|---|---|
| 1 | 3y5m | G | Rt T | Rt T | Dysplasia | Awake & Asleep | Hypometabolism in Rt T | 3 mo |
| 2 | 4y6m | G | Lt CFPT with occasional SBS | Lt FTPO | Dysplasia | Awake | Hypometabolism in Lt Hemisphere* | 6 mo |
| 3 | 5y11m | G | Rt POTF With occasional SBS | Rt TPO | Dysplasia | Awake | Hypermetabolism in Rt PO | 7 mo |
| 4 | 7y0m | B | Rt CPFT with occasional SBS | Rt FP | Dysplasia | Awake | Hypometabolism in Rt C | 3 mo |
| 5 | 10y5m | G | Generalized | Rt FTPO | Gliosis | Awake | Hypermetabolism in Rt FPOT | 4 mo |
| 6 | 16y8m | B | Generalized | No cortical resection but VNS implanted | Not available | Awake & Asleep | Hypometabolism in Rt T and Lt T | 2 mo |
Patient 2 had FDG PET showing widespread mild glucose hypometabolism in the left hemisphere; the brain regions showing frequent interictal spike discharges and ictal onset zones on ECoG appeared more hypermetabolic compared to the surrounding regions in the left hemisphere. Patient 1 was awake for the first 15 minutes and asleep for the subsequent 5 minutes during the PET uptake period. Patient 6 was awake for the first 12 minutes and asleep for the subsequent 8 minutes during the PET uptake period. All five patients who underwent cortical resection have been seizure-free (mean follow-up period: 18 months).
MRI procedure
MRI studies were performed on a GE Signa 3.0-Tesla scanner (GE Medical Systems, Milwaukee, Wisconsin) before subdural electrode placement. Anatomical/volumetric imaging of the whole brain was performed in all patients utilizing a T1-weighted spoiled gradient echo (SPGR) sequence. The 3D SPGR sequence (repetition time [TR] 35 ms; echo time [TE] 5 ms; flip angle, 35°; slice thickness, 1.2 mm; field of view 240 mm) was acquired in the coronal plane.
PET procedure
FDG PET studies were performed using the CTI/Siemens Exact/HR whole-body positron tomograph before subdural electrode placement, as previously described (Juhász et al., 2000). In short, this scanner generates 47 image planes with a slice thickness of 3.125 mm, and the reconstructed image in-plane resolution obtained was 5.5 ± 0.35 mm full width at half-maximum. Following a 40-minute uptake period after the injection of FDG, a 20-minute static scan was acquired. The scalp EEG was monitored throughout the uptake period to verify that all scans were interictal. Subsequently, we determined the state change (awake or sleep) of the patient during the first 20 minutes after FDG administration (Table 1), as previously described (Nishida et al., 2007). None of the patients had seizures within 2 hours before PET tracer injection or a secondarily generalized tonic clonic seizure within 8 hours before PET tracer injection. The mean interval between PET scanning and subdural electrode placement was 4.2 months (range: 2 – 7 months).
Subdural electrode placement
For chronic intracranial ECoG recording, platinum grid electrodes (10 mm intercontact distance, 4 mm diameter; Ad-tech, Racine, WI) were surgically implanted as previously described (Asano et al., 2005). Depth electrodes were also implanted as needed. The placement of intracranial electrodes was guided by the results of scalp video-EEG recording, MRI, and interictal glucose metabolism on FDG PET. All electrode plates were stitched to adjacent plates and/or the edge of dura mater, to avoid movement of subdural electrodes after placement. In addition, intraoperative pictures were taken with a digital camera before dural closure to confirm the spatial accuracy of electrode display on three-dimensional brain surface reconstructed from MRI (Asano et al., 2005).
Extraoperative video-ECoG recording
Extraoperative video-ECoG recordings were performed as previously described (Asano et al., 2003; 2007). Anti-epileptic medications were discontinued or reduced during ECoG monitoring until a sufficient number of habitual seizures were captured. A ground lead and a reference electrode were placed to the contralateral mastoid by a registered EEG technician. Surface electromyography recordings from the left and right deltoid muscles were added as needed. Extraoperative video-ECoG recordings were obtained for three to five days, using a 192-channel Nihon Kohden Neurofax 1100A Digital System (Nihon Kohden America Inc, Foothill Ranch, CA, USA), which has an input impedance of 200 MΩ, a common mode rejection ratio greater than 110 dB, an A/D conversion of 16 bits, a sampling frequency at 1,000 Hz and the amplifier band pass at 0.08 to 300 Hz. Clinical manifestations were assessed using synchronized digital videos. Interictal epileptiform discharges (Asano et al., 2003), ictal discharges (Lee et al., 2000) and state changes (Asano et al., 2007) were visually assessed with a low-frequency filter of 0.53 – 1.6 Hz and high-frequency filter of 300 Hz. A low frequency filter of 5.3 Hz or higher was occasionally used to assess a low-amplitude fast wave activity.
Coregistration of PET, MRI and subdural electrodes
Before subdural electrode placement, FDG PET and MRI SPGR image volumes were co-registered as described previously (Pietrzyk et al., 1994; Juhász et al., 2000) using MPI-Tool (Max-Planck-Institute, Cologne, Germany), which is a software package employing a multipurpose 3D registration technique. Following subdural electrode placement, planar X-ray images (lateral and anterior-posterior images) were acquired for determining the location of the electrodes on the brain surface. Three metallic fiducial markers were placed at anatomically well-defined locations on the patient's head for coregistration of the X-ray with the MRI as previously described (von Stockhausen et al., 1997; Juhász et al., 2000).
In order to reconstruct surface views corresponding to the planar X-ray image, three virtual markers were defined in the SPGR MR image volume at the same position as in the planar X-ray image, as previously described (von Stockhausen et al., 1997; Muzik et al., 2007). Using the software package ‘3D Tool’ (Max-Planck-Institute, Cologne, Germany), a surface view was created which corresponds to the planar X-ray image position and where the location of electrodes was directly defined on the brain surface. The accuracy of this procedure was reported previously as 1.24 ± 0.66 mm with a maximal misregistration of 2.7 mm (von Stockhausen et al., 1997) and was confirmed by intraoperative digital photographs showing in situ locations of the subdural electrodes (Asano et al., 2005). Anatomical landmarks (central sulcus, Sylvian fissure, and gyral pattern) that were readily identifiable on both the photographs and the 3D-reconstructed brain surface were used to verify the exact location of the electrodes. Following coregistration of the subdural grid with the surface view, virtual spheres were created at those locations on the brain surface to represent a projection of the electrodes onto the surface. These spheres mark the position of the electrodes on the cortical surface and allow the assessment of intracranial electrode location relative to the MRI and FDG PET metabolism from varying view angles.
Ranking cortical glucose metabolism on each subdural electrode site
As previously performed (Nishida et al., 2007), glucose metabolism values were rescaled into six fractional units (ranks) with equal range as follows: 0.0 (lowest), 0.2, 0.4, 0.6, 0.8, and 1.0 (highest), using the software package ‘3D Tool’. Subsequently, rescaled PET metabolism was delineated with different colors on each individual 3D-brain surface image (Figure S1 [supplementary data]). Each subdural electrode site was assigned a PET fractional rank shown above, according to the color scale within the brain immediately below each electrode seen on the 3D-brain surface image (Nishida et al., 2007). A subdural electrode site on a boundary between distinct PET colors was given a rank of which area under the electrode was larger. This method allows a more rapid yet accurate estimation of relative cortical glucose metabolism, compared to an alternative method of computation of glucose metabolism by drawing regions of interest in each cortical area as performed in previous studies (Koutroumanidis et al., 1998; Asano et al., 2000).
Quantitative measurement of interictal ECoG spectral amplitudes
ECoG spectral amplitudes for each subdural electrode site were quantitatively measured using a method similar to that reported in our previous study (Nishida et al., 2007). Subdural electrodes showing artifacts (Klem, 2003), depth electrodes, epidural electrodes, electrodes overlying another electrode array, and electrodes facing the presumed non-epileptic hemisphere via the falx were excluded from further analysis, and a total of 651 subdural electrodes (80 – 119 electrodes per subject) were analyzed. The quantitative ECoG analysis was performed using the BESA® EEG V.5.1.8 software (MEGIS Software GmbH, Gräfelfing, Germany).
First, ECoG signals were re-montaged to an average reference, to obtain reference-free topographic maps of spectral measures (Crone et al., 1998; Nishida et al., 2007). A 10-minute ECoG segment during quiet wakefulness and another segment during sleep were selected from the interictal extraoperative ECoG data, based on the following criteria: at least 8 hours after a secondarily generalized tonic clonic seizure and at least 2 hours after other types of clinical seizures (Nishida et al., 2007). A consecutive series of 4.10-second epochs were placed over the 10-minute awake ECoG segment alone in four patients (patients 2 – 5) who were awake during the first 20-minute PET uptake period. Epochs were placed over the 10-minute awake and sleep ECoG segments in the remaining two patients (patients 1 and 6) who were awake and asleep during the first 20- minute PET uptake period.
After the placement of consecutive epochs, an amplitude spectrum (x-axis unit: Hz; y-axis unit: µV/Hz) was created for each epoch and each channel, using Fast Fourier Transformation. The software subsequently displayed the ECoG spectral amplitude (unit: µV) at each epoch within preset frequency bands, which was calculated as the summation of all frequency components under the amplitude spectral curve within the given frequency band. The frequency bands were preset as follows: 0.5–4.0 Hz (‘delta band’), 4.0–8.0 Hz (‘theta band’), 8.0–12.0 Hz (‘alpha band’), 12–16 Hz (‘sigma band’), 16–32 Hz (‘beta band’), 32–64 Hz (‘low-frequency gamma band’), 64–100 Hz (‘high-frequency gamma band’) and 100–200 Hz (‘very high-frequency gamma band’. ECoG spectral amplitudes at 100–200 Hz were not assessed in our previous study where ECoG data were obtained with a sampling frequency at 200 Hz (Nishida et al., 2007). The ECoG spectral amplitude of 32–64 Hz was calculated without a 58–62 Hz component, if visual inspection revealed a 60 Hz artifact peak on the amplitude spectral curve for all subdural electrodes (Asano et al., 2004); similarly, the spectral amplitude at 100–200 Hz was calculated without components at 118–122 Hz and 178–182 Hz, as needed.
Subsequently, ECoG spectral amplitudes for the above-mentioned frequency bands were averaged across the whole awake epochs and separately averaged across the whole sleep epochs. This procedure finally yielded the mean ECoG spectral amplitudes for ‘delta’, ‘theta’, ‘alpha’, ‘sigma’, ‘beta’, ‘low-frequency gamma’, ‘high-frequency gamma’ and ‘very high-gamma’ bands, for each electrode site and for each state. ECoG measures during wakefulness were utilized for further statistical analyses in four patients (patients 2–5) who were awake during the PET uptake period. In the remaining two patients (patients 1 and 6), weighted-average ECoG measures (according to the proportion of state during the first 20-minute PET uptake period) were utilized for further statistical analyses. This approach was taken (Nishida et al., 2007), since a previous study showed that glucose PET pattern during awake state differed from that during sleep in normal controls (Buchsbaum et al., 2001).
Quantitative analysis of spike frequency recorded on ECoG
Quantitative analysis of interictal spike frequency was performed on the ECoG (Asano et al., 2003), using the BESA EEG software (Jacobs et al., 2007). The results of the semi-automatic spike detection procedure were visually reviewed; false positive and negative spikes were corrected (Asano et al., 2003; Jacobs et al., 2007). The same 10- minute awake and sleep segments used in the spectral amplitude analysis were utilized for spike frequency analysis. We have previously reported that the spatial distribution of interictal spike frequency is similar between 10-minute awake and sleep ECoG segments in children with focal epilepsy (Asano et al., 2007). Each electrode site was given a spike frequency measure during wakefulness in four patients (patients 2–5) and weighted-average frequency measure in two patients (patients 1 and 6), as performed in the spectral amplitude analyses described above.
Delineation of ECoG data on 3D-reconstructed MRI
Quantitative measures including ECoG spectral amplitudes as well as interictal spike frequency were delineated on each individual 3D-reconstructed MRI (Figure 1 and Figure 2) as previously described (Asano et al., 2005; Nishida et al., 2007). Electrode positions (x- and y-axis values) on the planar x-ray coordinate were measured for every electrode using Microsoft PowerPoint (Microsoft Corporation, Redmond, WA), and were registered into the SurGe Interpolation Software (Web site: http://mujweb.cz/www/SurGe/surgemain.htm). The topographic map derived from the skull x-ray images was used to display the above-mentioned ECoG measures on the 3D-reconstructed surface image.
Figure 1. FDG PET and ECoG measures in a 3-year-old girl (patient 1) with uncontrolled seizures.


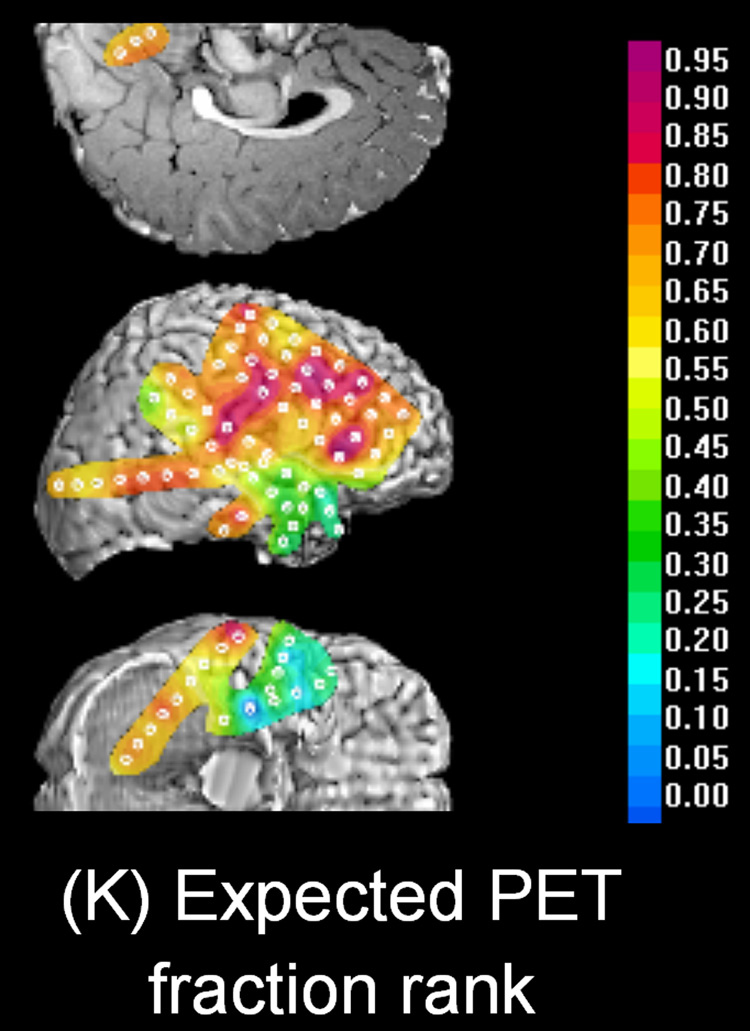
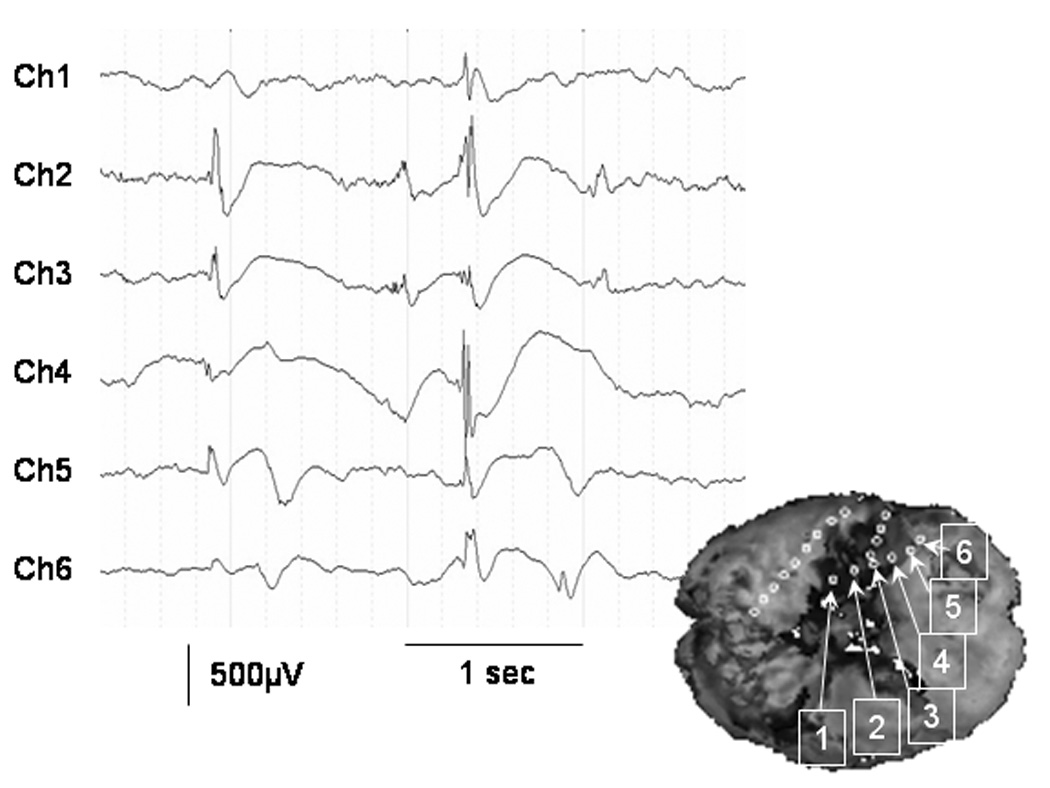
(A) Interictal FDG PET showed focal glucose hypometabolism involving the right temporal region. (B – J) Topographic map of spectral amplitude and interictal spike activity. The hypometabolic area in the right temporal region was associated with decreased spectral amplitudes at gamma-range bands as well as increased spike frequency. (K) Topography of PET fractional ranks expected from the multiple linear regression model: YPET = 0.46 − 0.0034 · XD − 0.0016 · XT + 0.036 · XA − 0.028 · XS + 0.0016 · XB + 0.0045 · XLG + 0.0030 · XHG − 0.016 · XVHG − 0.086 · XSP. The R-square value for this multiple regression model was 0.66. Thereby, the PET fractional rank in a subdural electrode site (YPET) was predicted by ECoG measures including a delta amplitude of (XD), a theta amplitude of (XT), an alpha amplitude of (XA), a sigma amplitude of (XS), a beta amplitude of (XB), a low-frequency gamma amplitude of (XLG), a high-frequency gamma amplitude of (XHG), a very high-frequency gamma amplitude of (XVHG) and interictal spike frequency of (XSP). (L) Frequent interictal epileptiform activities were noted in the right temporal region, and the spike was often followed by a large delta wave. Low frequency filter: 0.27 Hz. High-frequency filter: 300 Hz.
Figure 2. FDG PET and ECoG measures in a 10-year-old girl (patient 5) with uncontrolled seizures.


(A) Interictal FDG PET showed multifocal glucose hypermetabolic regions involving the right frontal, parietal, occipital and posterior temporal regions. (B – J) Topographic map of spectral amplitude and interictal spike activity. The largest hypermetabolic area in the right frontal region was associated with increased spectral amplitudes at gamma-range bands as well as increased spike frequency. (K) Topography of PET fractional ranks expected from the multiple linear regression model: YPET = 0.21 + 0.00057 · XD − 0.00047 · XT − 0.0033 · XA + 0.0077 · XS − 0.0021 · XB + 0.00062 · XLG − 0.0015 · XHG + 0.0021 · XVHG + 0.0053 · XSP. The R-square value for this multiple regression model was 0.57. Thereby, the PET fractional rank in a subdural electrode site (YPET) was predicted by ECoG measures including a delta amplitude of (XD), a theta amplitude of (XT), an alpha amplitude of (XA), a sigma amplitude of (XS), a beta amplitude of (XB), a low-frequency gamma amplitude of (XLG), a high-frequency gamma amplitude of (XHG), a very high-frequency gamma amplitude of (XVHG) and interictal spike frequency of (XSP). (L) Very frequent interictal epileptiform activities were noted in the right hemisphere involving the frontal region. Low frequency filter: 0.27 Hz. High-frequency filter: 300 Hz.
Statistical analysis (Univariate linear regression model)
In order to determine what ECoG measures were correlated to glucose uptake on interictal FDG PET, univariate linear regression analyses were applied to each individual patient, using a method similar to that described previously (Niessing et al., 2005). Thereby, the outcome measure was the PET fractional rank and treated as a continuous variable. ECoG measures as predictors included (i) ‘delta amplitude’, (ii) ‘theta amplitude’, (iii) ‘alpha amplitude’, (iv) ‘sigma amplitude’, (v) ‘beta amplitude’, (vi) ‘low-frequency gamma amplitude’, (vii) ‘high-frequency gamma amplitude’ and (viii) ‘very high-frequency gamma amplitude’ and (ix) ‘interictal spike frequency’. Each univariate linear regression analysis yielded a regression slope for each ECoG measure in each patient. Subsequently, a one-sample t-test was applied to the means of each regression slope. The statistical null hypothesis was that each of the mean regression slopes averaged among the six subjects was zero, whereas the alternative hypothesis was that each mean regression slope was different from zero. A significance level of 0.05 was used, and a 95% confidence interval (95%CI) was calculated for the mean of each regression slope. All statistical analyses were performed using the computer software SPSS 11.5 (SPSS Inc, Chicago, IL, USA).
Statistical analysis (Multiple linear regression model)
In order to determine how well the multiple regression model taking into account all nine ECoG measures explained the variance of glucose metabolic pattern in each patient, a multiple linear regression analysis was applied to each individual patient, as described in our previous study (Nishida et al., 2007). Thereby, the outcome measure was the PET fractional rank and predictors were ECoG measures same as those used in the above-mentioned univariate analysis. Each regression model assigned to each subject yielded an R-square value (an indicator of fitness of the regression models), and the mean of R-square values across six patients was calculated.
In order to determine whether any of the ECoG measures independently predicted PET fractional ranks in the multiple linear regression model, a one-sample t-test was applied to the means of each regression slope. Again, the statistical null hypothesis was that each of the mean regression slopes averaged among the six subjects was zero, whereas the alternative hypothesis was that each mean regression slope was different from zero.
RESULTS
Visual assessment
Individual FDG PET and ECoG data in two cases are presented in Figure 1 (patient 1) and Figure 2 (patient 5). The frequency of interictal spike discharges in the most actively spiking site in each subject ranged from 7.9 to 144.5 per min (Table 2). Visual assessment revealed that brain regions showing increased gamma spectral amplitude were associated with increased glucose metabolism in all children. Frequent interictal epileptiform activity was noted within the areas showing glucose hypometabolism in three children (patients 1, 4 and 6; see example on Figure 1), whose epileptogenic focus appeared hypometabolic and interictal epileptiform discharge often consisted of a spike followed by a subsequent delta-wave (Figure 1). Frequent interictal epileptiform activity was rather associated with increased glucose metabolism in the other three children (patients 2, 3 and 5; see example on Figure 2), whose epileptogenic foci appeared hypermetabolic compared to the surrounding regions and were associated with repetitive spike bursts on interictal ECoG (Figure 2).
Table 2. Findings of interictal spike discharges on ECoG.
| The location of intracranial electrode showing the most frequent interictal spike discharge | The frequency of interictal spike discharges in that electrode (per min) | |
|---|---|---|
| Patient 1 | Rt-T | 12.7 |
| Patient 2 | Lt-F | 11.3 |
| Patient 3 | Rt-P | 124.9 |
| Patient 4 | Rt-P | 7.9 |
| Patient 5 | Rt-O | 144.5 |
| Patient 6 | Rt-T | 44.0 |
Univariate linear regression model
The individual regression slopes for ECoG measures and the mean regression slope across the 6 subjects are presented in Table 3. The one-sample t-test revealed that the mean regression slope for the very high-frequency gamma spectral amplitude (100–200 Hz) was 0.0095, which was greater than zero (95% confidence interval [95%CI]: 0.0025 – 0.0166; p = 0.017). This result indicated that each 1 µV increase in very high-frequency gamma spectral amplitude was associated with an increase in a PET fractional rank by 0.0095 in the univariate linear regression model. Similarly, the mean regression slope for the high-frequency gamma spectral amplitude (64–100 Hz) was 0.0075, which was significantly greater than zero (95%CI: 0.0040 – 0.00109; p = 0.003); that for low-frequency gamma spectral amplitude (32–64 Hz) was 0.0032, which was also greater than zero (95%CI: 0.0017 – 0.0046; p = 0.002). The mean regression slope for beta spectral amplitude (16–32 Hz) was 0.0028 (95% CI: 0.0004 – 0.0052; p = −0.031), which was marginally greater than zero; that for sigma spectral amplitude (12–16 Hz) was 0.0060 (95%CI: 0.0002 – 0.0118; p = 0.044), which was also marginally greater than zero. On the other hand, the mean regression slopes for the remaining ECoG measures (delta, theta, alpha spectral amplitudes or spike frequency) were not significantly different from zero (Table 3).
Table 3. Individual and mean regression slopes for ECoG measures derived from the univariate linear regression models.
The one-sample t-test revealed that the mean regression slope for very high-frequency gamma (100–200 Hz), high-frequency gamma (64–100 Hz), low-frequency gamma (32–64 Hz), beta (16–32 Hz), and sigma spectral amplitudes (12–16 Hz) were significantly greater than zero.
| ECoG Measure | Regression Slope (R2) for Patient 1 | Regression Slope (R2) for Patient 2 | Regression Slope (R2) for Patient 3 | Regression Slope (R2) for Patient 4 | Regression Slope (R2) for Patient 5 | Regression Slope (R2) for Patient 6 | Mean Regression Slope (Mean R2 among Six Children | 95%CI for the Mean Regression Slope |
|---|---|---|---|---|---|---|---|---|
| 'Delta amplitude'; β D | 0.00008 (0.0002) |
0.0013*** (0.14) |
0.00035* (0.046) |
0.00044* (0.046) |
0.00071*** (0.096) |
−0.00087*** (0.14) |
0.00033 (0.078) | −0.0004, 0.0011 |
| 'Theta amplitude'; β T | 0.0013 (0.025) |
0.0018** (0.078) |
0.0015*** (0.17) |
0.0015** (0.061) |
0.00056 (0.030) |
−0.0015*** (0.14) |
0.00088 (0.084) |
−0.0004, 0.0022 |
| 'Alpha amplitude'; β A | 0.0088** (0.13) |
0.0029** (0.048) |
0.0024*** (0.23) |
0.0029* (0.045) |
0.0012*** (0.10) |
−0.0009 (0.030) |
0.0029 (0.097) |
−0.0005, 0.0063 |
| 'Sigma amplitude'; β S | 0.0161*** (0.16) |
0.0087*** (0.10) |
0.0035*** (0.22) |
0.0041 (0.023) |
0.0026*** (0.22) |
0.0013* (0.041) |
0.0060* (0.13) |
0.0002, 0.012 |
| 'Beta amplitude'; β B | 0.0074*** (0.22) |
0.0026* (0.047) |
0.0018*** (0.21) |
0.0025* (0.034) |
0.0009*** (0.11) |
0.0017*** (0.25) |
0.0028* (0.15) |
0.0004, 0.0052 |
| 'Low-frequency gamma amplitude'; β LG | 0.0049** (0.11) |
0.0036** (0.061) |
0.0037*** (0.17) |
0.0037** (0.074) |
0.0011*** (0.086) |
0.0020*** (0.28) |
0.0032** (0.13) |
0.0017, 0.0046 |
| 'High-frequency gamma amplitude'; β HG | 0.0094** (0.12) |
0.012*** (0.23) |
0.0094*** (0.19) |
0.0067*** (0.098) |
0.0036*** (0.14) |
0.0039*** (0.19) |
0.0075** (0.16) |
0.0040, 0.011 |
| 'Very high-frequency gamma amplitude'; β VHG | 0.018*** (0.15) |
0.018*** (0.30) |
0.0055*** (0.18) |
0.0079*** (0.094) |
0.0032*** (0.26) |
0.0047*** (0.15) |
0.0095* (0.19) |
0.0025, 0.017 |
| 'Spike frequency'; β SP | −0.081*** (0.37) |
0.010 (0.017) |
0.006*** (0.15) |
−0.018 (0.014) |
0.006*** (0.29) |
−0.010* (0.059) |
−0.015 (0.15) |
−0.050, 0.021 |
p-value<0.05.
p-value<0.01.
p-value<0.001.
Very high-frequency gamma amplitude measure as a predictor had the mean R-square among six patients to be 0.19 in the univariate regression analysis; this observation suggests that about one-fifth of variance of glucose metabolic pattern can be explained by very high-frequency gamma amplitude alone.
Multiple linear regression model
The mean R-square value across the six subjects was 0.48 (range: 0.23 to 0.65); thus, about half of the variance of PET fractional ranks among electrodes were explained by the multiple linear regression models using the above-mentioned nine ECoG measures in the given electrode site.
The one-sample t-test revealed that none of the mean regression slopes for ECoG measures derived from the multiple regression model was significantly different from zero; in other words, none of the ECoG measures independently predicted PET fractional ranks in the multiple linear regression model. Assessment of correlation matrices (Tables S1–S6 [supplementary data]) revealed that ECoG spectral amplitude at a frequency band was well correlated to ECoG spectral amplitudes at other frequency bands in all children, and indicated that the statistical power in the multiple linear regression analysis was possibly compromised by ‘collinearity among the predictor variables’ (Cohen et al., 2002). In other words, failure to prove an independent correlation between the PET fractional rank and ECoG spectral amplitudes was partially attributed to the predictive effect of an ECoG spectral amplitude on PET measures eliminated by a predictive effect of ECoG spectral amplitude at another frequency band.
DISCUSSION
The present study demonstrates that regional glucose uptake measured by interictal FDG PET was positively correlated to the spectral amplitudes of gamma activities (32–64, 64–100, and 100–200 Hz) and was marginally correlated to those for sigma (12–16 Hz) and beta (16–32 Hz) activities. It was found that the gamma spectral amplitude at 100–200 Hz had the greatest effect size on cortical glucose metabolic patterns. On the other hand, the study failed to prove a quantitative linear association between regional glucose metabolism and the remaining ECoG measures (delta, theta, alpha spectral amplitudes or spike frequency). Association between ‘glucose uptake on PET’ and ‘magnitude of fast-wave activities on ECoG’ is a novel finding in the present study, and the results increase our understanding of the significance of cortical metabolism in relation to electrophysiology in children with nonlesional focal epilepsy.
Significance of gamma oscillations in relation to cortical glucose metabolism
In the present study, gamma spectral amplitude measures probably consisted of physiological and pathological components. Previous human studies of sleep-wake cycle using magnetoencephalography (Llinás and Ribary, 1993) and intracranial ECoG recording (Gross and Gotman, 1999; Cantero et al., 2004) showed increased gamma-oscillations (> 30 Hz) over the neocortex during wakefulness and rapid eye movement sleep compared to slow wave sleep. It is also well known that cortical gamma activities above 30 Hz are tightly linked with various forms of physiological activity, including motor (Crone et al., 1998), visual (Fries et al., 2001; Womelsdorf et al., 2006), auditory (Crone et al., 2001) and language tasks (Sinai et al., 2005; Lachaux et al., 2007). A previous study of cats using functional MRI revealed that hemodynamic activation induced by visual stimulation was tightly correlated to increased gamma-oscillations at 50–90 Hz (Niessing et al., 2005).
It has been generally believed that a spike component of interictal epileptiform discharge represents summation of excitatory post-synaptic potentials in a number of epileptogenic neurons (Fisher and Prince, 1977). Recent studies of adults with focal epilepsy using intracranial ECoG recording showed that interictal high-frequency gamma activities above 100Hz were often associated with spike discharges (Urrestarazu et al., 2007) and localized to the seizure onset zone (Urrestarazu et al., 2007). Another study of an adult of focal epilepsy using functional MRI showed that focal beta-gamma bursts lasting 2 to 6 seconds were associated with focal hemodynamic activation lasting up to 30 seconds (Kobayashi et al., 2006c). We speculate that gamma oscillations, which made up less than 5% of the total amplitude spectrum in the present study, may be the most solid indicator of cortical activation related to physiological changes and epileptogenic processes.
No universal pattern in correlation between glucose metabolism and interictal spike frequency
The present study demonstrated a negative linear correlation between regional glucose uptake and interictal spike frequency in three patients (patients 1, 4, and 6), and visual assessment revealed that interictal spike was often followed by a large delta wave (Figure 1L). This observation was consistent with those in our previous study of 11 children with focal epilepsy associated with tuberous sclerosis complex (Nishida et al., 2007), where interictal spike activity frequently arose from the hypometabolic brain regions associated with cortical tubers. Studies of adults with focal epilepsy using functional MRI suggested interictal epileptiform discharges were associated with hemodynamic deactivation in some patients with focal epilepsy (Federico et al., 2005; Kobayashi et al., 2006b). Association between frequent interictal spike activity and glucose hypometabolism as well as cortical deactivation was attributed to slow-wave components following spike discharges in these studies (Kobayashi et al., 2006b; Nishida et al., 2007).
The observation of a positive linear correlation between regional glucose uptake and interictal spike frequency in three patients (patients 2, 3, and 5) in the present study does not contradict the observations in the previous studies; these three patients had frequent episodes of interictal spike bursts where slow-wave components following spike discharges were less prominent (Figure 2L). The results of our PET-ECoG studies and previous functional MRI-EEG studies generally support our central hypothesis that fast-wave components of epileptiform discharges may be associated with metabolic and hemodynamic activation, whereas slow-wave components may be associated with deactivation in patients with focal epilepsy.
Failure to demonstrate a negative correlation between glucose metabolism and delta slowing in the present study
A negative linear correlation between regional glucose uptake and delta spectral amplitude was demonstrated by our previous study of 11 children with tuberous sclerosis complex (Nishida et al., 2007) but not by the present study. The discrepancy may be partly attributed to the fractional ranking of glucose uptake values applied in these two studies. Fractional ranking was greatly influenced by cortical hypometabolism associated with multiple cortical tubers in the previous study (Nishida et al., 2007). In the present study of nonlesional focal epilepsy, conversely, ranking was rather influenced by physiological metabolic gradient and cortical hypermetabolism in some cases.
An alternative way of PET measurement would be to draw a region of interest in each cortical area on a 2D-axial image (not visualizing the PET scale on the 3D-image) followed by computation of glucose metabolism value for each region of interest (Asano et al., 2000). We decided not to apply this method, since it would be very time-consuming to draw 651 regions of interest, and it would be very difficult to accurately identify the electrode locations on 2D-axial images. Furthermore, absolute glucose uptake values would not be comparable across individuals. We believe that a simple and reliable alternative is ‘ranking’ glucose metabolism from “highest” to “lowest” and ‘ranking’ can provide a reasonable summary of PET measures which can be compared across individuals.
Methodological considerations
The combined analysis of PET and high-sampling ECoG measures on an individual electrode basis was a novel approach used in the present study. Yet, there were several methodological limitations. First, PET and ECoG were not simultaneously obtained, as performed in our previous PET-ECoG study (Nishida et al., 2007) and another functional MRI-ECoG study (Lachaux et al., 2007). It has been well known that the development of posterior background rhythm such as alpha-oscillations is tightly correlated with brain maturation (Niedermeyer, 1999). A previous study of 114 healthy children (age: ranging from 9 to 16 year old) using scalp EEG recording showed that the magnitude of auditory-induced gamma-oscillations at 31–63 Hz at specific locations was age-dependent (Yordanova et al., 2002). Thus, we cannot rule out the possibility that difference in conditions during PET and ECoG may have affected the degree of model fit (represented by an R-square value) in the regression equation.
In the present study, we attempted to match the conditions between the two series, as previously performed (Nishida et al., 2007). In short, patients who underwent PET more than 12 months before ECoG recording were excluded from the present study; none of the PET or ECoG data analyzed were derived from the postical state, and interictal ECoG segments were selected according to the state (awake or sleep) during the first 20–minutes of the FDG PET uptake period. Our previous study demonstrated no statistically significant association between the interval between PET and ECoG studies and the degree of model fit in the regression equation in a given subject (Nishida et al., 2007). In addition, we have recently demonstrated that the pattern (extent) of cortical hypometabolism in children with intractable epilepsy showed considerable longitudinal changes over a >7 months interval only in patients with major change in seizure frequency during the follow-up period (Benedek et al., 2006). However, in the present study, the interval between PET and surgery was up to 7 months and none of the patients had a major change in seizure frequency during this period.
The regression analyses used in the present study was not designed to determine the causal relationship but association between regional interictal neuronal activity and cortical glucose metabolism in children with nonlesional focal epilepsy. Thus, the present study did not determine whether interictal neuronal activity ‘drives’ or ‘is driven by’ the metabolism of cortical tissue exerting this activity.
Factors which may affect PET and ECoG findings include antiepileptic medications and intracranial electrode placement. These issues were discussed in our previous study in detail (Nishida et al., 2007). In short, use of regression approach with glucose metabolism as an outcome variable rescaled into six fractional units eliminated such global effects of antiepileptic medications and intracranial electrode placement on PET imaging.
Sampling of ECoG data was limited to the presumed epileptogenic hemisphere in the present study; assessment of ECoG from the presumed healthy hemisphere was not tenable. Previous studies of adults with focal epilepsy using functional MRI showed that hemodynamic alteration associated with focal spikes were not necessarily confined to the epileptogenic zone but also involved the distant non-epileptic regions including the contralateral homologous brain region (Federico et al., 2005; Kobayashi et al., 2006b). A future study using high-density scalp EEG and magnetoencephalography may determine the association between spectral amplitudes of neural oscillations and the glucose uptake pattern on PET in both left and right hemispheres. Furthermore, such non-invasive electrophysiology modalities are applicable to healthy subjects; a study of healthy subjects may determine how well electrophysiology measures can explain cortical glucose metabolic patterns in healthy brain, although very high-frequency gamma oscillations of cortical origin would be virtually invisible on scalp recording and neural signals could be contaminated by various forms of artifacts (Urrestarazu et al., 2007).
Supplementary Material
Ranking cortical glucose metabolism on each subdural electrode site.
Glucose metabolism values were rescaled into six fractional ranks and delineated with different colors as follows: 0.0 (blue; lowest), 0.2 (green), 0.4 (light blue), 0.6 (pink), 0.8 (orange), and 1.0 (yellow; highest), using the software package ‘3D Tool’. Each subdural electrode site was assigned a PET fractional rank, according to the rescaled PET metabolism at the given site.
Pearson's Correlation Matrix for Patient 1.
Pearson's Correlation Matrix for Patient 2.
Pearson's Correlation Matrix for Patient 3.
Pearson's Correlation Matrix for Patient 4.
Pearson's Correlation Matrix for Patient 5.
Pearson's Correlation Matrix for Patient 6.
Acknowledgement
This work was supported in part by NIH grant NS47550 (to E. A.). We are grateful to Carol Pawlak, R. EEG/EP. T. and Ruth Roeder, R.N., M.S., and the staff of the Division of Electroneurodiagnostics at Children’s Hospital of Michigan, Wayne State University for the collaboration and assistance in performing the studies described above. We also appreciate Brenda Gillespie, PhD in the School of Public Health at University of Michigan for her advice on the statistical analysis.
Footnotes
Publisher's Disclaimer: This is a PDF file of an unedited manuscript that has been accepted for publication. As a service to our customers we are providing this early version of the manuscript. The manuscript will undergo copyediting, typesetting, and review of the resulting proof before it is published in its final citable form. Please note that during the production process errors may be discovered which could affect the content, and all legal disclaimers that apply to the journal pertain.
REFERENCES
- Asano E, Chugani DC, Muzik O, Shen C, Juhász C, Janisse J, Ager J, Canady A, Shah JR, Shah AK, Watson C, Chugani HT. Multimodality imaging for improved detection of epileptogenic foci in tuberous sclerosis complex. Neurology. 2000;54:1976–1984. doi: 10.1212/wnl.54.10.1976. [DOI] [PubMed] [Google Scholar]
- Asano E, Muzik O, Shah A, Juhász C, Chugani DC, Sood S, Janisse J, Ergun EL, Ahn-Ewing J, Shen C, Gotman J, Chugani HT. Quantitative interictal subdural EEG analysis in children with neocortical epilepsy. Epilepsia. 2003;44:425–434. doi: 10.1046/j.1528-1157.2003.38902.x. [DOI] [PubMed] [Google Scholar]
- Asano E, Muzik O, Shah A, Juhász C, Chugani DC, Kagawa K, Benedek K, Sood S, Gotman J, Chugani HT. Quantitative visualization of ictal subdural EEG changes in children with neocortical focal seizures. Clin. Neurophysiol. 2004;115:2718–2727. doi: 10.1016/j.clinph.2004.06.020. [DOI] [PMC free article] [PubMed] [Google Scholar]
- Asano E, Juhász C, Shah A, Muzik O, Chugani DC, Shah J, Sood S, Chugani HT. Origin and propagation of epileptic spasms delineated on electrocorticography. Epilepsia. 2005;46:1086–1097. doi: 10.1111/j.1528-1167.2005.05205.x. [DOI] [PMC free article] [PubMed] [Google Scholar]
- Asano E, Mihaylova T, Juhász C, Sood S, Chugani HT. Effect of sleep on interictal spikes and distribution of sleep spindles on electrocorticography in children with focal epilepsy. Clin. Neurophysiol. 2007;118:1360–1368. doi: 10.1016/j.clinph.2007.02.021. [DOI] [PMC free article] [PubMed] [Google Scholar]
- Benedek K, Juhász C, Chugani DC, Muzik O, Chugani HT. Longitudinal changes in cortical glucose hypometabolism in children with intractable epilepsy. J. Child Neurol. 2006;21:26–31. doi: 10.1177/08830738060210011101. [DOI] [PubMed] [Google Scholar]
- Buchsbaum MS, Hazlett EA, Wu J, Bunney WE. Positron emission tomography with deoxyglucose-F18 imaging of sleep. Neuropsychopharmacology. 2001;25 Suppl.5:50–56. doi: 10.1016/S0893-133X(01)00339-6. [DOI] [PubMed] [Google Scholar]
- Cantero JL, Atienza M, Madsen JR, Stickgold R. Gamma EEG dynamics in neocortex and hippocampus during human wakefulness and sleep. Neuroimage. 2004;22:1271–1280. doi: 10.1016/j.neuroimage.2004.03.014. [DOI] [PubMed] [Google Scholar]
- Chugani HT, Shields WD, Shewmon DA, Olson DM, Phelps ME, Peacock WJ. Infantile spasms: I. PET identifies focal cortical dysgenesis in cryptogenic cases for surgical treatment. Ann. Neurol. 1990;27:406–413. doi: 10.1002/ana.410270408. [DOI] [PubMed] [Google Scholar]
- Chugani HT, Shewmon DA, Khanna S, Phelps ME. Interictal and postictal focal hypermetabolism on positron emission tomography. Pediatr. Neurol. 1993;9:10–15. doi: 10.1016/0887-8994(93)90003-u. [DOI] [PubMed] [Google Scholar]
- Cohen J, Cohen P, West SG, Aiken LS. 3rd. Mahwah, NJ: Lawrence Erlbaum Associates; 2002. Applied Multiple Regression - Correlation Analysis for the Behavioral Sciences. [Google Scholar]
- Crone NE, Miglioretti DL, Gordon B, Lesser RP. Functional mapping of human sensorimotor cortex with electrocorticographic spectral analysis. II. Event-related synchronization in the gamma band. Brain. 1998;121:2301–2315. doi: 10.1093/brain/121.12.2301. [DOI] [PubMed] [Google Scholar]
- Crone NE, Boatman D, Gordon B, Hao L. Induced electrocorticographic gamma activity during auditory perception. Brazier Award-winning article. Clin. Neurophysiol. 2001;112:565–582. doi: 10.1016/s1388-2457(00)00545-9. [DOI] [PubMed] [Google Scholar]
- De, Tiège X, Goldman S, Laureys S, Verheulpen D, Chiron C, Wetzburger C, Paquier P, Chaigne D, Poznanski N, Jambaqué I, Hirsch E, Dulac O, Van, Bogaert P. Regional cerebral glucose metabolism in epilepsies with continuous spikes and waves during sleep. Neurology. 2004;63:853–857. doi: 10.1212/01.wnl.0000137015.04054.2c. [DOI] [PubMed] [Google Scholar]
- Engel J, Kuhl DE, Phelps ME, Mazziotta JC. Interictal cerebral glucose metabolism in partial epilepsy and its relation to EEG changes. Ann. Neurol. 1982;12:510–517. doi: 10.1002/ana.410120603. [DOI] [PubMed] [Google Scholar]
- Federico P, Archer JS, Abbott DF, Jackson GD. Cortical/subcortical BOLD changes associated with epileptic discharges: an EEG-fMRI study at 3 T. Neurology. 2005;64:1125–1130. doi: 10.1212/01.WNL.0000156358.72670.AD. [DOI] [PubMed] [Google Scholar]
- Fisher RS, Prince DA. Spike-wave rhythms in cat cortex induced by parenteral penicillin. II. Cellular features. Electroencephalogr Clin Neurophysiol. 1977;42:625–639. doi: 10.1016/0013-4694(77)90280-2. [DOI] [PubMed] [Google Scholar]
- Fries P, Reynolds JH, Rorie AE, Desimone R. Modulation of oscillatory neuronal synchronization by selective visual attention. Science. 2001;291:1560–1563. doi: 10.1126/science.1055465. [DOI] [PubMed] [Google Scholar]
- Gotman J, Kobayashi E, Bagshaw AP, Bénar CG, Dubeau F. Combining EEG and fMRI: a multimodal tool for epilepsy research. J. Magn. Reson. Imaging. 2006;23:906–920. doi: 10.1002/jmri.20577. [DOI] [PubMed] [Google Scholar]
- Gross DW, Gotman J. Correlation of high-frequency oscillations with the sleep-wake cycle and cognitive activity in humans. Neuroscience. 1999;94:1005–1018. doi: 10.1016/s0306-4522(99)00343-7. [DOI] [PubMed] [Google Scholar]
- Jacobs J, Kobayashi E, Boor R, Muhle H, Stephan W, Hawco C, Dubeau F, Jansen O, Stephani U, Gotman J, Siniatchkin M. Hemodynamic Responses to Interictal Epileptiform Discharges in Children with Symptomatic Epilepsy. Epilepsia. 2007;48:2068–2078. doi: 10.1111/j.1528-1167.2007.01192.x. [DOI] [PubMed] [Google Scholar]
- Juhász C, Chugani DC, Muzik O, Watson C, Shah J, Shah A, Chugani HT. Is epileptogenic cortex truly hypometabolic on ictal positron emission tomography? Ann. Neurol. 2000;48:88–96. [PubMed] [Google Scholar]
- Klem GH. Artifacts. In: Ebersole JS, Pedley TA, editors. Current practice of clinical electroencephalography. New York: Lippincott Williams and Wilkins; 2003. pp. 271–287. [Google Scholar]
- Kobayashi E, Bagshaw AP, Grova C, Gotman J, Dubeau F. Grey matter heterotopia: what EEG-fMRI can tell us about epileptogenicity of neuronal migration disorders. Brain. 2006a;129:366–374. doi: 10.1093/brain/awh710. [DOI] [PubMed] [Google Scholar]
- Kobayashi E, Bagshaw AP, Grova C, Dubeau F, Gotman J. Negative BOLD responses to epileptic spikes. Hum. Brain. Mapp. 2006b;27:488–497. doi: 10.1002/hbm.20193. [DOI] [PMC free article] [PubMed] [Google Scholar]
- Kobayashi E, Hawco CS, Grova C, Dubeau F, Gotman J. Widespread and intense BOLD changes during brief focal electrographic seizures. Neurology. 2006c;66:1049–1055. doi: 10.1212/01.wnl.0000204232.37720.a4. [DOI] [PubMed] [Google Scholar]
- Koepp MJ, Woermann FG. Imaging structure and function in refractory focal epilepsy. Lancet Neurol. 2005;4:42–53. doi: 10.1016/S1474-4422(04)00965-2. [DOI] [PubMed] [Google Scholar]
- Koutroumanidis M, Binnie CD, Elwes RD, Polkey CE, Seed P, Alarcon G, Cox T, Barrington S, Marsden P, Maisey MN, Panayiotopoulos CP. Interictal regional slow activity in temporal lobe epilepsy correlates with lateral temporal hypometabolism as imaged with 18FDG PET: neurophysiological and metabolic implications. J. Neurol. Neurosurg. Psychiatry. 1998;65:170–176. doi: 10.1136/jnnp.65.2.170. [DOI] [PMC free article] [PubMed] [Google Scholar]
- Lachaux JP, Fonlupt P, Kahane P, Minotti L, Hoffmann D, Bertrand O, Baciu M. Relationship between task-related gamma oscillations and BOLD signal: New insights from combined fMRI and intracranial EEG. Hum. Brain. Mapp. 2007;28:1368–1375. doi: 10.1002/hbm.20352. [DOI] [PMC free article] [PubMed] [Google Scholar]
- Lee SA, Spencer DD, Spencer SS. Intracranial EEG seizure-onset patterns in neocortical epilepsy. Epilepsia. 2000;41:297–307. doi: 10.1111/j.1528-1157.2000.tb00159.x. [DOI] [PubMed] [Google Scholar]
- Lee SK, Lee SY, Kim KK, Hong KS, Lee DS, Chung CK. Surgical outcome and prognostic factors of cryptogenic neocortical epilepsy. Ann. Neurol. 2005;58:525–532. doi: 10.1002/ana.20569. [DOI] [PubMed] [Google Scholar]
- Llinás R, Ribary U. Coherent 40-Hz oscillation characterizes dream state in humans. Proc. Natl. Acad. Sci. U.S.A. 1993;90:2078–2081. doi: 10.1073/pnas.90.5.2078. [DOI] [PMC free article] [PubMed] [Google Scholar]
- Maquet P, Hirsch E, Metz-Lutz MN, Motte J, Dive D, Marescaux C, Franck G. Regional cerebral glucose metabolism in children with deterioration of one or more cognitive functions and continuous spike-and-wave discharges during sleep. Brain. 1995;118:1497–1520. doi: 10.1093/brain/118.6.1497. [DOI] [PubMed] [Google Scholar]
- Muzik O, Chugani DC, Zou G, Hua J, Lu Y, Lu S, Asano E, Chugani HT. Multimodality data integration in epilepsy. Int. J. Biomed. Imaging. 2007 doi: 10.1155/2007/13963. (in press) [DOI] [PMC free article] [PubMed] [Google Scholar]
- Niedermeyer E. The normal EEG of the waking adult: Electroencephalography Basic Principles. In: Niedermeyer, editor; Lopes, editor; da Silva F, editor. Clinical Applications and Related Fields. Baltimore: Williams & Wilkins; 1999. pp. 149–173. [Google Scholar]
- Niessing J, Ebisch B, Schmidt KE, Niessing M, Singer W, Galuske RA. Hemodynamic signals correlate tightly with synchronized gamma oscillations. Science. 2005;309:948–951. doi: 10.1126/science.1110948. [DOI] [PubMed] [Google Scholar]
- Nishida M, Asano E, Juhász C, Muzik O, Sood S, Chugani HT. Cortical glucose metabolism correlates negatively with delta slowing wave and spike frequency in epilepsy associated with tuberous sclerosis. Hum. Brain. Mapp. 2007 doi: 10.1002/hbm.20461. (in press) [DOI] [PMC free article] [PubMed] [Google Scholar]
- Pietrzyk U, Herholz K, Fink G, Jacobs A, Mielke R, Slansky I, Würker M, Heiss WD. An interactive technique for three-dimensional image registration:validation for PET, SPECT, MRI and CT brain studies. J. Nucl. Med. 1994;35:2011–2018. [PubMed] [Google Scholar]
- Sinai A, Bowers CW, Crainiceanu CM, Boatman D, Gordon B, Lesser RP, Lenz FA, Crone NE. Electrocorticographic high gamma activity versus electrical cortical stimulation mapping of naming. Brain. 2005;128:1556–1570. doi: 10.1093/brain/awh491. [DOI] [PubMed] [Google Scholar]
- Urrestarazu E, Chander R, Dubeau F, Gotman J. Interictal high-frequency oscillations (100–500 Hz) in the intracerebral EEG of epileptic patients. Brain. 2007;130:2354–2366. doi: 10.1093/brain/awm149. [DOI] [PubMed] [Google Scholar]
- von Stockhausen HM, Thiel A, Herholz K, Pietrzyk U. A convenient method for topographical localization of intracranial electrodes with MRI and a conventional radiograph. Neuroimage. 1997;5 Abstract 514. [Google Scholar]
- Womelsdorf T, Fries P, Mitra PP, Desimone R. Gamma-band synchronization in visual cortex predicts speed of change detection. Nature. 2006;439:733–736. doi: 10.1038/nature04258. [DOI] [PubMed] [Google Scholar]
- Yordanova J, Kolev V, Heinrich H, Woerner W, Banaschewski T, Rothenberger A. Developmental event-related gamma oscillations: effects of auditory attention. Eur. J. Neurosci. 2002;16:2214–2224. doi: 10.1046/j.1460-9568.2002.02286.x. [DOI] [PubMed] [Google Scholar]
Associated Data
This section collects any data citations, data availability statements, or supplementary materials included in this article.
Supplementary Materials
Ranking cortical glucose metabolism on each subdural electrode site.
Glucose metabolism values were rescaled into six fractional ranks and delineated with different colors as follows: 0.0 (blue; lowest), 0.2 (green), 0.4 (light blue), 0.6 (pink), 0.8 (orange), and 1.0 (yellow; highest), using the software package ‘3D Tool’. Each subdural electrode site was assigned a PET fractional rank, according to the rescaled PET metabolism at the given site.
Pearson's Correlation Matrix for Patient 1.
Pearson's Correlation Matrix for Patient 2.
Pearson's Correlation Matrix for Patient 3.
Pearson's Correlation Matrix for Patient 4.
Pearson's Correlation Matrix for Patient 5.
Pearson's Correlation Matrix for Patient 6.