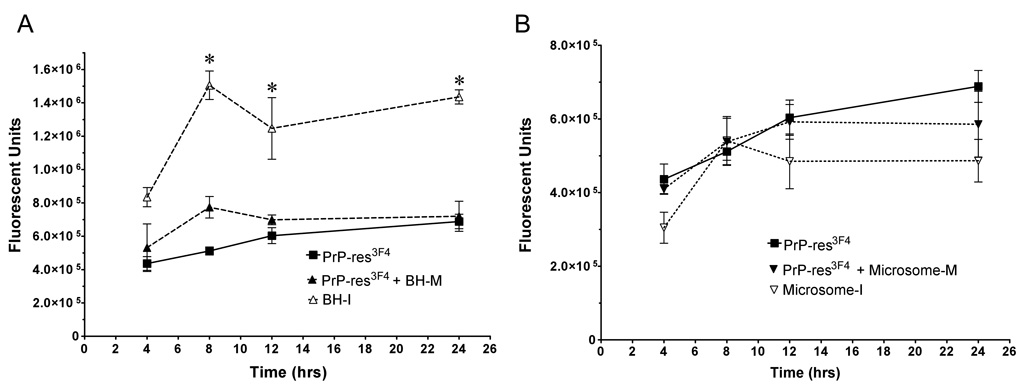
Figure 8. Infectious brain homogenate PrP-res3F4 is taken up more efficiently then either microsome or partially purified PrP-res3F4.
Graphical representation of PrP-res3F4 uptake from 0 – 24 hrs into MoL42-CFD5 cells (N = 6) where error bars represent SEM. A) Kinetics of PrP-res3F4 uptake using either infectious brain homogenate PrP-res3F4 (BH-I), partially purified PrP-res3F4 (PrP-res3F4) or partially purified PrP-res3F4 with mock infected brain homogenate (PrP-res3F4 + BH-M) added to match the total protein content of BH-I (* p<0.05, t = 8–24 hrs, Bonferroni test). B) Kinetics of PrP-res3F4 uptake using either infectious microsome PrP-res3F4 (Microsome-I), purified PrP-res3F4 (PrP-res3F4) or partially purified PrP-res3F4 with mock infected microsomes (PrP-res3F4 + Microsome-M) added to match total protein content of infectious microsomes (p>0.05 for all time points, Bonferroni test). All data was obtained with IR-dye 800CW developed western blots where the PrP-res3F4 level was quantified as fluorescent units using the Li-Cor Odyssey imaging system and associated software.

