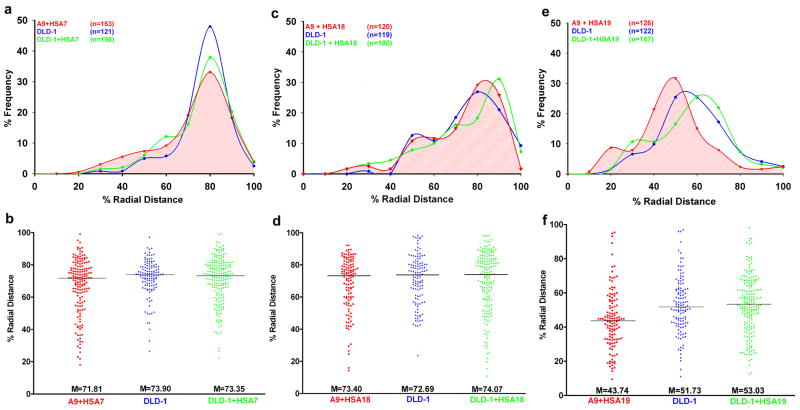
Fig. 2. Human chromosomes assume a conserved radial position in both mouse and human nuclei that correlates with their gene densities.
(a, c and e) 3D radial distance profiles of chromosome territories HSA7 (a), HSA18 (c) and HSA19 (e). X-axis: % Radial Distance, 0% - nuclear center, 100% - nuclear periphery and Y-axis: % Frequency of chromosome territories.
(b, d and f) Raw distributions of 3D radial distance measurements. X-axis: Cell line, Y-axis: % Radial Distance.

