Abstract
Although the longitudinal chromatic aberration (LCA) of the adult eye has been studied, there are no data collected from the human infant eye. A chromatic retinoscope was used to measure cyclopleged infant and adult refractions with four pseudomonochromatic sources (centered at 472, 538, 589, and 652 nm) and with polychromatic light. The LCA of the infant eyes between 472 and 652 nm was a factor of 1.7 greater than the LCA found in the adult group: infant mean=1.62 D, SD±0.14 D; adult mean=0.96 D, SD±0.17 D. The elevated level of LCA in infant eyes is consistent with the greater optical power of the immature eye and indicates similar chromatic dispersion in infant and adult eyes. The implications for visual performance, defocus detection, and measurement of refraction are discussed.
1. INTRODUCTION
Ocular chromatic aberration results from the dispersive properties of the eye's media [1]. Longitudinal chromatic aberration (LCA) is defined as the difference in the optical power of the eye across wavelength (Fig. 1, panel A.).
Fig. 1.
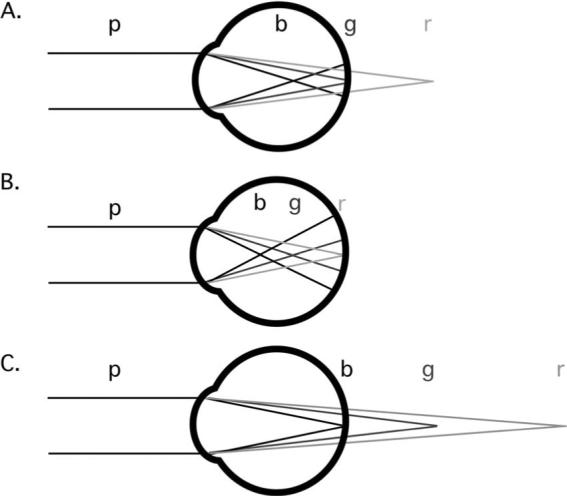
Schematic illustration of longitudinal chromatic aberration (LCA) and the effects of myopic and hyperopic defocus. Polychromatic light (p) reaches the eye and is dispersed into its component wavelengths. The power of the eye is greater for short (b) than the middle (g) and long (r) wavelengths. A. The middle (g) wavelengths are focused at the retina. B. An overpowered, myopic eye with the long (r) wavelengths in best focus. C. an underpowered, hyperopic eye with short (b) wavelengths in best focus.
An understanding of LCA is of interest in the context of the developing visual system for at least three reasons:
First, the effect of LCA on visual performance. Only a narrow range of wavelengths can be focused at the photoreceptors at any one time. A polychromatic image formed at this first stage of neural visual processing will therefore consist of a combination of focused and defocused images. The defocused wavelengths will reduce the luminance contrast of the polychromatic image. The contribution of this reduction to infants’ limited spatial visual performance is currently unknown, both for resolution and contrast sensitivity [2–6]. An estimate of the LCA of the infant eye would permit a calculation of its impact on vision [7–9].
Second, the potential role of LCA in indicating the sign of defocus. A defocused monochromatic image contains no information regarding the sign, or direction, of its defocus—the blur circle on the retina could result from a positive or negative focus error. Additional information is required to determine whether the defocus is the result of overpowered or underpowered optics. The systematic spread of planes of focus as a function of wavelength resulting from LCA provides a possible solution to this problem. If short wavelengths are the better focused, the eye is effectively underpowered, and if long wavelengths are the better focused, the eye is effectively overpowered (as illustrated in Fig. 1, panels B. and C.). Information derived from LCA could be used to drive adjustments in the optical power of the young eye either in the short term, using ocular accommodation [10–12], or over the long term, through the process of emmetropization [13–15].
Third, the effect of LCA on the measurement of refractive error. Infants and young children are not capable of providing reliable subjective information during measurements of their refractive error. Clinicians are therefore obliged to determine a spectacle prescription using objective techniques. The instruments currently used for this purpose (retinoscopes, autorefractors and photorefractors, for example) incorporate light sources of different wavelengths. An understanding of the chromatic aberration of the infant eye is required in order to predict the effect of the wavelength of a light source on the estimated refraction.
LCA has been widely studied in human adults. Previous studies using both objective and subjective techniques have typically found that the LCA between short (e.g., 400 nm) and long (e.g., 700 nm) wavelengths of light is approximately two diopters (as reviewed by Thibos et al. [16]). A number of these studies are summarized in Fig. 2 [17–29]. Consistent with the illustration in Fig. 1, the short wavelengths are focused relatively myopically and the long wavelengths, relatively hyperopically. The amount of LCA also does not change dramatically with age between 27 and 72 years of age [30,31].
Fig. 2.
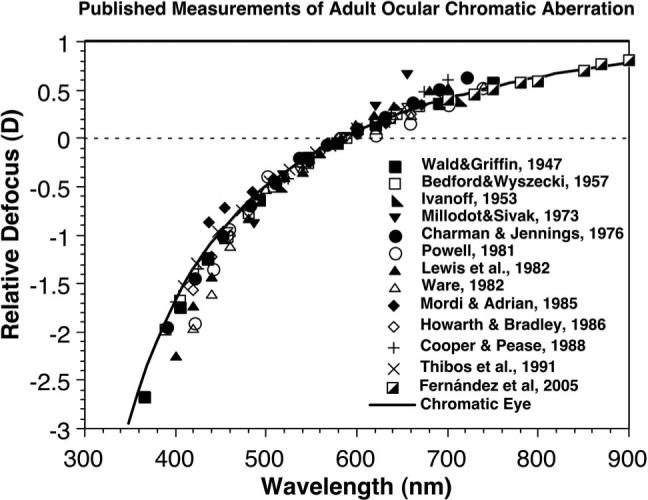
Published measurements of adult ocular chromatic aberration, compared with the chromatic-eye model of Thibos et al. [16] (based on their Fig. 6). The data were normalized to the defocus measured at 589 nm.
Newborn infants have shorter eyes with a higher optical power than the eyes of adults [32]. In a simplified (single surface) eye model, the power of an eye is equal to the refractive index of the eye divided by its focal length [33]. The LCA of the eye can therefore be predicted as
| (1) |
where FR and FB are the powers of the eye for two wavelengths (R and B), nR and nB are the eye's refractive indices for the two wavelengths, and r is the radius of curvature of the refracting surface. If the refractive indices of an infant's eye are assumed to be adultlike (also see calculations performed by Wood et al. [34]), and the radius of curvature of the simplified single refracting surface is assumed to be proportional to the eye's axial length, the ratio of LCA between infants and adults can be predicted using the ratio of the axial lengths of infant and adult eyes. The infant axial length is approximately two-thirds of the adult value [32]; therefore the LCA of the infant eye is predicted to be 1.5 times the LCA of the adult eye. The goals of the current study were to test this prediction by making the first quantitative measures of LCA in infants, and to infer the potential impact that the measured LCA may have on the developing visual system.
2. METHODS
A. Subjects
Data were collected from 21 infants aged from 12 to 17 weeks. All of the infants were born at full term (by parental report), and had no evidence of ocular or systemic abnormalities. These infants were recruited from the local community after the study had been approved by the Indiana University Institutional Review Board. A group of 11 pre-presbyopic adults with spherical equivalent refractive error of ≤±5 D and asigmatism ≤±0.75 D were recruited for comparison. Informed consent was obtained from the parents for their infants and from the adult subjects.
B. Procedure
The right eye of each subject was cyclopleged with one drop of 0.5% cyclopentolate to prevent any change in accommodation while the focus of the eye was measured across a number of conditions.
The infant subjects were not capable of completing a subjective measurement; therefore their LCA was measured objectively using a chromatic retinoscope based on that described by Bobier and Sivak [35,36]. A schematic diagram of the apparatus is shown in Fig. 3. It consisted of a variable-intensity light source (Chiu Technical Corp., Model F0−150) modified to include an attachment enabling narrowband interference filters (Edmund Optics) to be placed in the light path. The light was then passed through a fiber/optic cable into a conventional streak retinoscope head (Keeler), so that a clinically trained and experienced retinoscopist could perform retinoscopy through conventional trial lenses. A toy consisting of flashing LEDs was also designed and mounted on the retinoscope to attract each infant's attention and ensure that retinoscopy was undertaken close to the visual axis. The procedure was performed in a dim room.
Fig. 3.
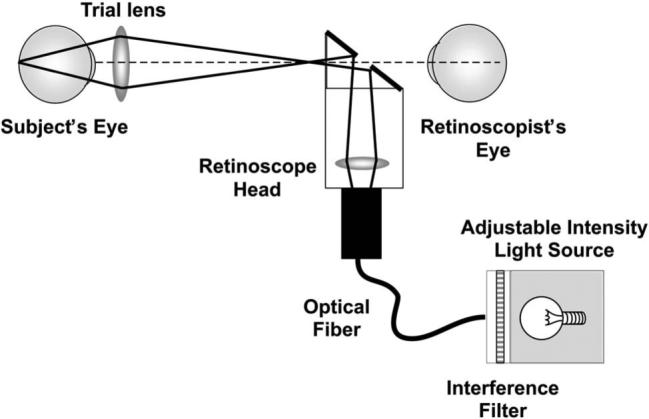
Schematic illustration of the chromatic retinoscope used to collect data from adults and infants, demonstrating the illumination path. The LCA of the lens in the retinoscope head changes the position of the secondary light source with wavelength. This change in position changes only the speed of the reflex motion rather than its direction and therefore does not influence the measurement of the eye's LCA. The LCA of the trial lenses used to assess the reflex was less than 0.1 D between 472 and 652 nm, for the lenses between +6 D and −5 D used to make the measurements. The radiant exposure levels for all wavelengths used in this experiment arriving at the cornea were also measured and confirmed to be at least 50 times lower than the appropriate ANSI safety standard when the light source was turned to its highest setting [37]. The LCA measurements were collected from subjects with the light source at the lowest setting that provided reliable data, and so the highest setting was never used during data collection.
Retinoscopy was performed on each subject using a conventional “white” retinoscope and then using the modified chromatic retinoscope and each of four interference filters nominally centered at 472, 538, 589, and 652 nm (they were specified to have a 10±2 nm FWHM bandwidth). The filters were used in a pseudorandom order. The 472 and 652 nm versions were used first, to collect the data at the most extreme wavelengths, and then the 538 and 589 nm measurements were made. The retinoscopist worked from a distance of 1 m with a horizontal retinoscope streak, making measurements along the vertical meridian. Another experienced retinoscopist selected the trial lenses to approximate a psychophysical staircase procedure. Thus the person using the retinoscope knew the wavelength of light, but was masked to the lens power they were assessing. They responded using a “with,” “against,” or “neutral” judgment of the reflex motion for each lens. It typically took two to four minutes to complete data collection for each wavelength. At the end of the data collection step, the retinoscopist gave an overall percentage confidence in his/her judgments before he/she saw any of the data. The data were discarded if the percentage confidence was lower than 75%.
Although it was necessary to use an objective technique to collect the data from infants, it is possible that this technique was subject to an artifact. The retinoscopist's task is to judge the motion of the reflected image of a patch of light on the retina. The direction and speed of this image motion is proportional to the dioptric distance between the average plane of reflection (in the eye) and the back focal point of the eye (see Fig. 4). Any objective technique involving this type of reflection will reveal the full effect of chromatic aberration only if each wavelength is reflected from the same plane in the retina. There is evidence to suggest that light of different wavelengths is reflected from different retinal planes (with short wavelengths reflected from an average plane lying anterior to that from which the long wavelengths are reflected [30,38]). In that case the sum of the relative errors measured with the shortest and longest wavelengths would result in an underestimation of the total LCA by an amount equivalent to the dioptric distance between the reflective planes, as shown in Fig. 4. The full effect of chromatic aberration is revealed without artifact in subjective techniques because the subjective visual percept is initiated at the plane of the photon absorption for all wavelengths.
Fig. 4.
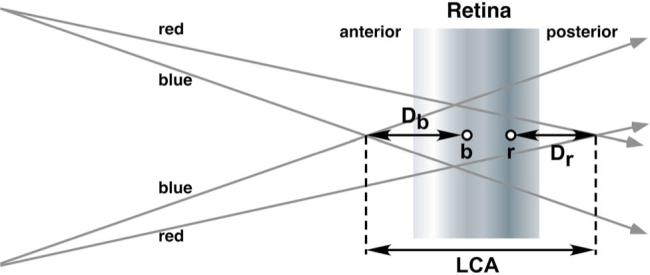
(Color online) Schematic illustration of a potential artifact in the chromatic retinoscopy technique. Although the full LCA is defined by the distance between the short (blue) and long (red) wavelength planes of focus, if the short and long wavelengths are reflected from different planes during retinoscopy (represented by the points b and r, respectively), the sum of the dioptric distances Db and Dr will not equal the LCA value (e.g. [30]).
Morrell et al. [30] collected subjective and objective data from a group of young adults to determine whether there was a difference in the estimates of LCA made with chromatic retinoscopy and a subjective Badal optometer. They found a relatively small difference of less than 0.1 D between the two techniques over a range of wavelengths between 464 and 664 nm. The same two sets of data were collected from the adult subjects in the current study to determine the difference between subjective and retinoscopy measures for the current set of apparatus.
After the retinoscopy data had been collected from the adults, each subject was aligned with a Badal optometer using a bite-bar [39]. This system consisted of a 10 D achromatic doublet Badal lens (Edmund Optics) and a 35 mm slide of a conventional eye chart that acted as the visual target. The target was illuminated with incoherent light using the same light source and filters that were used in the retinoscope (at approximately 30 cd/m2 in each case). The anterior focal point of the subject's cyclopleged eye was placed approximately at the back focal point of the Badal lens, while the other eye was patched. The target was placed at a random position and the subject was asked to use a method of adjustment to position the target in the best subjective focus. This was repeated five times for each of the interference filters and then the broadband (white) light source. The advantage of the Badal system is that the target image vergence is linearly proportional to the distance of the target from the front focal point of the lens, and the angular size of the image is independent of the target position. The eye's refractive error was then calculated using the mean target position and Newton's equation [33]. This subjective procedure took an additional 20−30 min to complete.
C. Data Analysis
The threshold for a psychophysical staircase procedure such as that used in collecting the retinoscopy data is typically calculated by averaging reversals or by creating a psychometric function (e.g., [40]). As the data collection from the infants was limited by their short attention span the retinoscopy was performed in a more typical clinical fashion with an abbreviated staircase in which two or three reversals were recorded and then the midpoint of the smallest reversal interval was used as the final defocus value. The same approach was used for the adult subjects to maintain constant conditions. Each individual's set of defocus values as a function of wavelength was then fitted with the Indiana Eye Model (This contains a pupil and a single, aspheric refracting surface separating air from a chromatically dispersive ocular medium.) [16]. These analyses were conducted using Matlab and Microsoft Excel.
3. RESULTS
Data from 11 infants and 11 adults were included in the analysis. The data from the other 10 infants were excluded because the retinoscopist noted low confidence, or it was not possible to collect data with all four interference filters.
The data from the conventional clinical retinoscope indicated that the infants were all hyperopic in their vertical meridian. The spectral distribution of light from this retinoscope is shown in Fig. 5 for comparison with the unfiltered distribution from the chromatic retinoscope. Their mean refractive error was +1.88 D (SD±1.09 D), which is consistent with the literature for infants of this age [41,42]. The adult group consisted of 10 myopes and emmetropes, with one hyperope. Their mean refractive error in the vertical meridian was −1.66 D (SD±1.89 D).
Fig. 5.
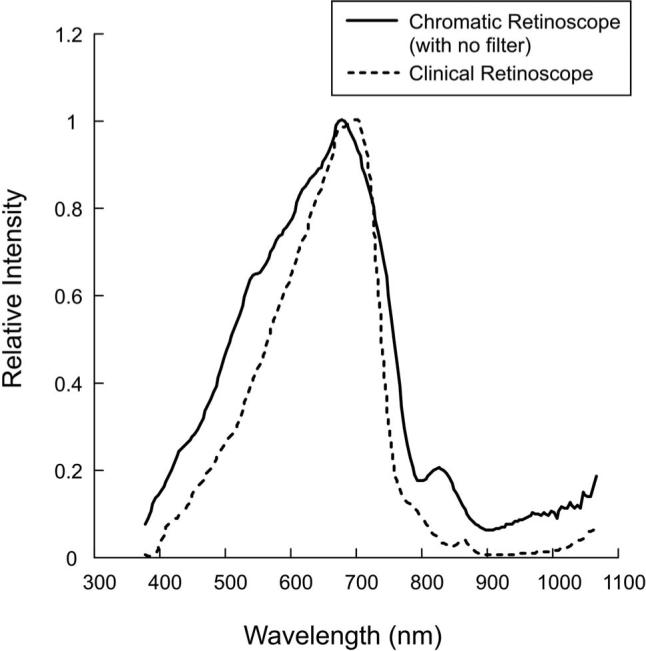
Relative spectral distributions of the broadband (white) light source used in the chromatic retinoscope and the clinical retinoscope, as measured with a spectroradiometer (Photo Research Inc). The data have been normalized to their peak value, which was seven times higher for the chromatic than for the clinical retinoscope. Neither of these sources was used at its maximum setting during the LCA data collection from subjects.
Relative refractive error measured with the chromatic retinoscope is plotted as a function of wavelength for each individual in Fig. 6. The mean function for each age group is also shown. The individual sets of data have been separated vertically for clarity. The data are consistent with the previous literature in that the refractive error for the shorter wavelengths was myopic relative to that for the longer wavelengths. The previous literature predicts a difference of approximately 1 D between refractions at 472 and 652 nm in adults (see Fig. 2).
Fig. 6.
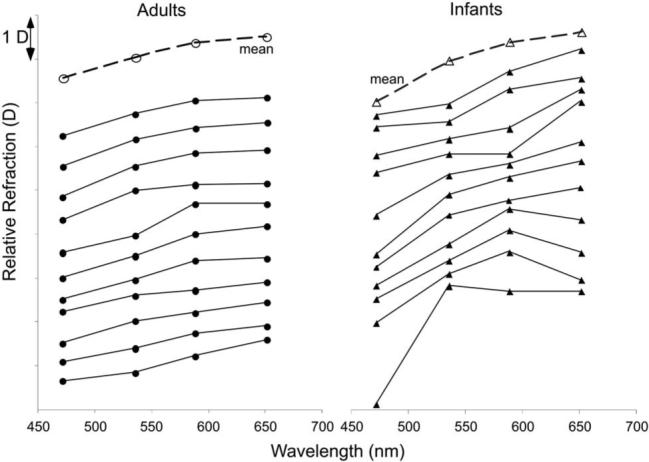
Relative defocus as a function of wavelength as measured with the chromatic retinoscope. Eleven individual infant (triangles) and adult (circles) functions are plotted, with the mean function for each group.
The Indiana Eye Model [16] was used to estimate LCA for each subject. The mean slope of the fit for the transformed axes was 0.62 (SD±0.11) in the adult group, and 1.04 (SD±0.27) in the infant group. The mean R2 of the adult fits was 0.95 (SD±0.04) and for the infants it was 0.83 (SD±0.13). The mean LCA difference in defocus between 472 and 652 nm was 0.96 D (SD±0.17 D) for the adult subjects and 1.62 D (SD±1.14 D) for the infants. A t-test comparing the LCA distributions indicated that they were significantly different from each other (p<0.001, t=−4.68, df=20). The ratio of infant to adult mean LCA values was 1.66, which was not significantly different from the predicted value of 1.5 (p=0.30, t=1.06, df=20).
The model fits were also used to interpolate the wavelength equivalent to the chromatic retinoscope result with no filter (see Fig. 5). The mean adult wavelength equivalent was 586 nm (SD±37 nm) and the infant value was 654 nm (SD±103 nm). The difference between these distributions approached significance (p=0.064, t=−2.03, df=20), implying that the reflections from the infant eyes had a tendency to include longer wavelengths.
The subjective data collected from the adults using the Badal system are plotted for comparison in Fig. 7 in the same vertical order as presented in Fig. 6. Both the retinoscopy and subjective data were referred to the spectacle plane and are therefore directly comparable. The mean slope of the transformed subjective model fit was 0.60 (SD±0.12), and the mean R2 was 0.98. The mean LCA between the measurements made with the 472 and 652 nm filters in the subjective protocol was 0.94 D (SD±1.19 D). These data were not significantly different from the retinoscopy values (paired t-test, p=0.64, t=0.47, df=10), and the mean absolute difference across individuals was 0.17 D (SD±0.14 D).
Fig. 7.
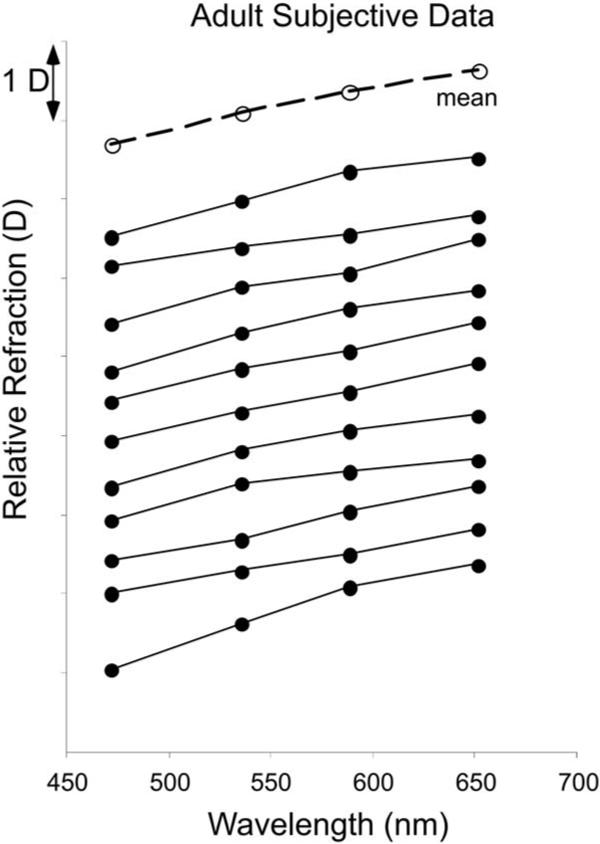
Relative defocus as a function of wavelength as measured with the subjective Badal optometer. Eleven individual adult functions are plotted, with the mean function for the group.
4. DISCUSSION
The subjective and objective data collected from the adults are in good agreement with each other, and with previous literature [17–29] (with Morrell et al. in particular [30]). The consistency across the techniques suggests that for retinoscopy in adults there is little difference in the average reflective plane with wavelength.
The retinoscopy data from the two- to four-month-old infants suggest that their LCA is approximately 1.7 times greater than the adult value. This is not significantly different from the prediction of a factor of 1.5 that was made based on their eye size.
Assuming that the only differences between infant and adult eyes are axial length and refractive power, the difference between retinoscopy data and subjective data in infants would also be predicted to be a factor of 1.5 greater than found in adults. Therefore, if subjective data could be collected from infants, the mean subjective LCA would be predicted to be approximately 0.03 D different from their retinoscopy data (based on the difference in adult means of 0.02 D between 0.96 D and 0.94 D). If all else is not equivalent, any overestimation in the predicted difference between infant retinoscopy and subjective data cannot be dramatic, as the predicted value of 0.03 D is already small.
If the equivalent planes reflecting different wavelengths are farther apart in the infant retina than in the adult, however (in the sense shown in Fig. 4), the subjective LCA could be underestimated more in the infant than in the adult. This could be due to increased specular reflection at the inner limiting membrane, or the wider photoreceptor inner segments and shorter outer segments leading to disrupted waveguide properties, for example. As an extreme example, if the shortest wavelength were reflected on average from the vitreo–retinal interface and the longest wavelength were reflected on average from the retinal pigment epithelium, a distance of approximately 250 μm in adults [43], retinoscopy would underestimate subjective LCA by approximately 1.9 D in an infant eye with a posterior nodal distance of 11.7 mm [44]. The total infant subjective LCA would therefore be closer to 3.5 D, and the infant to adult ratio would be closer to 3.6, which would be a factor of two different from the measured value of 1.7. This is an extreme example, however.
In addition to the difference between infant and adult data in the mean retinoscopy estimates of LCA, the infant data are also more variable than the adult data. This may have resulted from any of the following factors: (i) true variation in chromatic aberration across infants, (ii) the limited cooperation of the infants, or (iii) variability in the alignment of the retinoscope with the infant eye. With regard to the third possibility, it is likely that the optics of the infant eye, like those of the adult eye, vary with eccentricity [45,46]. Adult LCA between 458 and 633 nm gradually increases with eccentricity from 1 D to 1.6 D at an eccentricity of 40 degrees [46]. Thus variability in the infant data may have been introduced if the “foveal” infant measurements were not well aligned, although it is unlikely that measurements were taken at more than 25 degrees eccentricity (a decentration of the first Purkinje image of greater than 2 mm [47]).
A. Effect of LCA on Infants’ Visual Performance
The final effect of LCA on infants’ visual performance will depend on several factors including pupil size, the amount of light at each wavelength in the retinal image, and the spectral absorption of the photoreceptors.
The effect on visual performance of any kind of defocus must take pupil size into account, as a small pupil will lessen the impact of defocus by reducing its angular contribution in the point-spread function [48].
Although the retinoscopy data indicated that the chromatic aberration of the eye is larger in infants than adults, the difference may actually be compensated for in a polychromatic retinal image by the effect of pupil size. The angular size of the blur circle on the retina subtended at the exit pupil b in radians can be approximated using the equation
| (2) |
where P is the pupil diameter in meters, and D is defocus in diopters [49]. The data collected here suggest that the defocus resulting from chromatic aberration in these infants is at least 1.5 times that of an adult. However, adults’ natural pupil sizes have been found to be between 1 and 1.5 times larger than young infants’ [50–53]. This implies that the impact of chromatic aberration in the infant retinal image could be almost equivalent to that in the adult image for the youngest infants.
The infant media are known to transmit more light at shorter wavelengths than adult media do, and young infants have less macular pigment than found in adults [54,55]. Ocular transmission at short wavelengths decreases with increasing age, while the transmission of longer wavelengths is independent of age. Thus the increased transmission of the infant eye suggests that the chromatic aberration at short wavelengths is likely to be well represented in the retinal image.
Although the angular blur circle size on the retina may be similar to that in adults, and the short wavelengths may be better represented in the retinal image, the final effect of LCA on an infant's vision depends on the spectral sensitivity of the photoreceptors (the Vλ function). The fact that the photoreceptors are least sensitive to the extremes of the visible spectrum means that the effect of the LCA is reduced. Whichever wavelengths are focused on the photoreceptors (see Sivak and Bobier [56]), the wavelengths that are the most blurred are also those to which the photoreceptors are the least sensitive (i.e., at the tails of the Vλ function). Thus the final impact of LCA on the visual system may be decreased after photon absorption. Thibos et al. [28] estimated that the effect in adults of LCA on image contrast after photon absorption is roughly equivalent to a defocus of 0.2 D (as shown in their Fig. 4). It is known that all of the photoreceptor classes are functioning within a month after birth and that the infant Vλ has a shape and peak wavelength similar to the adult version (e.g., [57–60]). Thus the effect of Vλ should be comparable in infants and adults.
B. Indicating the Sign of Defocus
As described in the introduction, the systematic ordering of focal planes with wavelength that results from LCA may be used to derive directional information for accommodation and eye growth [61,62]. We have recently found that three-month-old infants are able to make an accommodative response to a 0.5 D amplitude sinusoidal target motion in binocular viewing conditions and 0.75 D in monocular viewing [63,64]. For the accommodative system it therefore appears that signals of less than a diopter can be detected (although disparity or proximal cues rather than blur information could also be driving the accommodative response, at least in binocular conditions [65]). These data suggest that the sensitivity of the accommodative system is close to the scale of the amount of LCA present in the infant eye. Higher-order monochromatic aberrations have also been proposed as a cue for determining the sign of defocus [62,66–69]. The higher-order monochromatic aberrations of the six-week-old infant eye are equivalent to approximately 0.4 D for a typical 3 mm pupil [50]. Thus, both higher-order monochromatic aberrations and chromatic aberration may be detectable at least to the accommodation system and could be available for computing the direction of defocus in the retinal image (although see Fig. 7 in Wang and Candy [50], which demonstrates the individual differences in the higher-order aberrations). Many young infants are capable of solving this problem in less than a second, as they are able to generate accommodative responses in the correct direction after latencies of this length [70].
C. Measurement of Refractive Error
Inspection of the polychromatic and chromatic retinoscopy results and the fitted LCA functions suggests that infants’ polychromatic (white) retinoscopy refractions are equivalent to refractions found at somewhat longer wavelengths than in adults. This suggests that the spectral distribution of light reflected from the retina may differ between adults and infants, with the infant reflection containing a higher proportion of long-wavelength light than the adult reflection does. The mean difference in equivalent wavelength between adults and infants corresponds to a difference in measured refraction of approximately a quarter of a diopter (Fig. 6), implying that there could be an artifactual difference of this scale in refractive errors routinely measured with polychromatic clinical retinoscopes.
The chromatic retinoscopy and LCA data shown in Fig. 6 also suggest that there is a difference in measured infant refraction of at least three quarters of a diopter between typical near-infrared wavelengths used in automated refraction instruments and the wavelength at the peak of the Vλ function. This difference is greater than that found for adults. It is therefore important to consider incorporating an adjustment for infants’ chromatic aberration in the design of these instruments, in addition to any requirement based on the planes of reflection (e.g., in the sense of the “small eye artifact” [71]). The appropriate adjustment depends on the wavelength that infants without cycloplegia typically focus on their photoreceptors, which is yet to be determined [56].
5. CONCLUSIONS
The data collected from infants indicate that their LCA is greater that that of adults by a factor of approximately 1.7. This result is consistent with a prediction based on a simple schematic eye with the optical power of the infant eye. The measured LCA appears sufficient to be used in determining the direction of defocus, but its impact on retinal image quality is likely to be reduced by the effect of the smaller pupil size found in early infancy.
ACKNOWLEDGMENTS
We thank Bill Monette for building the experimental equipment, Diane Goss for recruiting the infant subjects, the infants and parents for their participation, and Kate Gray and Shrikant Bharadwaj for help with the data collection. We also thank Larry Thibos and Arthur Bradley for helpful discussion. This research was supported by NIH grants R01 EY014460 awarded to T. R. Candy and K12 EY015504 supporting D. F. W. Teel.
REFERENCES
- 1.Sivak JG, Mandelman T. Chromatic dispersion of the ocular media. Vision Res. 1982;22:997–1003. doi: 10.1016/0042-6989(82)90036-0. [DOI] [PubMed] [Google Scholar]
- 2.Dobson V, Teller DY. Visual acuity in human infants: a review and comparison of behavioral and electrophysiological studies. Vision Res. 1978;18:1469–1483. doi: 10.1016/0042-6989(78)90001-9. [DOI] [PubMed] [Google Scholar]
- 3.Norcia AM, Tyler CW. Spatial frequency sweep VEP: visual acuity during the first year of life. Vision Res. 1985;25:1399–1408. doi: 10.1016/0042-6989(85)90217-2. [DOI] [PubMed] [Google Scholar]
- 4.Norcia AM, Tyler CW, Hamer RD. Development of contrast sensitivity in the human infant. Vision Res. 1990;30:1475–1486. doi: 10.1016/0042-6989(90)90028-j. [DOI] [PubMed] [Google Scholar]
- 5.Banks MS, Salapatek P. Contrast sensitivity function of the infant visual system. Vision Res. 1976;16:867–869. doi: 10.1016/0042-6989(76)90147-4. [DOI] [PubMed] [Google Scholar]
- 6.Teller DY. First glances: the vision of infants. the Friedenwald lecture. Invest. Ophthalmol. Visual Sci. 1997;38:2183–2203. [PubMed] [Google Scholar]
- 7.Banks MS, Bennett PJ. Optical and photoreceptor immaturities limit the spatial and chromatic vision of human neonates. J. Opt. Soc. Am. A. 1988;5:2059–2079. doi: 10.1364/josaa.5.002059. [DOI] [PubMed] [Google Scholar]
- 8.Wilson HR. Development of spatiotemporal mechanisms in infant vision. Vision Res. 1988;28:611–628. doi: 10.1016/0042-6989(88)90111-3. [DOI] [PubMed] [Google Scholar]
- 9.Brown AM, Dobson V, Maier J. Visual acuity of human infants at scotopic, mesopic and photopic luminances. Vision Res. 1987;27:1845–1858. doi: 10.1016/0042-6989(87)90113-1. [DOI] [PubMed] [Google Scholar]
- 10.Rucker FJ, Kruger PB. Accommodation responses to stimuli in cone contrast space. Vision Res. 2004;44:2931–2944. doi: 10.1016/j.visres.2004.07.005. [DOI] [PubMed] [Google Scholar]
- 11.Kruger PB, Nowbotsing S, Aggarwala KR, Mathews S. Small amounts of chromatic aberration influence dynamic accommodation. Optom. Vision Sci. 1995;72:656–666. doi: 10.1097/00006324-199509000-00009. [DOI] [PubMed] [Google Scholar]
- 12.Kruger PB, Mathews S, Aggarwala KR, Sanchez N. Chromatic aberration and ocular focus: Fincham revisited. Vision Res. 1993;33:1397–1411. doi: 10.1016/0042-6989(93)90046-y. [DOI] [PubMed] [Google Scholar]
- 13.Rucker FJ, Kruger PB. Cone contributions to signals for accommodation and the relationship to refractive error. Vision Res. 2006;46:3079–3089. doi: 10.1016/j.visres.2006.04.009. [DOI] [PubMed] [Google Scholar]
- 14.Wildsoet CF, Howland HC, Falconer S, Dick K. Chromatic aberration and accommodation: their role in emmetropization in the chick. Vision Res. 1993;33:1593–1603. doi: 10.1016/0042-6989(93)90026-s. [DOI] [PubMed] [Google Scholar]
- 15.Rohrer B, Schaeffel F, Zrenner E. Longitudinal chromatic aberration and emmetropization: results from the chicken eye. J. Physiol. (London) 1992;449:363–376. doi: 10.1113/jphysiol.1992.sp019090. [DOI] [PMC free article] [PubMed] [Google Scholar]
- 16.Thibos LN, Ye M, Zhang XX, Bradley A. The chromatic eye: a new reduced-eye model of ocular chromatic aberration in humans. Appl. Opt. 1992;31:3594–3600. doi: 10.1364/AO.31.003594. [DOI] [PubMed] [Google Scholar]
- 17.Wald G, Griffin DR. The change in refractive power of the human eye in dim and bright light. J. Opt. Soc. Am. 1947;37:321–336. doi: 10.1364/josa.37.000321. [DOI] [PubMed] [Google Scholar]
- 18.Bedford RE, Wyszecki G. Axial chromatic aberration of the human eye. J. Opt. Soc. Am. 1957;47:564–565. doi: 10.1364/josa.47.0564_1. [DOI] [PubMed] [Google Scholar]
- 19.Ivanoff A. Revue d'Optique Théorique et Instrumentale. Durand; Paris: 1953. Les aberrations de l'oeil leur rôle dans l'accommodation; pp. 43–44. [Google Scholar]
- 20.Millodot M, Sivak J. Influence of accommodation on the chromatic aberration of the eye. Br. J. Physiol. Opt. 1973;28:169–174. [PubMed] [Google Scholar]
- 21.Charman WN, Jennings JA. Objective measurements of the longitudinal chromatic aberration of the human eye. Vision Res. 1976;16:999–1005. doi: 10.1016/0042-6989(76)90232-7. [DOI] [PubMed] [Google Scholar]
- 22.Powell L. Lenses for correcting chromatic aberration of the eye. Appl. Opt. 1981;20:4152–4155. doi: 10.1364/AO.20.004152. [DOI] [PubMed] [Google Scholar]
- 23.Lewis AL, Katz M, Oehrlein C. A modified achromatizing lens. Am. J. Optom. Physiol. Opt. 1982;59:909–911. doi: 10.1097/00006324-198211000-00011. [DOI] [PubMed] [Google Scholar]
- 24.Ware C. Human axial chromatic aberration found not to decline with age. Graefe's Arch. Clin. Exp. Ophthalmol. 1982;218:39–41. doi: 10.1007/BF02134100. [DOI] [PubMed] [Google Scholar]
- 25.Mordi JA, Adrian WK. Influence of age on chromatic aberration of the human eye. Am. J. Optom. Physiol. Opt. 1985;62:864–869. doi: 10.1097/00006324-198512000-00007. [DOI] [PubMed] [Google Scholar]
- 26.Howarth PA, Bradley A. The longitudinal chromatic aberration of the human eye, and its correction. Vision Res. 1986;26:361–366. doi: 10.1016/0042-6989(86)90034-9. [DOI] [PubMed] [Google Scholar]
- 27.Cooper DP, Pease PL. Longitudinal chromatic aberration of the human eye and wavelength in focus. Am. J. Optom. Physiol. Opt. 1988;65:99–107. doi: 10.1097/00006324-198802000-00006. [DOI] [PubMed] [Google Scholar]
- 28.Thibos LN, Bradley A, Zhang XX. Effect of ocular chromatic aberration on monocular visual performance. Optom. Vision Sci. 1991;68:599–607. doi: 10.1097/00006324-199108000-00005. [DOI] [PubMed] [Google Scholar]
- 29.Fernandez EJ, Unterhuber A, Prieto P, Hermann B, Drexler W, Artal P. Ocular aberrations as a function of wavelength in the near infrared measured with a femtosecond laser. Opt. Express. 2005;13:400–409. doi: 10.1364/opex.13.000400. [DOI] [PubMed] [Google Scholar]
- 30.Morrell A, Whitefoot HD, Charman WN. Ocular chromatic aberration and age. Ophthalmic Physiol. Opt. 1991;11:385–390. [PubMed] [Google Scholar]
- 31.Howarth PA, Zhang XX, Bradley A, Still DL, Thibos LN. Does the chromatic aberration of the eye vary with age? J. Opt. Soc. Am. A. 1988;5:2087–2092. doi: 10.1364/josaa.5.002087. [DOI] [PubMed] [Google Scholar]
- 32.Larsen JS. The sagittal growth of the eye. IV. Ultrasonic measurement of the axial length of the eye from birth to puberty. Acta Ophthalmol. 1971;49:873–886. doi: 10.1111/j.1755-3768.1971.tb05939.x. [DOI] [PubMed] [Google Scholar]
- 33.Emsley HH. Optics of Vision. Vol. 1. Hatton Press; 1963. Visual Optics. [Google Scholar]
- 34.Wood IC, Mutti DO, Zadnik K. Crystalline lens parameters in infancy. Ophthalmic Physiol. Opt. 1996;16:310–317. [PubMed] [Google Scholar]
- 35.Bobier CW, Sivak JG. Chromoretinoscopy. Vision Res. 1978;18:247–250. doi: 10.1016/0042-6989(78)90158-x. [DOI] [PubMed] [Google Scholar]
- 36.Bobier CW, Sivak JG. Chromoretinoscopy and its instrumentation. Am. J. Optom. Physiol. Opt. 1980;57:106–108. doi: 10.1097/00006324-198002000-00005. [DOI] [PubMed] [Google Scholar]
- 37.ANSI-Z136.1 . American National Standard for Safe Use of Lasers. Laser Institute of America; Orlando: 2000. [Google Scholar]
- 38.Elsner AE, Burns SA, Weiter JJ, Delori FC. Infrared imaging of subretinal structures in the human ocular fundus. Vision Res. 1996;36:191–205. doi: 10.1016/0042-6989(95)00100-e. [DOI] [PubMed] [Google Scholar]
- 39.Atchison DA, Bradley A, Thibos LN, Smith G. Useful variations of the Badal Optometer. Optom. Vision Sci. 1995;72:279–284. doi: 10.1097/00006324-199504000-00010. [DOI] [PubMed] [Google Scholar]
- 40.Cornsweet TN. The staircase-method in psychophysics. Am. J. Psychol. 1962;75:485–491. [PubMed] [Google Scholar]
- 41.Saunders KJ, Woodhouse JM, Westall CA. Emmetropisation in human infancy: rate of change is related to initial refractive error. Vision Res. 1995;35:1325–1328. doi: 10.1016/0042-6989(94)00222-8. [DOI] [PubMed] [Google Scholar]
- 42.Mayer DL, Hansen RM, Moore BD, Kim S, Fulton AB. Cycloplegic refractions in healthy children aged 1 through 48 months. Arch. Ophthalmol. (Chicago) 2001;119:1625–1628. doi: 10.1001/archopht.119.11.1625. [DOI] [PubMed] [Google Scholar]
- 43.Drexler W, Morgner U, Ghanta RK, Kartner FX, Schuman JS, Fujimoto JG. Ultrahigh-resolution ophthalmic optical coherence tomography. Nat. Med. 2001;7:502–507. doi: 10.1038/86589. erratum in Nat. Med. 7, 636 (2001).
- 44.Candy TR, Crowell JA, Banks MS. Optical, receptoral, and retinal constraints on foveal and peripheral vision in the human neonate. Vision Res. 1998;38:3857–3870. doi: 10.1016/s0042-6989(98)00080-7. [DOI] [PubMed] [Google Scholar]
- 45.Navarro R, Artal P, Williams DR. Modulation transfer of the human eye as a function of retinal eccentricity. J. Opt. Soc. Am. A. 1993;10:201–212. doi: 10.1364/josaa.10.000201. [DOI] [PubMed] [Google Scholar]
- 46.Rynders MC, Navarro R, Losada MA. Objective measurement of the off-axis longitudinal chromatic aberration in the human eye. Vision Res. 1998;38:513–522. doi: 10.1016/s0042-6989(97)00216-2. [DOI] [PubMed] [Google Scholar]
- 47.Riddell PM, Hainline L, Abramov I. Calibration of the Hirschberg test in human infants. Invest. Ophthalmol. Visual Sci. 1994;35:538–543. [PubMed] [Google Scholar]
- 48.Smith G, Jacobs RJ, Chan CD. Effect of defocus on visual acuity as measured by source and observer methods. Optom. Vision Sci. 1989;66:430–435. doi: 10.1097/00006324-198907000-00004. [DOI] [PubMed] [Google Scholar]
- 49.Smith G. Angular diameter of defocus blur discs. Am. J. Optom. Physiol. Opt. 1982;59:885–889. doi: 10.1097/00006324-198211000-00006. [DOI] [PubMed] [Google Scholar]
- 50.Wang J, Candy TR. Higher order monochromatic aberrations of the human infant eye. J. Vision. 2005;5:543–555. doi: 10.1167/5.6.6. [DOI] [PMC free article] [PubMed] [Google Scholar]
- 51.MacLachlan C, Howland HC. Normal values and standard deviations for pupil diameter and interpupillary distance in subjects aged 1 month to 19 years. Ophthalmic Physiol. Opt. 2002;22:175–182. doi: 10.1046/j.1475-1313.2002.00023.x. [DOI] [PubMed] [Google Scholar]
- 52.Banks MS. The development of visual accommodation during early infancy. Child Dev. 1980;51:646–666. [PubMed] [Google Scholar]
- 53.Salapatek P, Banks MS. Infant sensory assessment: vision. In: Minifie FD, Lloyd LL, editors. Communicative and Cognitive Abilities: Early Behavioral Assessment. University Park Press; 1978. [Google Scholar]
- 54.Boettner EA, Wolter JR. Transmission of the Ocular Media. Air Force Technical Documentary Report No. MRL-TDR-62-34. 1962 [Google Scholar]
- 55.Bone RA, Landrum JT, Fernandez L, Tarsis SL. Analysis of the macular pigment by HPLC: retinal distribution and age study. Invest. Ophthalmol. Visual Sci. 1988;29:843–849. [PubMed] [Google Scholar]
- 56.Sivak JG, Bobier CW. Accommodation and chromatic aberration in young children. Invest. Ophthalmol. Visual Sci. 1978;17:705–709. [PubMed] [Google Scholar]
- 57.Bieber ML, Knoblauch K, Werner JS. M- and L-cones in early infancy: II. Action spectra at 8 weeks of age. Vision Res. 1998;38:1765–1773. doi: 10.1016/s0042-6989(97)00384-2. [DOI] [PubMed] [Google Scholar]
- 58.Clavadetscher JE, Brown AM, Ankrum C, Teller DY. Spectral sensitivity and chromatic discriminations in 3- and 7-week-old human infants. J. Opt. Soc. Am. A. 1988;5:2093–2105. doi: 10.1364/josaa.5.002093. [DOI] [PubMed] [Google Scholar]
- 59.Fulton AB, Hansen RM. The development of scotopic sensitivity. Invest. Ophthalmol. Visual Sci. 2000;41:1588–1596. [PubMed] [Google Scholar]
- 60.Werner JS. Development of scotopic sensitivity and the absorption spectrum of the human ocular media. J. Opt. Soc. Am. 1982;72:247–258. doi: 10.1364/josa.72.000247. [DOI] [PubMed] [Google Scholar]
- 61.Fincham EF. The accommodation reflex and its stimulus. Br. J. Ophthamol. 1951;35:381–393. doi: 10.1136/bjo.35.7.381. [DOI] [PMC free article] [PubMed] [Google Scholar]
- 62.Wallman J, Winawer J. Homeostasis of eye growth and the question of myopia. Neuron. 2004;43:447–468. doi: 10.1016/j.neuron.2004.08.008. [DOI] [PubMed] [Google Scholar]
- 63.Wang J, Candy TR. The threshold stimulus for accommodation in human infants. Invest. Ophthalmol. Visual Sci. Suppl. 2006;47:271. [Google Scholar]
- 64.Wang J, Bharadwaj SR, Candy TR. The monocular threshold stimulus for accommodation in human infants. Invest. Ophthalmol. Visual Sci. Suppl. 2007;48:47. [Google Scholar]
- 65.Heath GG. Components of accommodation. Am. J. Optom. Arch. Am. Acad. Optom. 1956;33:569–579. doi: 10.1097/00006324-195611000-00001. [DOI] [PubMed] [Google Scholar]
- 66.Wilson BJ, Decker KE, Roorda A. Monochromatic aberrations provide an odd-error cue to focus direction. J. Opt. Soc. Am. A. 2002;19:833–839. doi: 10.1364/josaa.19.000833. [DOI] [PubMed] [Google Scholar]
- 67.Fernandez EJ, Artal P. Study on the effects of monochromatic aberrations in the accommodation response by using adaptive optics. J. Opt. Soc. Am. A. 2005;22:1732–1738. doi: 10.1364/josaa.22.001732. [DOI] [PubMed] [Google Scholar]
- 68.Hampson KM, Paterson C, Dainty C, Mallen EA. Adaptive optics system for investigation of the effect of the aberration dynamics of the human eye on steady-state accommodation control. J. Opt. Soc. Am. A. 2006;23:1082–1088. doi: 10.1364/josaa.23.001082. [DOI] [PubMed] [Google Scholar]
- 69.Chen L, Kruger PB, Hofer H, Singer B, Williams DR. Accommodation with higher-order monochromatic aberrations corrected with adaptive optics. J. Opt. Soc. Am. A. 2006;23:1–8. doi: 10.1364/josaa.23.000001. [DOI] [PubMed] [Google Scholar]
- 70.Tondel GM, Candy TR. Human infants’ accommodation responses to dynamic stimuli. Invest. Ophthalmol. Visual Sci. 2007;48:949–956. doi: 10.1167/iovs.06-0734. [DOI] [PMC free article] [PubMed] [Google Scholar]
- 71.Glickstein M, Millodot M. Retinoscopy and eye size. Science. 1970;168:605–606. doi: 10.1126/science.168.3931.605. [DOI] [PubMed] [Google Scholar]


