Abstract
Fas-associated factor 1 or FAF1 is a Fas binding protein implicated in apoptosis. FAF1 is the product of a gene at PARK 10 locus on chromosome 1p32, a locus associated with late-onset PD (Hicks et al., 2002). In the present study we investigated the role of FAF1 in cell death and in Parkinson’s disease (PD) pathogenesis. FAF1 levels were significantly increased in frontal cortex of PD as well as in PD cases with Alzheimer’s disease (AD) pathology compared to control cases. Changes in FAF1 expression were specific to PD-related α-synuclein pathology and nigral cell loss. In addition, PD-related insults including, mitochondrial complex I inhibition, oxidative stress, and increased α-synuclein expression specifically increased endogenous FAF1 expression in vitro. Increased FAF1 levels induced cell death and significantly potentiated toxic effects of PD-related stressors including, oxidative stress, mitochondrial complex I inhibition and proteasomal inhibition. These studies, together with previous genetic linkage studies, highlight the potential significance of FAF1 in pathogenesis of idiopathic PD.
Keywords: PARK 10, cell death, oxidative stress, α-synuclein, mitochondrial inhibition
Introduction
Parkinson’s disease (PD) is the most common neurodegenerative movement disorder comprising of motor symptoms that include tremor, rigidity and bradykinesia (Klockgether, 2004). The cardinal neuropathological features of PD include progressive loss of dopaminergic terminals in the striatum with subsequent death of neurons in the substantia nigra pars compacta (Hornykiewicz, 2002), and presence of cytoplasmic, α-synuclein-positive inclusions called Lewy bodies (Forno, 1987). The causes of degeneration, cell death and inclusion formation in sporadic PD is not clearly understood, though both genetic and environmental factors appear to play a crucial role. Experimental animal models and familial cases of PD, though few, have provided crucial insights into PD pathogenesis. Defective clearance of modified, toxic proteins via the ubiquitin proteasome system, mitochondrial dysfunction and oxidative stress appear to play a key role in cell death and protein aggregation (Abou-Sleiman et al., 2006; Dawson and Dawson, 2003).
One of the well-examined physiological pathways leading to cell death is programmed cell death (PCD) or apoptosis and is a process intrinsic to a cell that when activated causes its destruction (Vila and Przedborski, 2003). The key mediators of PCD are the proteolytic enzymes called ‘caspases’ (Vila and Przedborski, 2003). Caspase activation can be triggered by activation of death receptors such as Fas located on the cell surface of target cells (Nagata, 1997). FAF1 or Fas-associated factor 1 is a Fas-binding protein (Ryu and Kim, 2001), whose the role in apoptotic cell death is not well understood. Interestingly however, the human FAF1 gene has been localized to chromosome 1p32 (Kikyo et al., 1997) at the PARK 10 locus, a locus that has been recently associated with late-onset parkinson’s disease (Hicks et al., 2002). Furthermore, in vitro evidence suggests that FAF1 can initiate or enhance Fas-mediated aopototic cell death (Chu et al., 1995). Therefore, in this study we have examined the role of this novel protein, FAF1, in PD pathogenesis. We demonstrate here that FAF1 expression level is specifically upregulated in PD and in Alzheimer’s disease (AD) cases with extensive PD pathology (AD/PD), and increased FAF1 expression in a cell model, with or without PD-related stressors, is associated with cell death.
Materials and Methods
Collection and Preparation of human case material
Human brain tissues were obtained from the brain bank incorporated into our Neurodegenerative Disease Center. The brain bank consists of an extensive postmortem brain collection from patients with AD, PD, and related neurodegenerative diseases. When a brain is accessioned at autopsy, a gross examination is carried out, and then the brain is sectioned coronally. Selected slices are rapidly frozen between metal plates maintained at −70° C. The remaining slices are fixed for 24–48 hours in 4% paraformaldehyde, and then equilibrated in cryoprotectant following the removal of small tissue blocks from multiple brain regions for paraffin embedding and microscopic evaluation.
Human brain tissue used in this study were derived from 39 autopsy brains, including from 12 subjects aged 52 to 76 years (mean = 72) with clinically and neuropathologically confirmed PD, 8 subjects aged 69 to 92 years (mean = 77) with clinically and neuropathologically confirmed Alzheimer’s disease (AD), 8 subjects aged 60 to 85 years (mean = 77) with both confirmed AD and PD, and 11 controls aged 58 to 88 years (mean = 72). The neuropathologic diagnosis of PD was based on the presence of nigral degeneration, Lewy bodies and α-synuclein-positive inclusions. The neuropathologic diagnosis of definite AD was made according to criteria of the Consortium to Establish a Registry for Alzheimer’s Disease (Mirra et al., 1991). Control cases had no clinical history or neuropathologic diagnosis of neurological disease. Post-mortem interval ranged from 3 to 12 hours and was similar among the different groups.
Cell culture and transfections
Human embryonic kidney cells (HEK), were cultured in DMEM medium containing 5mM glucose (Mediatech, Herdon, VA), 10% fetal bovine serum (Invitrogen, Carlsbad, CA), and 50U/ml penicillin and streptomycin. Cells were grown on Matrigel-coated cover-slips (BD sciences, Franklin Lakes, NJ) for immunocyto-chemical analysis and on 60mm dish for western blot analysis. Cells were transfected with human FAF1 construct (pLenti6, Invitrogen) or vector alone or using Fugene 6 transfection reagent (Roche, Indianapolis, IN). FAF1 cDNA (MGC clone 3486) was purchased from American Type Culture Collection (Manassas, VA). Using the Gateway System Vectors (Invitrogen, Carlsbad, CA), FAF1 cDNA was transferred to the pLenti6 expression vector. The correct FAF1 sequence was confirmed by sequencing reactions.
Immunoblotting and Quantitation
Immunoblotting methods have been described previously (Betarbet et al., 2006). Cells were grown on 60mm plates, washed two times in PBS, pH 7.4, and incubated in 150µl of cell lysis buffer (Promega, Madison, WI) containing protease inhibitors (Roche, Indianapolis, IN) for 45 mins at 4°C. Cells were scraped and lysate centrifuged at 10,000 xg for 10 mins. Supernatant was collected as the soluble fraction. Protein content was assayed using Bio-Rad protein assay (Bio-Rad, Hercules, CA) according to manufacture’s protocol. Human brain tissue samples where homogenized in PBS supplemented with protease inhibitors (Roche, Mannheim, Germany) and centrifuged at 10,000 × g for 10 mins. Supernatant was collected as the soluble fraction. Protein content was assayed using Bio-Rad protein assay (BioRad, Hercules, CA) according to manufacture’s protocol.
Protein samples were separated by SDS-PAGE on 12 % polyacrylamide gels and transferred to PVDF Immobilon membrane (Millipore, Billercia, MA). Primary antibodies used were polyclonal rabbit anti FAF1 (1:5000, kind gift from deCode Genetics, Iceland) and polyclonal rabbit anti cleaved caspase -3 (1:100, Cell Signalling, MA). β-actin (mouse monoclonal, 1:20K, Abcam, MA) was used as a loading control. AlexaFluor 680 donkey anti-mouse (1:10K; Molecular Probes, Eugene, OR) and IRDye 800 goat anti-rabbit (1:10K; Rockland, Gilbertsville, PA) secondary antibodies were used. Blots were dried, scanned, and quantitated with an Odyssey Infrared Imaging System (Li-Cor Biosciences, Lincoln, NE).
Immunohistochemistry
50µm-thick paraformaldehyde-immersion fixed sections through frontal cortex, striatum and substantia nigra were incubated in primary antibody for 72hrs, followed by 1 hr incubation in secondary antibodies conjugated to appropriate fluorophores. The primary antibodies used were polyclonal rabbit anti FAF1 (1:1000, kind gift from decode Genetics, Iceland), polyclonal rat anti dopamine transporter (DAT, 1:500; generated in our lab and characterized previously, (Ciliax et al., 1999; Miller et al., 1997)) and mouse monoclonal antibody to oxidized α-synuclein (kind gift from Dr. Virginia Lee (University of Pennsylvania, Philadelphia, PA)) at 1:10,000 (Duda et al., 2002). Secondary antibodies used were Alexa 488 goat anti-mouse/rabbit (1:200, Molecular Probes, Eugene, OR) and Cy3 or biotinylated goat anti-mouse/rabbit (1:200, Jackson Immunoresearch Labs). For controls primary antibodies were (a) either pre-absorbed with specific peptide sequence or (b) were omitted. Images were captured using a Zeiss (Thornwood, NY) LSM 510 laser scanning confocal microscope. For final output, images were processed using Adobe Photoshop 7.0 software. Autoflourescence eliminator reagent (Chemicon, CA) was used to eliminate background autoflourescence in human tissue.
Immunocytochemistry
HEK293 cells were plated onto Matrigel-coated coverslips (BDbiosciences, Franklin Lakes, NJ) and transfected with human FAF1 plasmids using Fugene-6 transfecting reagent (Roche, Indianapolis, IN) the following day. Twenty-four hours after transfection, cells were fixed with 2% paraformaldehyde, rinsed in PBS followed by overnight incubation in primary antibody (same as above) at 4°C. The following day, cells were incubated with fluorophore-conjugated secondary antibody for 1 hour at room temp (Goat anti-mouse Cy3, 1:100, JacksonImmunoresearch, West Grove, PA) followed by incubation in Hoechst 333258 (0.4 µg/ml; Molecular Probes, Invitrogen, Carlsbad, CA) for 3 minutes. Cells on coverslips were mounted using Vectashield (Vector Laboratories, Burlingame, CA) and imaged on a Zeiss (Thornwood, NY) LSM 510 laser scanning confocal microscope. For final output, images were processed using Adobe Photoshop 7.0 software.
Cell death assay
Cell death was determined using Sytox green (Molecular Probes, Invitrogen, Carlsbad, CA) as previously reported (Sherer et al., 2003). Sytox green intercalates into DNA of dead cells but is excluded from live cells. Sytox green fluorescence is detected with excitation at 485nm and emission at 538nm, with a fluorescence microplate system (Molecular Devices, Sunnyvale, CA). HEK293 cells were transfected with FAF1 vector or empty (pcDNA) vector using Fugene 6 transfection reagent. Twenty four hs post transfection cells were plated in 96 well plates at 75,000/sq cm, and at 48hs post-transfection cells were loaded with 1 µm Sytox green for 10min, and treated with varying concentrations of H2O2, lactacystin, or rotenone. Control wells received equal volumes of solvent. Treatments were done in five repeats. Using the plate reader cell death was followed continuously for 24hs during treatment with readings taken every hour. At the end of the experiment fluorescence readings were normalized to total plating density by lysing the cells. The cells were lysed by freezing them at −80°C for 1hr and thawing in the incubator for 1h. FAF1 transfected cells used for the cell death assay were plated in parallel for evaluation for continued FAF1 overexpression using immunoblots.
Cell viability
Cell viability was determined using the vital dye trypan blue (0.25% stock solution) at 1:1 dilution. Trypan blue stains dead cells but is excluded from live cells. HEK cell were treated with 200 µM H2O2, 50nM rotenone and 10µM lactacystin, 24hs post-FAF1 transfection. 24hs post-treatment, cells were gently scraped and collected in media. 100µl of cell suspension was used for quantitation while the remaining cells were lysed and used for immunoblotting to confirm FAF1 overexpression. 100µl trypan blue solution was added to the cell suspension and both clear (live) and blue cells (dead) were counted using a hemocytometer. Cell death was presented as percentage of total cells for each treatment.
Statistical analysis
Statistical analysis used multivariate ANOVA or Students’s t test for independent samples. Significance was set at p≤ 0.05. Values shown represent mean ± SEM.
Results
Our initial experiments were aimed at detecting endogenous FAF1 expression in human brain tissue and determining if FAF1 expression levels and distribution were altered in PD. To detect FAF1 we had access to four antibodies, two commercially available (Santa Cruz Biotechnology, Inc, Santa Cruz, CA), one recognizing a N-terminal epitope(first 20 amino acids) and the other a C-terminal epitope (last 18 amino acids) and two novel antibodies made in collaboration with DeCode Genetics, Iceland, one recognizing the N-terminal epitope (first 17 amino acids) and the other recognizing the C-terminal epitope (last 20 amino acids). Preadsorbing the FAF1 antibodies with the antigenic peptides or full-length recombinant protein abolishes all immunoreactivity in immunocytochemistry and immunoblot experiments (not shown), confirming that FAF1 antibodies are highly specific. The novel FAF1 C-terminal antibody from deCode was most extensively used for our study since it provides the best detection of FAF1 protein in human cell lines and tissue using both immunocytochemical and immunoblotting techniques.
FAF1 expression in normal and diseased human brains
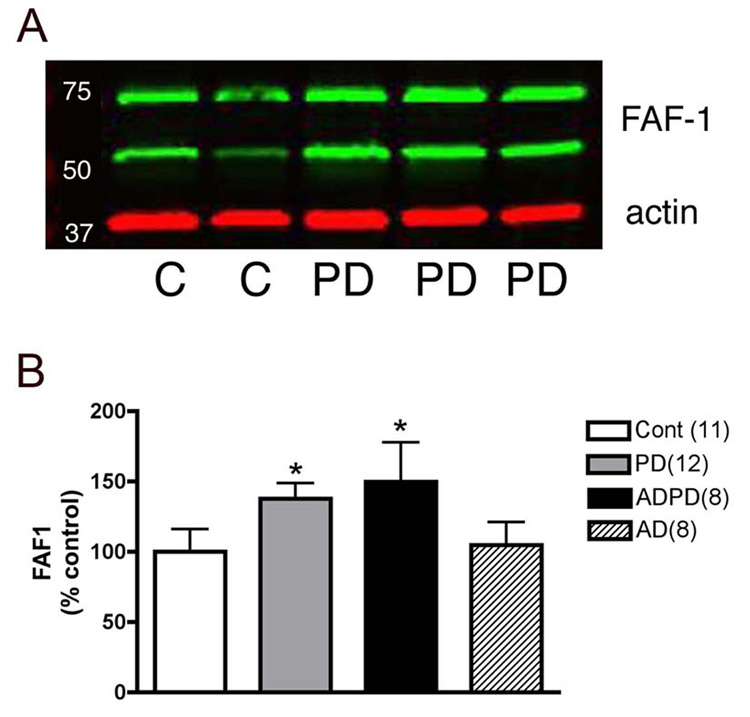
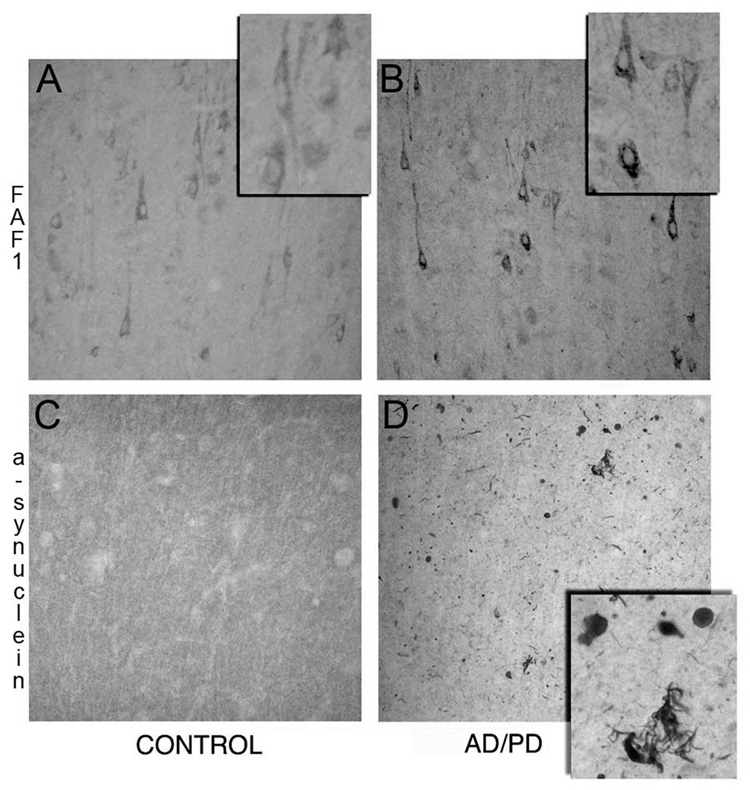
FAF1 has a differential distribution in the normal brain with specific regions of enrichment and low expression in white matter. Both neuronal and glial cells express FAF1 but expression level in neurons is comparatively higher. FAF1 expression can be detected in the frontal cortex (Fig 1) where it is concentrated in somatodendritic compartments of pyramidal and non-pyramidal neurons (Fig 2A). In contrast, FAF1 is expressed at low levels in the striatum (data not shown). In the substantia nigra FAF1 positive neurons can easily be detected in both the pars compacta (Fig 3A) and the pars reticulata region. In immunoblots FAF1 expression was detected as 74 and 57 kd bands (Fig 1) using the novel C-terminal antibody. Preabsorption studies with specific FAF1 peptides confirmed specificity of the antibody used. Therefore for quantitation both the FAF1 bands were measured and normalized to actin levels.
Fig 1. FAF1 expression in cortical tissue.
FAF1 levels were determined in cortical tissue homogenates from control, PD, AD and AD/PD cases. An example of an immunoblot is demonstrated in (A). FAF1 levels (green bands) were normalized to actin (red bands). FAF1 expression levels were selectively increased in PD and in AD/PD cortical tissue compared to control tissue but not in AD cases. Results presented as histograms (B) are mean±SEM. Number of cases analyzed in each group is given in parenthesis. * p<0.05, comparison of the three groups and statistical significance was determined using multivariate ANOVA.
Fig 2. FAF1 expression in cortical tissue from AD/PD patients.
Paraformaldehyde fixed frontal cortex tissue from control (A, C) and AD/PD (B, D) patients were immunostained for FAF1 (A & B) and α-synuclein (C &D). FAF1 immunmoreactive cortical neurons can be identified in the control cortex. FAF1 expression can be observed in cell bodies and proximal dendrites while the nucleus appears to be devoid of FAF1 expression. Note increase in FAF1 expression in cortical neurons and neuropil and extensive α-synuclein pathology including Lewy bodies and neurites in AD/PD brain.
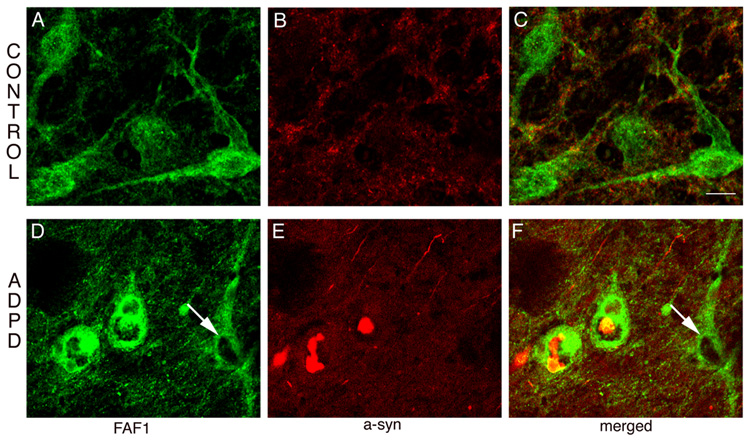
Fig 3. FAF1 expression in ADPD nigral neurons.
Sections through the substantia nigra (SN) were double-stained for FAF1 (green) and α-synuclein (red). Neurons from the control SN (A, B, C) have normal FAF1 expression in the cytoplasm and proximal dendrites and no α-synuclein pathology. However, in AD/PD cases (D, E, F), neurons with α-synuclein positive inclusions have increased FAF1 expression. In the same panel note the cell without α-synuclein positive inclusion (arrow) has normal levels of FAF1 expression. Bar = 20µm.
Next, we investigated if FAF1 expression levels and distribution were altered in PD brains. To confirm the specificity of the changes we also examined FAF1 levels in AD as well as in brains with both AD and PD pathology. Using immunoblotting techniques FAF1 expression was determined in cortical tissue rather than striatum and SN, the basal ganglia nuclei involved in PD pathology, since (1) cortex is one of the final targets during progression of PD, (2) there is extensive loss of dopaminergic nigral neurons in post mortem samples of PD and AD/PD cases (Damier et al., 1999) and (3) striatum expresses very low levels (undetectable) of FAF1. FAF1 levels were significantly increased in PD samples as compared to control tissue (Fig 1). Interestingly, FAF1 expression was also increased in AD/PD cortical tissue but not in AD only tissue, suggesting that the alteration in FAF1 expression is specific to PD-associated changes. Immunohistochemical analysis further confirmed the upregulation observed in FAF1 expression in cortical tissue (Fig 2). FAF1 expression was increased in both neurons and neuropil in PD and in AD/PD cortical tissue. Furthermore, FAF1 upregulation was exaggerated in AD/PD cases with extensive α-synuclein pathology in the cortex (Fig 2).
Immunohistochemical techniques allowed analysis of FAF1 expression in surviving nigral neurons in PD and AD/PD cases versus controls. Most of the surviving dopaminergic neurons, as identified by their size, had increase FAF1 expression (Fig 3) compared to control SN neurons. Co-localization with α-synuclein, to simultaneously detect Lewy body pathology, demonstrated FAF1 upregulation to be specific to neurons with α-synuclein-positive inclusions (Fig 3). Further, co-localization of FAF1 with dopamine transporter (DAT), to identify dopaminergic nigral neurons, demonstrated that FAF1 levels were increased in cells with reduce levels of DAT (data not shown). Smaller neurons of SN pars reticulata did not demonstrate any changes in FAF1 expression levels (data not shown).
Endogenous FAF1 expression and PD-related stressors
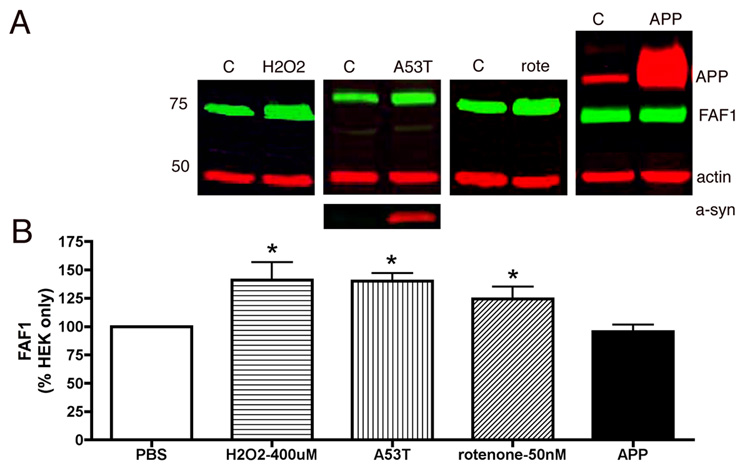
To further investigate the association of FAF1 in PD pathogenesis, endogenous FAF1 levels were determined in vitro in HEK cells following exposure to PD-related stressors. Mitochondrial complex I inhibition (Betarbet et al., 2000), oxidative stress (Jenner, 1998) and α-synuclein overexpression (Singleton et al., 2003) have been associated with PD pathogenesis. Therefore FAF1 expression was determined in HEK cells (1) exposed to rotenone, a potent complex I inhibitor and (2) hydrogen peroxide, a common oxidizing agent for 24hs and in cells overexpressing (3) α-synuclein or (4) amyloid precursor protein (APP) associated with AD pathology, and compared to normal HEK cells exposed to solvent alone. As demonstrated in Fig 4, endogenous FAF1 is elevated in HEK cells following complex I inhibition, increased oxidative stress and overexpression of α-synuclein. Interestingly overexpression of APP in HEK cells did not result in FAF1 upregulation.
Fig 4. Endogenous levels of FAF1 were specifically increased following exposure to PD-related stressors.
Endogenous FAF1 expression levels were determined in HEK cells. HEK cells were exposed to PBS (control), an oxidative stressor, hydrogen peroxide (400µM – 24h), a complex I inhibitor rotenone (100nM– 24h), or HEK cells were infected with human A53T mutant α-synuclein, or transfected with overexpressing amyloid precursor protein (APP) and FAF1 levels were determined using immunoblotting techniques. Panel A shows representative blots for each condition. FAF1 is in green while actin, alpha-synuclein (a-syn) and amyloid precursor protein (APP) are in red. Panel B is a graphic representation of FAF1 levels, following different treatment, normalized to actin levels. Histograms are presented as percentage of FAF1 in control cells ± sem. Interestingly levels of endogenous FAF1 increased in cells exposed to PD-related stressors but not in cells overexpressing amyloid precursor protein APP. *p<0.05 compared to control (PBS) cells. Statistical significance was determined using unpaired one-tailed t-test for comparison between control and treated groups as well as multivariate ANOVA for all groups.
FAF1 overexpresson facilitates/potentiates cell death
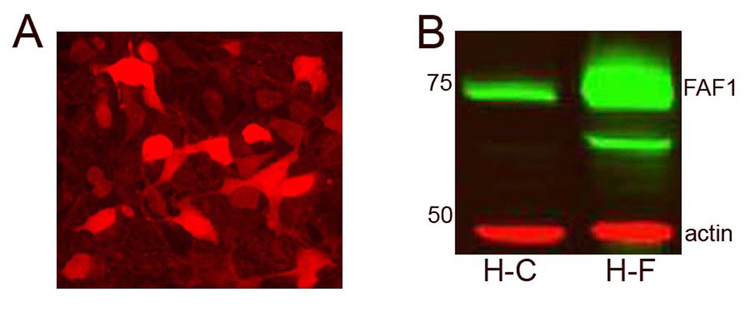
FAF1 levels are upregulated in cortical and nigral tissue from PD and AD/PD patients as well as in vitro in cultured cells exposed to PD related stressors. To investigate the functional role of FAF1 and examine the effects of FAF1 overexpression on cell survival, we used HEK293 cells that were transfected with a FAF1 vector or an empty vector (pcDNA) to serve as a control. First, FAF1 overexpression was confirmed using ICC and immunoblots as demonstrated in Fig 5. FAF1 expression could be detected > 72hs post-transfection, a time period required for the cell death assay (see method section). In addition, continued FAF1 expression was confirmed along with every cell death assay.
Fig 5. FAF1 overexpression in HEK293 cells.
FAF1 levels were detected in transfected HEK293 cells, using immunocytochemical (A) and immunoblotting techniques (B). (A) Note the increase expression of FAF1 in some cells, both in the cytosolic and nuclear compartments as compared to endogenous distribution of FAF1 that is mostly cytosolic. Scale bars- 20µm. (B) Transfected FAF1 cells (H-F) demonstrate an increased expression of FAF1 protein compared to HEK cells with vector (H-C) alone. HEK cells were transfected with vector (H-C) alone, or with FAF1 plasmid.
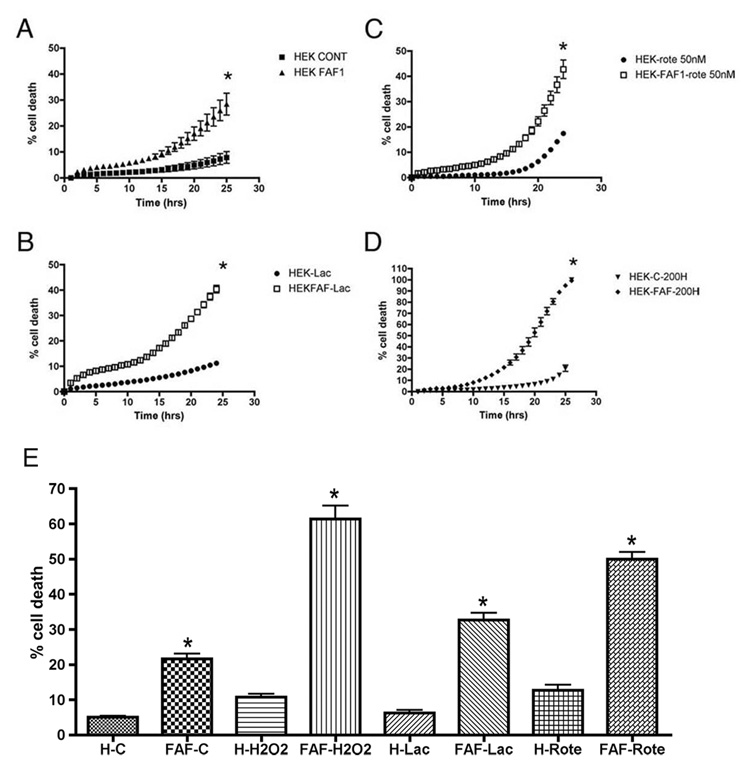
We studied the effects of FAF1 on basal as well as stressor-induced cell death. Cell death was assayed using Sytox green fluorescence. Sytox green intercalates with DNA of cells in which the plasma membrane has been perturbed, and as such measures both necrotic and apoptotic cells. As with the previous experiment, we chose PD-related stressors including, lactacystin, a proteasomal inhibitor, rotenone, a complex I inhibitor and H2O2, a common oxidizing agent to analyze FAF1-potentiated effects on cell death. As observed in Fig 6A, FAF1 overexpression itself, induced cell death compared to control HEK cells. Furthermore, as evident in Figs 6B, C & D, FAF1 overexpression potentiated lactacystin, rotenone and H2O2-induced cell death. At basal levels, none of the PD-related stressors, other than rotenone, induced significant cell death however increased FAF1 expression significantly increased susceptibility of cultured cells to PD-related stressors. An end point cell death assay using trypan blue stain confirmed the effects of FAF1 on cell survival (Fig 6E) with or without treatment.
Fig 6. FAF1 overexpression potentiates effects of PD-related stressors.
FAF1 and vector (cont) transfected HEK cells (A, n=4) were exposed to 10µM lactacystin (B, n=4, lac) or 50nM rotenone (C, n=4, rote) or 200µM H2O2 (D, n=4, 200H) for 24hrs and cell death monitored during the 24h period. Results are expressed as percentage (of total cell death) cell death ± SEM. Total cell death is determined at the end of the assay by freezing cells and taking a final reading. * p<0.05 control cells versus FAF1 cells. Statistical significance was determined using multivariate ANOVA. FAF1 overexpression induced cell death by itself (A) and potentiated/enhanced cell death following exposure to PD- related stressors including proteasomal inhibition (B), mitochondrial complex I inhibition (C) and oxidative stress (D). (E) Trypan blue end point cell death assay. FAF1 and vector (cont) transfected HEK cells (n=3) were exposed to 10µM lactacystin (n=3) or 50nM rotenone (n=3) or 200µM H2O2 (n=3) for 24hrs. At the end of the treatment period cells were counted using the trypan blue staining protocol. Results are expressed as percentage cell death ± SEM. FAF1 overexpression induced cell death by itself and potentiated/enhanced cell death following exposure to PD- related stressors including proteasomal inhibition, mitochondrial complex I inhibition and oxidative stress. * p<0.05 control cells versus FAF1 cells. Statistical significance was determined using unpaired one-tailed t-test for comparison between control and treated groups as well as multivariate ANOVA for all groups.
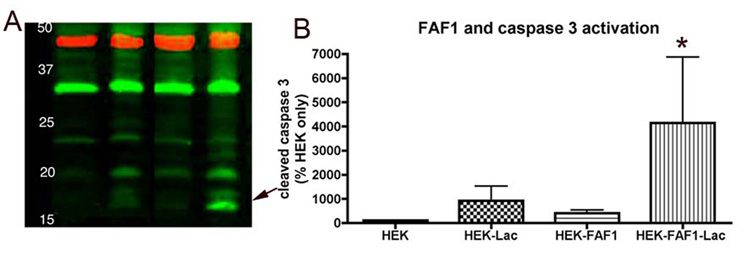
Next, FAF1’s role in apoptotic cell death was investigated. Activated or cleaved caspase 3 is a reliable and a commonly used indicator of apoptotic cell death (Fernandes-Alnemri et al., 1994; Nicholson et al., 1995) and can be detected as 17 and 19kd bands. We used immunoblotting techniques to determine if FAF1 induced caspase-3-activated cell death in HEK cells. Control and HEK cells overexpressing FAF1 were treated with either 10µM lactacystin or vehicle for 16 hrs and harvested and assayed for cleaved caspase 3. FAF1 overexpression did not by itself-induce detectable levels of activated caspase 3; however, FAF1 overexpression appeared to potentiate lactacystin-induced cell death and caspase3 activation (Fig 7). We failed to detect caspase 3 activation in FAF1 overexpressing cells treated with hydrogen peroxide and rotenone at the doses used in the present study.
Fig 7. FAF1 expression potentiates caspase 3 activation and apoptotic cell death.
FAF1 overexression by itself does not activate caspase 3 however in presence of proteasomal inhibitor lactacystin (10µm, 16hr) FAF1 can potentiate caspase 3 activation and therefore apoptotic cell death. Minimal cleaved caspase 3 (17–19kd bands) is detected in HEK cells with vector alone or with lactacystin treatment or with FAF1 overexpression. The red bands denote β-actin as a loading control. * p<0.05 control cells versus FAF1 or lactacystin-treated cells. Statistical significance was determined using multivariate ANOVA.
Discussion
Our observations demonstrate that (1) FAF1 expression levels are increased in PD-related cortical tissue and in surviving cells of the SN, (2) endogenous FAF1 expression levels are increased in cells exposed to PD related stressors, and (3) in vitro, FAF1 overexpression can initiate cell death and can markedly sensitize cells to further PD-related insults. Taken together our data suggests that FAF1 is associated with PD pathology and may have a role in PD pathogenesis.
FAF1 and PD pathology
Our initial step was to detect FAF1 expression in normal human brains and we were able to do so using both immunohistochemical and immunoblotting techniques. This is the first time that expression of FAF1 protein has been detected in human brain tissue though FAF1 mRNA has been detected in brain previously (Ryu et al., 1999). In cortical brain tissue, we were able to detect FAF1 as a predicted 74kd band (Ryu et al., 1999), using immunoblotting techniques. However, in addition we also detected a 57kd band that was specific for FAF1 as confirmed with preadsorbtion studies using specific antigenic peptides. This second band at 57kd appears to be a proteolytically cleaved product of FAF1 since we see the 57kd band in HEK 293 cells transfected with the full length FAF1 (see figure 1 and figure 5) as also reported previously (Ryu et al., 1999). Thus, as mentioned in the ‘results’ section for quantitative analysis, both FAF1-immunoreactive bands were included for intensity measurements and normalized to actin levels.
Interestingly, FAF1 levels were increased in cortical tissue from PD and AD/PD patients. In addition, qualitative analysis demonstrated that FAF1 levels were increased in surviving SN neurons with α-synuclein inclusions. These alterations in FAF1 expression levels were specific to PD-related pathology since cortical tissue from AD patients did not demonstrate elevations in FAF1 expression levels.
Endogenous FAF1 expression
Next, we demonstrated that stressors, specific to PD, including oxidative stress, mitochondrial complex I inhibition and increased A53T mutant human α- synuclein expression could significantly increase the expression levels of endogenous FAF1 indicating that endogenous FAF1 levels can be modulated by exogenous insults. Interestingly, as demonstrated in postmortem cortical tissue samples, it appears that FAF1 modulation is specific to PD-related insults since APP, a protein associated with Alzheimer’s disease pathogenesis (Offe et al., 2006; Selkoe, 2000), did not change the endogenous FAF1 expression. Thus, our data indicates that FAF1 expression levels can be specifically modulated by PD-related cellular stress.
FAF1 and cell death
To understand the significance of increased FAF1 expression in PD pathogenesis we examined the role of FAF1 overexpression in cultured cells. Our studies clearly demonstrated that FAF1 overexpression induced cell death. In addition, FAF1 overexpression could markedly aggravate the toxic effects of oxidative stress, proteasomal inhibition and mitochondrial complex I inhibition as suggested by increased cell death in response to these treatments. Further, FAF1 overexpression potentiated proteasomal inhibition-induced caspase-3 activated cell death, implicating FAF1’s role in cellular degeneration. Our data corroborated previous studies that demonstrated that FAF1 could potentiate Fas-induced apoptosis when transiently expressed in L-cells (Chu et al., 1995) as well as directly initiate cell death in BOSC23 cells without extrinsic death signal (Ryu and Kim, 2001). Taken together the data suggests that increased FAF1 expression can induce as well as potentiate cell death.
FAF1 and PD pathogenesis
Our data, using human brain samples and cultured cells, suggest that the increased FAF1 levels detected in PD cortical and nigral tissue is in response to or as a consequence of cells being under stress. Endogenous FAF1 levels were significantly and specifically elevated in cells exposed to PD-related stressors. Stressors or insults including oxidative stress (McCormack et al., 2006), mitochondrial complex I inhibition (Sherer et al., 2003; Zhu et al., 2004) and accumulation and aggregation of α-synuclein (Periquet et al., 2007; Singleton et al., 2003) are known participants in PD pathogenesis (Dawson and Dawson, 2003). Thus increased FAF1 levels found in brain tissue indicate that cells are under stress as also supported by our observation that FAF1 levels are increased in surviving SN neurons with α-synuclein aggregations and not in apparently normal neurons.
Furthermore, we demonstrate that FAF1 overexpression can both initiate and potentiate cell linkage studiesdeath. This along with increased FAF1 expression in PD neuronal tissue suggests that FAF1 could be involved in pathogenic progression of the disease – increased FAF1 expression could not only be responsible for neurodegeneration but could further exacerbate the toxic effects of genetic or environmental insults.
Finally, increased FAF1 in PD cortical tissue provides further evidence that PD pathology and symptoms progress beyond the basal ganglia into the neocortex (Braak et al., 2006), areas responsible for non-motor PD-associated symptoms including dementia and cognitive dysfunction.
Though linkage studies have identified PARK 10 locus on chromosome one with increased susceptibility for late-onset idiopathic PD (Hicks et al., 2002), the responsible gene has yet to be identified (Farrer et al., 2006). A suggestion that FAF1 could be a candidate gene comes from merging mouse transcriptome analysis with PD linkage studies by Gherbassi et al., where several classes of candidate genes for PD mutations were identified (Gherbassi et al., 2007). Thus, our study, together with previous genetic linkage analysis, suggests that FAF1 may be an integral component of progressive neurodegeneration in PD pathogenesis. Further studies will be required to better understand mechanisms of FAF1-induced cell death and neurodegeneration.
Acknowledgements
The authors would like to thank deCODE Genetics, Reykjavík, Iceland, for the kind gift of the FAF1 antibody and for discussions. This work was supported by Close to A Cure funding agency (RB) and NIEHS grants ES012068 (AIL) & ES015777 (RB).
Footnotes
Publisher's Disclaimer: This is a PDF file of an unedited manuscript that has been accepted for publication. As a service to our customers we are providing this early version of the manuscript. The manuscript will undergo copyediting, typesetting, and review of the resulting proof before it is published in its final citable form. Please note that during the production process errors may be discovered which could affect the content, and all legal disclaimers that apply to the journal pertain.
References
- 1.Abou-Sleiman PM, Muqit MM, Wood NW. Expanding insights of mitochondrial dysfunction in Parkinson's disease. Nat Rev Neurosci. 2006;7:207–219. doi: 10.1038/nrn1868. [DOI] [PubMed] [Google Scholar]
- 2.Betarbet R, Canet-Aviles RM, Sherer TB, Mastroberardino PG, McLendon C, Kim JH, Lund S, Na HM, Taylor G, Bence NF, Kopito R, Seo BB, Yagi T, Yagi A, Klinefelter G, Cookson MR, Greenamyre JT. Intersecting pathways to neurodegeneration in Parkinson's disease: Effects of the pesticide rotenone on DJ-1, alpha-synuclein, and the ubiquitin-proteasome system. Neurobiol Dis. 2006;22:404–420. doi: 10.1016/j.nbd.2005.12.003. [DOI] [PubMed] [Google Scholar]
- 3.Betarbet R, Sherer TB, MacKenzie G, Garcia-Osuna M, Panov AV, Greenamyre JT. Chronic systemic pesticide exposure reproduces features of Parkinson's disease [In Process Citation] Nat Neurosci. 2000;3:1301–1306. doi: 10.1038/81834. [DOI] [PubMed] [Google Scholar]
- 4.Braak H, Rub U, Del Tredici K. Cognitive decline correlates with neuropathological stage in Parkinson's disease. J Neurol Sci. 2006 doi: 10.1016/j.jns.2006.05.011. [DOI] [PubMed] [Google Scholar]
- 5.Chu K, Niu X, Williams LT. A Fas-associated protein factor, FAF1, potentiates Fas-mediated apoptosis. Proc Natl Acad Sci U S A. 1995;92:11894–11898. doi: 10.1073/pnas.92.25.11894. [DOI] [PMC free article] [PubMed] [Google Scholar]
- 6.Ciliax BJ, Drash GW, Staley JK, Haber S, Mobley CJ, Miller GW, Mufson EJ, Mash DC, Levey AI. Immunocytochemical localization of the dopamine transporter in human brain. J Comp Neurol. 1999;409:38–56. doi: 10.1002/(sici)1096-9861(19990621)409:1<38::aid-cne4>3.0.co;2-1. [DOI] [PubMed] [Google Scholar]
- 7.Dawson TM, Dawson VL. Molecular pathways of neurodegeneration in Parkinson's disease. Science. 2003;302:819–822. doi: 10.1126/science.1087753. [DOI] [PubMed] [Google Scholar]
- 8.Duda JE, Giasson BI, Mabon ME, Lee VM, Trojanowski JQ. Novel antibodies to synuclein show abundant striatal pathology in Lewy body diseases. Ann Neurol. 2002;52:205–210. doi: 10.1002/ana.10279. [DOI] [PubMed] [Google Scholar]
- 9.Farrer MJ, Haugarvoll K, Ross OA, Stone JT, Milkovic NM, Cobb SA, Whittle AJ, Lincoln SJ, Hulihan MM, Heckman MG, White LR, Aasly JO, Gibson JM, Gosal D, Lynch T, Wszolek ZK, Uitti RJ, Toft M. Genomewide association, Parkinson disease, and PARK10. Am J Hum Genet. 2006;78:1084–1088. doi: 10.1086/504728. author reply 1092-4. [DOI] [PMC free article] [PubMed] [Google Scholar]
- 10.Fernandes-Alnemri T, Litwack G, Alnemri ES. CPP32, a novel human apoptotic protein with homology to Caenorhabditis elegans cell death protein Ced-3 and mammalian interleukin-1 beta-converting enzyme. J Biol Chem. 1994;269:30761–30764. [PubMed] [Google Scholar]
- 11.Forno LS. The Lewy body in Parkinson's disease. Adv Neurol. 1987;45:35–43. [PubMed] [Google Scholar]
- 12.Gherbassi D, Bhatt L, Thuret S, Simon HH. Merging mouse transcriptome analyses with Parkinson's disease linkage studies. DNA Res. 2007;14:79–89. doi: 10.1093/dnares/dsm007. [DOI] [PMC free article] [PubMed] [Google Scholar]
- 13.Hicks AA, Petursson H, Jonsson T, Stefansson H, Johannsdottir HS, Sainz J, Frigge ML, Kong A, Gulcher JR, Stefansson K, Sveinbjornsdottir S. A susceptibility gene for late-onset idiopathic Parkinson's disease. Ann Neurol. 2002;52:549–555. doi: 10.1002/ana.10324. [DOI] [PubMed] [Google Scholar]
- 14.Hornykiewicz O. Dopamine miracle: from brain homogenate to dopamine replacement. Mov Disord. 2002;17:501–508. doi: 10.1002/mds.10115. [DOI] [PubMed] [Google Scholar]
- 15.Klockgether T. Parkinson's disease: clinical aspects. Cell Tissue Res. 2004;318:115–120. doi: 10.1007/s00441-004-0975-6. [DOI] [PubMed] [Google Scholar]
- 16.McCormack AL, Atienza JG, Langston JW, Di Monte DA. Decreased susceptibility to oxidative stress underlies the resistance of specific dopaminergic cell populations to paraquat-induced degeneration. Neuroscience. 2006;141:929–937. doi: 10.1016/j.neuroscience.2006.03.069. [DOI] [PubMed] [Google Scholar]
- 17.Miller GW, Staley JK, Heilman CJ, Perez JT, Mash DC, Rye DB, Levey AI. Immunochemical analysis of dopamine transporter protein in Parkinson's disease. Ann Neurol. 1997;41:530–539. doi: 10.1002/ana.410410417. [DOI] [PubMed] [Google Scholar]
- 18.Mirra SS, Heyman A, McKeel D, Sumi SM, Crain BJ, Brownlee LM, Vogel FS, Hughes JP, van Belle G, Berg L. The Consortium to Establish a Registry for Alzheimer's Disease (CERAD). Part II. Standardization of the neuropathologic assessment of Alzheimer's disease. Neurology. 1991;41:479–486. doi: 10.1212/wnl.41.4.479. [DOI] [PubMed] [Google Scholar]
- 19.Nagata S. Apoptosis by death factor. Cell. 1997;88:355–365. doi: 10.1016/s0092-8674(00)81874-7. [DOI] [PubMed] [Google Scholar]
- 20.Nicholson DW, Ali A, Thornberry NA, Vaillancourt JP, Ding CK, Gallant M, Gareau Y, Griffin PR, Labelle M, Lazebnik YA, et al. Identification and inhibition of the ICE/CED-3 protease necessary for mammalian apoptosis. Nature. 1995;376:37–43. doi: 10.1038/376037a0. [DOI] [PubMed] [Google Scholar]
- 21.Offe K, Dodson SE, Shoemaker JT, Fritz JJ, Gearing M, Levey AI, Lah JJ. The lipoprotein receptor LR11 regulates amyloid beta production and amyloid precursor protein traffic in endosomal compartments. J Neurosci. 2006;26:1596–1603. doi: 10.1523/JNEUROSCI.4946-05.2006. [DOI] [PMC free article] [PubMed] [Google Scholar]
- 22.Periquet M, Fulga T, Myllykangas L, Schlossmacher MG, Feany MB. Aggregated alpha-synuclein mediates dopaminergic neurotoxicity in vivo. J Neurosci. 2007;27:3338–3346. doi: 10.1523/JNEUROSCI.0285-07.2007. [DOI] [PMC free article] [PubMed] [Google Scholar]
- 23.Ryu SW, Chae SK, Lee KJ, Kim E. Identification and characterization of human Fas associated factor 1, hFAF1. Biochem Biophys Res Commun. 1999;262:388–394. doi: 10.1006/bbrc.1999.1217. [DOI] [PubMed] [Google Scholar]
- 24.Ryu SW, Kim E. Apoptosis induced by human Fas-associated factor 1, hFAF1, requires its ubiquitin homologous domain, but not the Fas-binding domain. Biochem Biophys Res Commun. 2001;286:1027–1032. doi: 10.1006/bbrc.2001.5505. [DOI] [PubMed] [Google Scholar]
- 25.Selkoe DJ. Toward a comprehensive theory for Alzheimer's disease. Hypothesis: Alzheimer's disease is caused by the cerebral accumulation and cytotoxicity of amyloid beta-protein. Ann N Y Acad Sci. 2000;924:17–25. doi: 10.1111/j.1749-6632.2000.tb05554.x. [DOI] [PubMed] [Google Scholar]
- 26.Sherer TB, Betarbet R, Testa CM, Seo BB, Richardson JR, Kim JH, Miller GW, Yagi T, Matsuno-Yagi A, Greenamyre JT. Mechanism of toxicity in rotenone models of Parkinson's disease. J Neurosci. 2003;23:10756–10764. doi: 10.1523/JNEUROSCI.23-34-10756.2003. [DOI] [PMC free article] [PubMed] [Google Scholar]
- 27.Singleton AB, Farrer M, Johnson J, Singleton A, Hague S, Kachergus J, Hulihan M, Peuralinna T, Dutra A, Nussbaum R, Lincoln S, Crawley A, Hanson M, Maraganore D, Adler C, Cookson MR, Muenter M, Baptista M, Miller D, Blancato J, Hardy J, Gwinn-Hardy K. {alpha}-Synuclein Locus Triplication Causes Parkinson's Disease. Science. 2003;302:841. doi: 10.1126/science.1090278. [DOI] [PubMed] [Google Scholar]
- 28.Vila M, Przedborski S. Targeting programmed cell death in neurodegenerative diseases. Nat Rev Neurosci. 2003;4:365–375. doi: 10.1038/nrn1100. [DOI] [PubMed] [Google Scholar]
- 29.Zhu C, Vourc'h P, Fernagut PO, Fleming SM, Lacan S, Dicarlo CD, Seaman RL, Chesselet MF. Variable effects of chronic subcutaneous administration of rotenone on striatal histology. J Comp Neurol. 2004;478:418–426. doi: 10.1002/cne.20305. [DOI] [PubMed] [Google Scholar]


