

Synopsis
Proton magnetic resonance spectroscopy (1H-MRS) provides tissue metabolic information in vivo. This article reviews the role of MRS-determined metabolic alterations in lesions, normal appearing white matter, gray matter, and spinal cord in advancing our knowledge of pathological changes in multiple sclerosis (MS). In addition, the role of MRS in objectively evaluating therapeutic efficacy is reviewed. This potential metabolic information makes MRS a unique tool to follow MS disease evolution, understanding its pathogenesis, evaluating the disease severity, establishing a prognosis, and objectively evaluating the efficacy of therapeutic interventions.
Keywords: proton magnetic resonance spectroscopy, multiple sclerosis, brain metabolites
Introduction
Conventional magnetic resonance imaging (cMRI) is exquisitely sensitive in visualizing multiple sclerosis (MS) lesions in brain and spinal cord, but has limited pathologic specificity. Also, cMRI is limited in the detection of subtle, disease-related changes in the normal-appearing white matter (NAWM)1. This limitation can be overcome to some extent by combining MRI with magnetic resonance spectroscopy (1H-MRS) which allows detection of tissue biochemical changes for improved pathologic specificity. Since biochemical changes precede anatomical changes, MRS detects tissue pathologic changes even before the appearance of lesions on cMRI2. The unique biochemical information provided by 1H-MRS also complements the information from advanced MRI techniques such as magnetization transfer (MT) and diffusion tensor (DT) MRI in providing a more detailed and specific pathological information. This in turn allows to follow MS disease evolution, better understand its pathogenesis, evaluate the disease severity, establish a prognosis, and objectively evaluate the efficacy of therapeutic interventions3-5.
This review is divided into three major sections: 1) brief introduction to MRS, 2) review of MRS and its application to MS lesions, NAWM, gray matter, and spinal cord, and 3) role of MRS in clinical trials. Because of the large number of publications on MRS in MS, wherever possible, we have referenced more recent and relevant review articles.
Magnetic Resonance Spectroscopy
In contrast to MRI, which mainly relies on proton (1H), MRS can be performed using variety of nuclei. Of all these nuclei, 1H and 31P are most commonly employed for MRS studies. For a number of reasons that include sensitivity and hardware considerations, 1H-MRS is the common choice for investigating neurological disorders. 1H-MRS provides access to a large number of biomolecules or metabolites such as N-acetylaspartate (NAA; some authors refer to it as NA to acknowledge that the NAA peak has contributions from N-acetylaspartate and other N-acetyl moieties such as N-acetyl aspartyl glutamate [NAAG]. In this review NA and NAA are used interchangeably), choline (Cho), creatine (Cr), myoinositol (mI), glutamate (Glu) and glutamine (Gln), macromolecules, lipids and lactate (Lac). The positions of metabolite peaks in the spectrum, expressed as parts per million (ppm), are independent of the magnetic field strength. NAA is an amino acid derivative synthesized in neurons and transported down axons and its main resonance appears at 2.02 ppm. NAA is generally thought to be a specific marker of neurons, axons, and dendrites6. On this basis, reduced NAA concentration is generally interpreted as neuronal/axonal dysfunction and/or loss. This has been confirmed by 1H-MRS and histology studies on biopsied samples7. In general, Glu and Gln are not resolved well even at 3.0 T and combination of resonances from these two is commonly referred to as Glx. The resonances from Glx appear between 2.1 and 2.4 ppm. While some studies have focused on the evaluation of the total Glu and Gln levels under pathological conditions, other studies have employed spectral editing methods to resolve the Glu resonance. Recently Hurd et al.8 have used a modified conventional spectral localization technique in which data is collected over multiple echo times (TE). This method detects a single-line Glu resonance at 2.35 ppm. Srinivasan et al.9 have shown elevated Glu concentrations in acute lesions (P = 0.02) and NAWM (P = 0.03), with no significant elevation in chronic lesions (P = 0.77) in MS patients compared to normal subjects. The primary resonance of Cr occurs at 3.0 ppm and has contributions both from creatine and phosphocreatine. Elevated Cr levels may represent gliosis7. Cho signals at 3.2 ppm have contributions from multiple molecules that include phosphorylcholine, glycerophosphorylcholine, and choline plasmalogen and a very minor contribution from acetylcholine and choline10. Cho peak appears to reflect cell-membrane metabolism3. Also, elevated Cho concentration represents heightened cell-membrane turnover as seen in demyelination, remyelination, inflammation and gliosis in MS patients3. mI exhibits two resonances, at 3.5 ppm and 4.06 ppm. Due to its proximity to tissue water resonance, the amplitude of the 4.06-ppm peak is affected by the degree of water suppression and is not considered to be a reliable indicator of mI concentration. Brain osmolyte mI appears to be glia specific and it is not found in neurons11. Also, mI is a precursor of phospholipid membrane constituents, and its concentration is affected by the formation and breakdown of myelin. Lac is generally seen as a doublet that resonates at 1.33 ppm. It is the end product of anaerobic glycolysis and is not commonly observed in normal brain. It is increased in acute MS lesions and is related to macrophage activation after membrane breakdown. Lipids along with macromolecules (referred to as lipids for brevity) appear as broad peaks and resonate between 0.8 and 1.5 ppm. In healthy tissues, there should be very weak lipid peaks in the spectrum unless contaminated by subcutaneous fat from non-neural tissues. These peaks have been reported in MS and thought to represent demyelination/remyelination2. By measuring the concentration changes in brain metabolites, MRS has provided evidence of early pathology and myelin damage/repair in MS that is not evident on cMRI12, 13.
Acquisition
1H-MRS can be acquired with spatial information preserved (localized 1H-MRS), as is most commonly done, or obtain from the whole brain by sacrificing spatial information14. Point resolved spectroscopy (PRESS)15 and stimulated echo acquisition mode (STEAM)16 are the two most commonly used localization techniques in 1H-MRS. Spectral contamination from extrameningeal tissues is minimized by suppressing the signals from the outer volume17. Figure 1 demonstrates the placement of eight outer volume suppression bands. The PRESS localization provides better signal-to-noise ratio (SNR) compared to STEAM technique. However, STEAM allows shorterTE- than PRESS.
Figure 1.
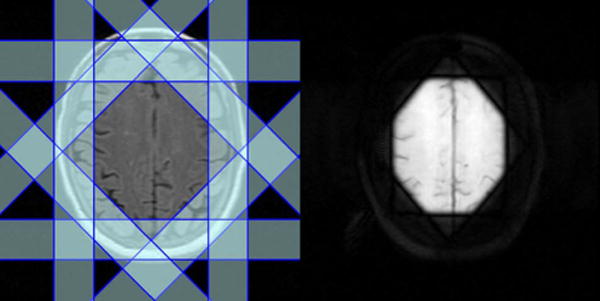
Application of outer volume suppression bands to minimize extrameningeal tissue contamination. Left: Eight outer volume suppression bands on one of the five images (each, 3 mm thickness) that represent the spectroscopic volume of interest (15 mm thickness); right: localized image(15 mm slice thickness with the application of the suppression bands) from which 1H-MRSI is acquired.
Localized 1H-MRS is acquired in either a single voxel or multi-voxel mode. In single voxel MRS, spectral data are acquired from one location at a time. The volume of this region is typically 1 to 8 cm3. This approach involves shorter acquisition and processing times. High-quality spectrum is relatively easy to acquire in this mode. Multi-voxel mode, also referred to as 1H-MRS imaging (1H-MRSI) or chemical shift imaging (CSI) allows simultaneous acquisition of 1H-MRS data from multiple voxels and allows mapping regional distribution of metabolite concentrations and generate metabolic images. Multi-voxel MRS can be acquired in 2D or 3D and generally offers superior spatial resolution (< 1 cm3) compared to single voxel. Generally, 1H-MRSI is acquired from a volume that is prelocalized using either PRESS or STEAM. It is also possible to acquire 1H-MRSI without any prior volume or slab localization (see, for example, Sharma et al.18). 1H-MRSI involves relatively long acquisition times, which, however, can be considerably shortened by reduced k-space encoding19. One way of accelerating 1H-MRSI acquisition is to employ fast spectral-spatial encoding by using echo-planar-based techniques20,21. With multi-slice and multi echo sequences, it is possible to acquire spectra from whole brain21 within reasonable scan times. Combining EPI-based techniques with recent advances in parallel MRI, such as sensitivity encoding (SENSE)22 or generalized autocalibrating partially parallel acquisitions (GRAPPA)23 with radiofrequency (RF) coil arrays can further accelerate 1H-MRSI data acquisition24-26. However, the data acquired with these approaches generally suffers from reduced SNR. Determination of absolute metabolite concentration is also somewhat problematic with parallel acquisition schemes.
1H-MRS can be acquired at either long or short TE. Long TE 1H-MRS provides a well-defined baseline by suppressing peaks arising from short T2 metabolites, such as lipids and macromolecules, and makes spectral quantification simpler and more robust. Long TE 1H-MRS may be preferable if the interest is in the detection of the three major resonances: NAA, Cr, and Cho. Because of their relatively short T2 relaxation times, signals from metabolites, such as Glx, lipids, macromolecules and other myelin breakdown products can be detected only at short TE. Even though the broad spectral baseline in short TE 1H-MRS makes the spectral quantification more difficult, this approach has the potential to provide important information about altered tissue biochemistry that may not be available at long TE4. There is an increasing interest in short TE 1H-MRSI for visualizing short T2 metabolites, which should result in improved pathological characterization of tissues3. As an example, single voxel spectra acquired at 3 T with short and long TE, with signal mostly localized to white matter of normal brain, are shown in Figure 2.
Figure 2.

Single voxel spectra with short TE (=35 msec) and long TE (=144 msec) acquired from white matter region of a normal brain at 3.0 Tesla. The large number of metabolite peaks with broad baseline can be observed in the short TE spectrum (top). In contrast, long TE spectrum (bottom) has relatively flat baseline and fewer metabolite peaks. See text for abbreviations
The macromolecular and lipid resonances exhibit significant overlap with the other metabolites. By nulling the metabolite resonances with an inversion recovery sequence, it is possible to improve the detection of these short TE resonances. This method was employed by Mader et al. 27 for separating lipids from other metabolites in acute MS lesions.
While localized techniques can be used to acquire spectrum from the volume of interest (VOI), non-localized sequence can provide MRS from the entire head. The strong broad lipid signals arising from non-brain tissues obscure the resonances from other metabolites. However, by subtracting the data acquired with and without NAA nulling (through an inversion recovery sequence), it is possible to remove/minimize strong lipid signals and visualize resonances from other metabolites14. Because NAA is restricted to neurons/axons, it is implicitly localized to brain. However, the presence of other resonances in non-brain tissues, compromises the quantification of metabolites such as Cr. Thus this approach is reliable only when quantifying the whole brain NAA (WBNAA) concentration14. Due to severe magnetic field inhomogeneities present at air-tissue interfaces this technique captures about 90% of the NAA signal intensity in the brain28. Albeit WBNAA measurements do not provide any information about the spatial distribution of metabolite concentrations, this approach eliminates image registration problems from scan-to-scan in serial studies. The reproducibility of WBNAA levels across institutions and MR scanners and field strengths has been shown to be satisfactory29. WBNAA measurements can be used to quantify the global neuronal and axonal injury to monitor the effect of neuroprotective agents in MS 30.
Quantification
The inherently quantitative nature of MRS allows objective monitoring of disease state and response to therapeutic intervention. However, this requires accurate spectral quantification. Expressing the metabolite levels as a ratio relative to Cr is one of the most common and simplest ways of spectral quantification. However, the interpretation of the metabolite ratios becomes equivocal if the concentration of Cr varies with pathology2. In addition, representing brain metabolite concentrations as ratios does not provide complete information and could lead to significant errors31, 32. Therefore absolute quantification of metabolite concentrations is highly desirable for proper interpretation of the MRS data. Nevertheless the NAA/Cr ratio is commonly used in MS 33. Among the methods for estimating the absolute metabolite concentrations, use of internal water as a standard has been shown to provide acceptable accuracy and inter-laboratory reproducibility2, 34. However, this method depends on knowledge of water distribution and relaxation times in different tissues. Absolute concentrations can also be measured using the LCModel.35 This method analyzes the in vivo spectrum as a linear combination of spectra from individual metabolites contained in a solution (model spectrum). The model spectrum is acquired using the same sequence as that used for in vivo spectra and provides the maximum prior knowledge for the spectral analysis. LCModel uses a nearly model-free constrained regularization method that automatically accounts for the fitted baseline and spectral lineshape to be consistent with the data36.
Usually, the 1H-MRSI quantification procedures involve extensive computational time, and in some cases, significant human intervention. Currently, the most commonly used quantification methods are based on line fitting using a non linear least square optimization, such as the Levenberg-Marquardt algorithm35, 37-39. The relatively long computational time becomes even more problematic when considering 3D 1H-MRSI and scans from multi-center clinical trials where a large amount of data needs to be processed. For 1H-MRSI to become a routine clinical tool, complete automation of quantification procedures and reduction of processing times close to real-time are necessary. The processing time could be reduced by using high performance computing environment. However, this is expensive, involves development of complicated algorithms, and is not an option in routine laboratory/clinical settings. Another approach is to develop fast methods, such as those based on artificial neural networks (ANN). ANN has been used to develop automated methods to quantify 1H-MRS data40, 41. However, these techniques are limited to either single voxel 1H-MRS or magnitude spectral data acquired at long TE using lineshapes that may not be completely appropriate42. Recently, Bhat et al.43 have employed radial basis function neural networks (RBFNN) to demonstrate the feasibility of quantifying short TE, phased 1H-MRSI. This method is, however, limited to ratios, and thus does not allow absolute concentrations to be measured.
A number of excellent software packages, both free and commercial, are available for spectral quantification. The most commonly used analysis packages include LCModel 35, jMRUI 44, and MIDAS 45. Most of these packages involve minimal human intervention and are capable of providing absolute concentrations, but involve long processing times. Different analysis methods and their strengths and weaknesses in computing absolute brain metabolite concentrations were recently reviewed 31.
Due to relatively large spectroscopic voxels, spectra have contributions from different types of brain tissues, particularly cerebrospinal fluid (CSF). For accurate estimation of metabolite concentrations, it is important to determine the relative volumes of each tissue that contributes to a given spectroscopic voxel. This requires combining the MRSI data with tissue segmentation, based on the high resolution MRI data37.
Application of MRS to MS
Lesions
There is a general consensus that chronic MS lesions exhibit reduced NAA levels, indicating neuronal/axonal loss. This is particularly true in those lesions that also appear hypointense on T1-weighted images (also commonly referred to as “black holes”46). In one study, metabolite concentrations from chronic lesions of patients with relapsing-remitting (RR)MS (n=9), secondary progressive (SP)MS (n=10), primary progressive (PP)MS (n=6), and benign MS (BMS) (n=5) were measured and compared with those from white matter of a normal control group (n=9)47. A highly significant reduction in NA (the sum of NAA and NAAG) was found in RRMS, PPMS, and SPMS patients compared to controls. However, in patients with BMS there was no significant difference in NA compared to controls. A significant inverse correlation between NA from lesions in MS patients and disability was observed (r=-0.364, 0.05>P>0.02)47. Increased Cr and Cho levels were also observed in lesions, suggesting (a) ongoing gliosis and remyelination in isointense lesions on T1-weighted MR images and (b) membrane turnover (de- and remyelination) 48.
Acute MS lesions, as detected by gadolinium (Gd) enhancement, demonstrate a range of abnormalities on 1H-MRS. These abnormalities include reduced NAA, increased Cho, and presence of lipids2, 49-52. Histopathology on biopsied brain tissues demonstrates reduced NAA levels even in the acute phase of the disease53. This could be the result of axonal loss or reflect reversible axonal dysfunction due to functional impairment52, 54-56. Accordingly, serial MRI (with Gd administration) and 1H-MRSI studies showed transient changes in NAA levels in some acute lesions, which recovered with time2. Narayana et al.2 have observed that metabolite levels, including NAA, reach their minimum value when lesion volume reaches its maximum. This suggests that the observed decrease in metabolite concentrations, at least partially, can be attributed to resolution of edema within the lesions and is not solely due to compromised tissue metabolism. Cho levels are shown to increase in acute MS lesions2, 51, 57, as well as Lac and mI resonance intensities 52, 58. The presence of lipids in some, but not all lesions was reported in RRMS subjects by Narayana et al.2, suggesting the presence of active demyelination/remyelination.
Normal Appearing White Matter
It is now generally agreed, based on MRS3, 12, MT59, and DT60 studies that the NAWM in patients with MS is abnormal. By exploiting the large spatial coverage allowed by multi-voxel 1H-MRS, it has been demonstrated that metabolic abnormalities in MS patients are more diffuse and are not restricted to lesion sites alone2, 37, 48, 61-64. 1H-MRS studies have clearly demonstrated reduced NAA levels in NAWM, suggesting axonal/neuronal loss/dysfunction as the underlying pathologic substrate. The reduced NAA levels on 1H-MRS have been confirmed by histopathology as secondary to axonal loss7, 65. In serial 1H-MRS studies, increased Cho and lipid levels were observed from NAWM regions that subsequently went on to develop MRI-visible lesions2, 66. These observations were consistent with MRI studies that showed alterations in MT ratio (MTR) values prior to appearance of macroscopic lesions on MRI67. In addition, based on increased mI68, Cr and Cho levels, increased cellularity (gliosis, inflammation) was also postulated to occur in NAWM of MS patients48.
In a preliminary study, annual MRSI was obtained for two years from 20 patients and 10 healthy controls to characterize the metabolite changes in early RRMS69. The concentrations of NAA, Cr, Cho, mI and Glx were estimated in both NAWM and cortical gray matter (cGM). At baseline, the concentration of NAA was 7% lower in NAWM of MS patients compared to the control group and 8.7% lower in cGM. Tissue metabolite profiles did not significantly change in MS subjects nor differed between MS and healthy controls, with the exception of NAA concentrations that tended to recover from baseline. This study suggests that in the early phases of the disease the neuronal/axonal damage may be at least partially reversible. Leary et al.70 have performed single voxel 1H-MRS of NAWM in PPMS (n=24) patients and in 16 age-matched controls. NAA/Cr was significantly lower in NAWM from patients than in the white matter from controls suggesting that axonal loss occurs in NAWM in PPMS patients and may well be a factor associated with disease progression in this disease phenotype. No significant difference was observed in Cr concentration between patients and controls. A multi-center 1H-MRSI study of 40 PPMS patients showed significantly lower NAA/Cr compared with healthy volunteers, but no significant difference between lesions and NAWM was observed33. Twenty four of these patients had evident lipid peaks in non-lesion brain tissue locations. Figure 3 shows, as an example, the presence of strong lipid peaks in the spectra from NAWM of a PPMS patient. In another study, metabolite concentrations were obtained with 3D MRS and the VOI centered on the corpus callosum in 11 RRMS patients and nine controls71. In NAWM, the concentration of NAA was observed to be 9% lower in patients compared to controls. The same study showed an increase in Cr and Cho by 22% and 32%, respectively. These elevated Cho levels differentiated patients from controls with 100% specificity and higher than 90% sensitivity.
Figure 3.
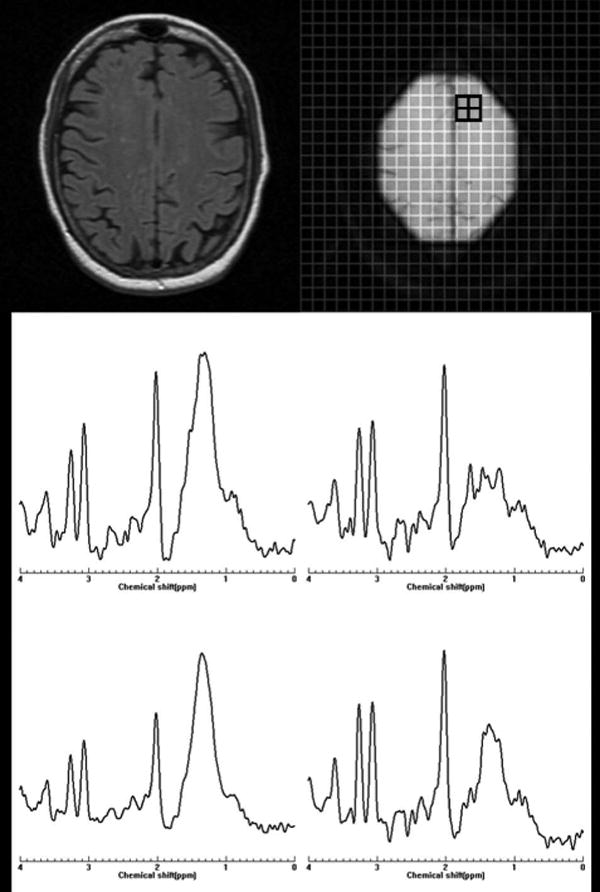
Abnormal peaks in normal-appearing white matter of a patient with primary progressive multiple sclerosis. Top: Left: One of the five MR images (each 3 mm thick) of the cross-section of the brain location from where the 1H-MRSI data acquired. Right: Collapsed image representing the spectroscopic volume of interest (thickness=15 mm). The small grid on the collapsed image represents the spatial location shown in the bottom panel. Strong lipid peaks can be observed in these spectra. The spectra were acquired at TE of 30 ms.
Suhy et al.72 compared metabolite levels in PPMS (n=15) and RRMS (n=13) patients with those of controls (n=20). Cr in NAWM of PPMS patients was higher compared to controls (P=0.035), and RRMS patients (P=0.038). Also, Cr increased in focal MRI lesions from PPMS compared to lesions from RRMS (P=0.044) and compared to control white matter (P=0.041). NAA was similarly reduced in NAWM from PPMS and RRMS compared to controls. The increased Cr in NAWM in PPMS relative to RRMS is consistent with the notion that the progressive disability in PPMS may be associated with gliosis and axonal loss, whereas disability in RRMS may be secondary to an increased burden of acute inflammatory lesions and axonal loss72.
Data on NAWM in clinically isolated syndrome (CIS) is limited. In 14 of 42 patients with a single acute episode of optic neuritis, Tourbah et al.73 reported decreased NAA, increased Cho, and the presence of lipids. In 96 patients with CIS suggestive of MS, Fernando et al.74 reported increased concentration of mI relative to controls, a finding which is suggestive for the presence of gliosis. No significant difference in other metabolites was observed. In a prospective study on patients with CIS suggestive of MS, Wattjes et al.75, 76 studied 31 patients and 20 controls. These authors observed 8.1% decrease in NAA (P= 0.012) in the NAWM of patients relative to controls. However, changes in Cr, Cho, and mI were not observed.
Gray Matter
Cortical pathology in MS is well recognized77, 78. For a number of reasons GM lesions are difficult to visualize on MRI. Using advanced pulse sequences, such as double inversion recovery 79, 80 and phase sensitive inversion recovery sequence, it is possible to display some, but not all, cortical lesions 81, 82. Involvement of GM has been demonstrated by MTR83, DTI84, 85, and 1H-MRS studies18, 68, 86, 87.
1H-MRS of cGM is technically challenging because of its proximity to CSF and partial volume averaging from white matter88. In addition, many of the MRS studies that employ outer volume suppression bands for minimizing contributions from non-neural tissues make it difficult to acquire MRS from the cGM that is close to outer surface of the brain (see Figure 1). In spite of these limitations, MRS studies of cGM have been reported by a few groups. For example, Sharma et al.18, by combining a double inversion recovery sequence, in which both CSF and white matter were suppressed, demonstrated abnormalities in the cGM close to the midline fissure in MS patients using MRSI. By combining MRSI with image segmentation, this study has minimized contributions from WM and CSF to the VOI and showed in 52 RRMS patients marked lipid peaks arising from the normal appearing GM, consistent with the presence of active demyelination/remyelination. However, no significant changes in major metabolite concentrations were observed compared to controls, suggesting no significant neuronal loss. The lack of significant changes of metabolites in cGM is consistent with another more recent report89.
Using short TE MRSI in 16 RRMS patients with short disease duration (mean disease duration of 1.8 years; range 0.6-2.8 years), Kapellar et al.86 reported lower NAA (P = 0.01) and mI (P = 0.04) in the cGM relative to controls. The reduced NAA in cGM suggested mild, but widespread, neuronal dysfunction or loss early on in the course of the disease86. In another study from the same group of 24 clinically early (median EDSS (Expanded Disability Status Scale) 1.2; range 0.0-3.0) RRMS patients, Chard et al.68 reported significantly reduced NAA, Cho, and Glx. They also observed significant correlations between MS functional composite scores and the metabolite concentrations in cGM: Cr (r(s) = 0.524, P = 0.009), cGM Glx (r(s) = 0.580, P = 0.003). However, no correlation was observed between clinical disability and the level of NAA, suggesting that reduced NAA reflects neuronal dysfunction, rather than neuronal loss early on in RRMS.
GM NAA deficits were found in the progressive form of disease, which, however, did not significantly correlate with EDSS90. In another study, absolute concentrations of NAA, Cr, and Cho were measured in the occipital-parietal cortex of RRMS (n=15) and SPMS (n=15) patients and healthy subjects (n=8)91. Significantly lower values of NAA, Cr and NAA/Cr ratio were detected in SPMS patients than in RRMS and control subjects (P<0.01), suggesting that the pathological process in MS extends into cGM, particularly in the progressive form of the disease. Similar observations were reported in a more recent study on a small MS cohort87.
The levels of metabolites in the very early stage of the disease appear to be dependent on lesion activity. In CIS suggestive of MS, Au Duong et al.88 reported that the metabolite levels in GM are associated with the presence of enhancing lesions: when absent, there was no statistically significant difference in the GM metabolite levels between patients and controls; when present, a relative decrease in NAA level and an increase in Cho level were observed. This suggests that metabolite alterations seen in the GM in the early phase of the disease may be secondary to the inflammatory process, rather than to ‘primary’ neuronal dysfunction.
MS also affects deep GM structures92, 93. 1H-MRS studies of the thalami were performed in RRMS (n=14) patients and age-matched healthy controls (n=14). Average NAA concentration in the thalami of RRMS patients was approximately 11% lower relative to controls (p<0.05). In addition, about 25% lower mean normalized thalamic volumes was observed in patients compared to controls (p<0.005). Decreases in thalamic NAA concentrations strongly correlated with thalamic volume loss94. The reduction of both NAA concentration and thalamic volume suggests a neurodegenerative component to MS that is increasingly recognized in the disease 95.
Whole brain NAA
Recently, WBNAA as a marker of overall axonal/neuronal loss in the brain has been proposed96. The concentration levels of WBNAA and normalized brain volumes were significantly lower in PPMS patients than in healthy controls97. Also, WBNAA values and normalized brain volumes were not related suggesting that MRS and atrophy assessment may provide complementary information about the extent of brain damage in PPMS. Axonal/neuronal damage in PPMS patients seems to occur, at least partially, independent of the burden of MRI-visible lesions97. In another study, WBNAA levels were compared with atrophy as a function of disease duration in a cohort of 42 RRMS patients. WBNAA levels were found to decrease 3.6 times faster than atrophy, suggesting that neuronal/axonal dysfunction precedes atrophy98, and that WBNAA may be a more sensitive indicator of disease progression than lesion load or atrophy.
Although axonal pathology has been known to occur in MS, it is less clear how early in the course of disease axonal damage starts to appear, as well as its relation to MRI-visible lesion load. To assess this early axonal pathology, Filippi et al.99 estimated the WBNAA levels in 31 patients with CIS suggestive of MS. The mean WBNAA concentration was significantly lower in patients compared with the controls. It was not significantly different between patients with and without enhancing lesions at baseline MRI or between patients with and without lesion dissemination in time. WBNAA concentrations and lesion volumes were not correlated. These findings, consistent with both histology and localized 1H-MRS studies, suggest the presence of widespread axonal pathology in the earliest clinically symptomatic stage of MS.
Spinal Cord
Involvement of spinal cord in MS and its potential role in patient disability has been recognized for some time100, 101. Post-mortem examination of MS patients reported substantial atrophy and axonal loss in the lateral columns at C3 and T2102. However, cord atrophy and total axonal number are not strongly correlated103, suggesting that cord atrophy may underestimate axonal loss and may not provide a valid marker of disease progression104. 1H-MRS may provide valuable information about true axonal damage in spinal cord in MS patients. In vivo 1H-MRS of spinal cord is quite challenging due to magnetic field inhomogeneities around the cord, physiological movements, and small cross sectional size. Therefore, it is not surprising that relatively few 1H-MRS studies of the spinal cord have been performed. However, Marliani et al.105 demonstrated the feasibility of performing quantitative MRS in the cervical region on a clinical 3 T system.
1H-MRS of normal appearing spinal cord in MS patients showed significantly reduced NAA and altered concentration levels of other metabolites compared to healthy controls106. In one study, MRS was used to investigate the degree of neuronal damage in the cervical cord in MS patients. Spectra were acquired from spinal cord and brain in 11 patients and 11 controls. A 32% reduction of NAA concentration was observed in patients relative to controls (P < 0.05), indicating significant neuronal/axonal injury. Additionally, significant cord atrophy was observed in MS patients (15%, P < 0.001). No correlations between clinical measures and cord atrophy or brain lesion volume were found; however, spinal cord NAA correlated with the cerebellar subscore of the EDSS (P < 0.005). 1H-MRS demonstrated cellular damage within the cord over and above the tissue atrophy seen on MRI104.
In another study, Ciccarelli et al.107 acquired single-voxel 1H-MRS from the cervical cord of 14 patients with at least one lesion between C1 and C3. Thirteen age- and sex-matched control subjects were included in the study. Patients showed reduced NAA relative to controls. In patients, significant correlations between (i) EDSS and mI, Cho, Cr, and (ii) 9-hole peg test (9-HPT) and Cr were observed. The concentration of mI was independently associated with the EDSS, while Cr, NAA were independently associated with the 9-HPT. While the limited 1H-MRS studies on cervical cord have provided useful information about tissue damage, the full potential of 1H-MRS in spinal cord in MS patients has yet to be exploited.
Evaluation of Treatment Efficacy
Immunomodulatory therapies, including glatiramer acetate (GA), interferon (IFN)-β, and natalizumab, are shown to be effective in reducing MRI-measured disease activity108-111. Because of its inherent quantitative nature, MRS is ideally suited for evaluating the efficacy of treatment. The effect of immunomodulatory treatments on brain metabolites for evaluating treatment efficacy was studied in multiple, but small patient groups. In an open-label, non-randomized pilot study of GA treatment in 15 RRMS patients, Narayanan et al.112 measured NAA/Cr in a large VOI centered in the corpus callosum prior to treatment and one year after. The untreated and treated groups had similar mean baseline NAA/Cr and EDSS. At one year, the GA-treated group showed no change in the NAA/Cr ratio. However, the untreated group had a small (3.5%) but significant (p=0.015) reduction in NAA/Cr. During this short period of treatment, GA was shown to stabilize the levels of brain NAA which is consistent with the putative neuroprotective effect of the drug, GA.
In another pilot study, Khan et al.109 obtained 1H-MRS from 18 RRMS patients before and after treatment with GA. These patients were followed annually for two years. A small group of four treatment naïve RRMS patients was also studied. 1H-MRSI was acquired from a large VOI that contained both corpus callosum and adjacent white matter. The VOI included both lesions and NAWM. The mean NAA/Cr was measured from the whole VOI and NAWM. After two years, NAA/Cr in the GA treated group increased significantly (10.7%) in the VOI, and by 7.1% in the NAWM. In the untreated group, NAA/Cr decreased by 8.9% at two years in the VOI and 8.2% in the NAWM. This study showed that treatment with GA may lead to axonal metabolic recovery and protection from sub-lethal axonal injury in RRMS patients. Long term results of this ongoing study after 4 years of annual brain MRS examinations were reported recently113. Compared to baseline, at year 4, patients receiving continuous GA therapy showed an overall increase of 12.7% in NAA/Cr (P = 0.03) within the entire VOI and by 9.6% (P = 0.04) in the NAWM. Three patients in the control group who began therapy with GA during the course of the study showed similar increases in NAA/Cr after the first year of therapy. These data support the notion of a possible sustained effect of GA in RRMS and the feasibility of employing MRS in long-term investigative studies of MS113.
In a multi-center longitudinal MRSI study, the efficacy of GA treatment in 58 PPMS patients was investigated annually for three years114. This patient population was a subcohort of the PROMiSe trial patients115. Quantitative NAA/Cr and Cho/Cr were compared between GA-treated and placebo-treated PPMS patients. This study failed to demonstrate a significant effect of GA on the metabolite concentrations. There were no significant changes in metabolite concentrations in untreated PPMS patients over three years. These findings are different from those in RRMS described above and may suggest that substantive decreases in NAA/Cr may have occurred at an earlier stage of disease in PPMS and treatment with GA may not result in improvement of the metabolite profile114.
Longitudinal MRS studies have been carried out in 10 RRMS patients who, after baseline examination, received interferon β-1b. Spectra were acquired up to 34 months at different time points (from 8-20 time points), and absolute concentrations of NAA, Cr, and Cho were determined in a large non-enhancing lesion and contralateral NAWM116. The concentrations of Cho and Cr were found to be higher in MS than in healthy controls 116. These studies, except in one out of 10 patients, failed to demonstrate any effect of interferon β-1b on the metabolic levels.
1H-MRS has also been used to investigate the modifications of brain metabolites, in the initial phase of interferon β-1a treatment117. This study was performed on 5 RRMS patients who were treated with intramuscular IFN β-1a for six months and 5 untreated patients. Patients were evaluated at the beginning of the study and in the first, third, and sixth month of treatment. In white matter lesions, NAA, Cho, Cr, and mI peaks did not vary significantly over the entire period of study in the untreated group. In the treated group, there was a significant increase in Cho at the first month relative to the pretreatment period, and continued to increase at months 3 and 6 (p<0.001). A slight but not statistically significant increase in Cho was also found in the NAWM from the patients treated with IFN β-1a.
In a small pilot study, 1H-MRS was performed in 10 RRMS patients before and after one year of treatment with subcutaneous interferon β-1b. NAA/Cr was measured in a large central brain volume118. These measurements were compared with those from six untreated patients selected for similar range of EDSS scores and mean NAA/Cr at baseline. NAA/Cr in the treated group showed an increase of 5.5% at 12 months of therapy, while this ratio decreased in the untreated group, but not significantly. NAA/Cr was significantly higher in the treated group at 12 months than in the untreated group118, suggesting an effect of interferon β-1b in restoring neural integrity.
Unfortunately, many of these studies are based on small patient populations followed over relatively short intervals. Lack of standardized acquisition and analysis protocols makes it very difficult to evaluate the results critically.
Conclusions
1H-MRS is a valuable tool that could contribute in objectively following the evolution of MS, to the understanding of its pathogenesis, evaluating disease severity, establishing prognosis, and assessing the efficacy of therapeutic interventions. Some of the most compelling evidences that axonal loss is a major cause of disability in MS has come from 1H-MRS studies which show reduced NAA levels in brain of these patients. 1H-MRS studies have shown that axonal damage is an early event that occurs before the formation of MRI-visible lesions. However, a number of technical factors that include poor SNR, long acquisition times, poor spatial resolution, limited spatial coverage, and complex data processing have so far limited the use of 1H-MRS in routine clinical practice. Recent developments of high field MRI scanners for improved SNR and spectral resolution, introduction of parallel imaging, fast analysis techniques, and the availability of free analysis tools should greatly facilitate a more widespread use of 1H-MRS in the diagnosis and management of MS. Another aspect of MRS that needs to be addressed is the standardization of both acquisition and analysis protocols. A first step towards achieving the standardization, based on single voxel MRS, has recently been proposed13. While this is an appropriate first step, standardized protocols that include multi-voxel MRS for increased spatial coverage and exploit the full potential of MR hardware and software are needed.
Acknowledgments
This work was supported in part by NIH/NIBIB Grant No. EB02095
Footnotes
Publisher's Disclaimer: This is a PDF file of an unedited manuscript that has been accepted for publication. As a service to our customers we are providing this early version of the manuscript. The manuscript will undergo copyediting, typesetting, and review of the resulting proof before it is published in its final citable form. Please note that during the production process errors may be discovered which could affect the content, and all legal disclaimers that apply to the journal pertain.
References
- 1.Rovaris M, Comi G, Filippi M. The role of non-conventional MR techniques to study multiple sclerosis patients. J Neurol Sci. 2001 May 1;186 Suppl 1:S3–9. doi: 10.1016/s0022-510x(01)00485-3. [DOI] [PubMed] [Google Scholar]
- 2.Narayana PA, Doyle TJ, Lai D, Wolinsky JS. Serial proton magnetic resonance spectroscopic imaging, contrast-enhanced magnetic resonance imaging, and quantitative lesion volumetry in multiple sclerosis. Ann Neurol. 1998 Jan;43(1):56–71. doi: 10.1002/ana.410430112. [DOI] [PubMed] [Google Scholar]
- 3.Narayana PA. Magnetic resonance spectroscopy in the monitoring of multiple sclerosis. J Neuroimaging. 2005;15(4 Suppl):46S–57S. doi: 10.1177/1051228405284200. [DOI] [PMC free article] [PubMed] [Google Scholar]
- 4.Wolinsky JS, Narayana PA. Magnetic resonance spectroscopy in multiple sclerosis: window into the diseased brain. Curr Opin Neurol. 2002 Jun;15(3):247–251. doi: 10.1097/00019052-200206000-00004. [DOI] [PubMed] [Google Scholar]
- 5.Gonzalez-Toledo E, Kelley RE, Minagar A. Role of magnetic resonance spectroscopy in diagnosis and management of multiple sclerosis. Neurol Res. 2006 Apr;28(3):280–283. doi: 10.1179/016164106X98161. [DOI] [PubMed] [Google Scholar]
- 6.Lin A, Ross BD, Harris K, Wong W. Efficacy of proton magnetic resonance spectroscopy in neurological diagnosis and neurotherapeutic decision making. NeuroRx. 2005 Apr;2(2):197–214. doi: 10.1602/neurorx.2.2.197. [DOI] [PMC free article] [PubMed] [Google Scholar]
- 7.Bitsch A, Bruhn H, Vougioukas V, et al. Inflammatory CNS demyelination: histopathologic correlation with in vivo quantitative proton MR spectroscopy. AJNR Am J Neuroradiol. 1999 Oct;20(9):1619–1627. [PMC free article] [PubMed] [Google Scholar]
- 8.Hurd R, Sailasuta N, Srinivasan R, Vigneron DB, Pelletier D, Nelson SJ. Measurement of brain glutamate using TE-averaged PRESS at 3T. Magn Reson Med. 2004 Mar;51(3):435–440. doi: 10.1002/mrm.20007. [DOI] [PubMed] [Google Scholar]
- 9.Srinivasan R, Sailasuta N, Hurd R, Nelson S, Pelletier D. Evidence of elevated glutamate in multiple sclerosis using magnetic resonance spectroscopy at 3 T. Brain. 2005 May;128(Pt 5):1016–1025. doi: 10.1093/brain/awh467. [DOI] [PubMed] [Google Scholar]
- 10.Frahm J, Hanefeld F. Localized proton magnetic resonance spectroscopy of brain disorders in childhood. In: Bachelard HS, editor. Advances in Neurochemistry. Vol. 18. New York: Plenum; 1997. pp. 329–402. [Google Scholar]
- 11.Brand A, Richter-Landsberg C, Leibfritz D. Multinuclear NMR studies on the energy metabolism of glial and neuronal cells. Dev Neurosci. 1993;15(35):289–298. doi: 10.1159/000111347. [DOI] [PubMed] [Google Scholar]
- 12.De Stefano N, Filippi M. MR spectroscopy in multiple sclerosis. J Neuroimaging. 2007 Apr;17 Suppl 1:31S–35S. doi: 10.1111/j.1552-6569.2007.00134.x. [DOI] [PubMed] [Google Scholar]
- 13.De Stefano N, Filippi M, Miller D, et al. Guidelines for using proton MR spectroscopy in multicenter clinical MS studies. Neurology. 2007 Nov 13;69(20):1942–1952. doi: 10.1212/01.wnl.0000291557.62706.d3. [DOI] [PubMed] [Google Scholar]
- 14.Gonen O, Viswanathan AK, Catalaa I, Babb J, Udupa J, Grossman RI. Total brain N-acetylaspartate concentration in normal, age-grouped females: quantitation with non-echo proton NMR spectroscopy. Magn Reson Med. 1998 Nov;40(5):684–689. doi: 10.1002/mrm.1910400506. [DOI] [PubMed] [Google Scholar]
- 15.Bottomley PA. Spatial localization in NMR spectroscopy in vivo. Ann N Y Acad Sci. 1987;508:333–348. doi: 10.1111/j.1749-6632.1987.tb32915.x. [DOI] [PubMed] [Google Scholar]
- 16.Frahm J, Merboldt KD, Hanicke W. Localized proton spectroscopy using stimulated echoes. J Magn Reson. 1987;72(3):502–508. doi: 10.1002/mrm.1910170113. [DOI] [PubMed] [Google Scholar]
- 17.Posse S, DeCarli C, Le Bihan D. Three-dimensional echo-planar MR spectroscopic imaging at short echo times in the human brain. Radiology. 1994 Sep;192(3):733–738. doi: 10.1148/radiology.192.3.8058941. [DOI] [PubMed] [Google Scholar]
- 18.Sharma R, Narayana PA, Wolinsky JS. Grey matter abnormalities in multiple sclerosis: proton magnetic resonance spectroscopic imaging. Mult Scler. 2001 Aug;7(4):221–226. doi: 10.1177/135245850100700402. [DOI] [PubMed] [Google Scholar]
- 19.Maudsley AA, Matson GB, Hugg JW, Weiner MW. Reduced phase encoding in spectroscopic imaging. Magn Reson Med. 1994 Jun;31(6):645–651. doi: 10.1002/mrm.1910310610. [DOI] [PubMed] [Google Scholar]
- 20.Posse S, Tedeschi G, Risinger R, Ogg R, Le Bihan D. High speed 1H spectroscopic imaging in human brain by echo planar spatial-spectral encoding. Magn Reson Med. 1995 Jan;33(1):34–40. doi: 10.1002/mrm.1910330106. [DOI] [PubMed] [Google Scholar]
- 21.Mathiesen HK, Tscherning T, Sorensen PS, et al. Multi-slice echo-planar spectroscopic MR imaging provides both global and local metabolite measures in multiple sclerosis. Magn Reson Med. 2005 Apr;53(4):750–759. doi: 10.1002/mrm.20407. [DOI] [PubMed] [Google Scholar]
- 22.Pruessmann KP, Weiger M, Scheidegger MB, Boesiger P. SENSE: sensitivity encoding for fast MRI. Magn Reson Med. 1999 Nov;42(5):952–962. [PubMed] [Google Scholar]
- 23.Griswold MA, Jakob PM, Heidemann RM, et al. Generalized autocalibrating partially parallel acquisitions (GRAPPA) Magn Reson Med. 2002 Jun;47(6):1202–1210. doi: 10.1002/mrm.10171. [DOI] [PubMed] [Google Scholar]
- 24.Lin FH, Tsai SY, Otazo R, et al. Sensitivity-encoded (SENSE) proton echo-planar spectroscopic imaging (PEPSI) in the human brain. Magn Reson Med. 2007 Feb;57(2):249–257. doi: 10.1002/mrm.21119. [DOI] [PubMed] [Google Scholar]
- 25.Tsai SY, Otazo R, Posse S, et al. Accelerated proton echo planar spectroscopic imaging (PEPSI) using GRAPPA with a 32-channel phased-array coil. Magn Reson Med. 2008 May;59(5):989–998. doi: 10.1002/mrm.21545. [DOI] [PubMed] [Google Scholar]
- 26.Otazo R, Tsai SY, Lin FH, Posse S. Accelerated short-TE 3D proton echo-planar spectroscopic imaging using 2D-SENSE with a 32-channel array coil. Magn Reson Med. 2007 Dec;58(6):1107–1116. doi: 10.1002/mrm.21426. [DOI] [PubMed] [Google Scholar]
- 27.Mader I, Seeger U, Weissert R, et al. Proton MR spectroscopy with metabolite-nulling reveals elevated macromolecules in acute multiple sclerosis. Brain. 2001 May;124(Pt 5):953–961. doi: 10.1093/brain/124.5.953. [DOI] [PubMed] [Google Scholar]
- 28.Gonen O, Grossman RI. The accuracy of whole brain N-acetylaspartate quantification. Magn Reson Imaging. 2000 Dec;18(10):1255–1258. doi: 10.1016/s0730-725x(00)00221-6. [DOI] [PubMed] [Google Scholar]
- 29.Benedetti B, Rigotti DJ, Liu S, Filippi M, Grossman RI, Gonen O. Reproducibility of the whole-brain N-acetylaspartate level across institutions, MR scanners, and field strengths. AJNR Am J Neuroradiol. 2007 Jan;28(1):72–75. [PMC free article] [PubMed] [Google Scholar]
- 30.Rigotti DJ, Inglese M, Gonen O. Whole-brain N-acetylaspartate as a surrogate marker of neuronal damage in diffuse neurologic disorders. AJNR Am J Neuroradiol. 2007 Nov-Dec;28(10):1843–1849. doi: 10.3174/ajnr.A0774. [DOI] [PMC free article] [PubMed] [Google Scholar]
- 31.Jansen JF, Backes WH, Nicolay K, Kooi ME. 1H MR spectroscopy of the brain: absolute quantification of metabolites. Radiology. 2006 Aug;240(2):318–332. doi: 10.1148/radiol.2402050314. [DOI] [PubMed] [Google Scholar]
- 32.Li BS, Wang H, Gonen O. Metabolite ratios to assumed stable creatine level may confound the quantification of proton brain MR spectroscopy. Magn Reson Imaging. 2003 Oct;21(8):923–928. doi: 10.1016/s0730-725x(03)00181-4. [DOI] [PubMed] [Google Scholar]
- 33.Narayana PA, Wolinsky JS, Rao SB, He R, Mehta M. Multicentre proton magnetic resonance spectroscopy imaging of primary progressive multiple sclerosis. Mult Scler. 2004 Jun;10 Suppl 1:S73–78. doi: 10.1191/1352458504ms1035oa. [DOI] [PubMed] [Google Scholar]
- 34.Keevil SF, Barbiroli B, Brooks JC, et al. Absolute metabolite quantification by in vivo NMR spectroscopy: II. A multicentre trial of protocols for in vivo localised proton studies of human brain. Magn Reson Imaging. 1998 Nov;16(9):1093–1106. doi: 10.1016/s0730-725x(98)00118-0. [DOI] [PubMed] [Google Scholar]
- 35.Provencher SW. Estimation of metabolite concentrations from localized in vivo proton NMR spectra. Magn Reson Med. 1993 Dec;30(6):672–679. doi: 10.1002/mrm.1910300604. [DOI] [PubMed] [Google Scholar]
- 36.Provencher SW. Automatic quantitation of localized in vivo 1H spectra with LCModel. NMR Biomed. 2001 Jun;14(4):260–264. doi: 10.1002/nbm.698. [DOI] [PubMed] [Google Scholar]
- 37.Doyle TJ, Pathak R, Wolinsky JS, Narayana PA. Automated proton spectroscopic image processing. J Magn Reson B. 1995 Jan;106(1):58–63. doi: 10.1006/jmrb.1995.1008. [DOI] [PubMed] [Google Scholar]
- 38.Maudsley AA, Wu Z, Meyerhoff DJ, Weiner MW. Automated processing for proton spectroscopic imaging using water reference deconvolution. Magn Reson Med. 1994 Jun;31(6):589–595. doi: 10.1002/mrm.1910310603. [DOI] [PubMed] [Google Scholar]
- 39.Mierisova S, Ala-Korpela M. MR spectroscopy quantitation: a review of frequency domain methods. NMR Biomed. 2001 Jun;14(4):247–259. doi: 10.1002/nbm.697. [DOI] [PubMed] [Google Scholar]
- 40.Kaartinen J, Mierisova S, Oja JM, Usenius JP, Kauppinen RA, Hiltunen Y. Automated quantification of human brain metabolites by artificial neural network analysis from in vivo single-voxel 1H NMR spectra. J Magn Reson. 1998 Sep;134(1):176–179. doi: 10.1006/jmre.1998.1477. [DOI] [PubMed] [Google Scholar]
- 41.Hiltunen Y, Kaartinen J, Pulkkinen J, Hakkinen AM, Lundbom N, Kauppinen RA. Quantification of human brain metabolites from in vivo 1H NMR magnitude spectra using automated artificial neural network analysis. J Magn Reson. 2002 Jan;154(1):1–5. doi: 10.1006/jmre.2001.2457. [DOI] [PubMed] [Google Scholar]
- 42.Marshall I, Higinbotham J, Bruce S, Freise A. Use of Voigt lineshape for quantification of in vivo 1H spectra. Magn Reson Med. 1997 May;37(5):651–657. doi: 10.1002/mrm.1910370504. [DOI] [PubMed] [Google Scholar]
- 43.Bhat H, Sajja BR, Narayana PA. Fast quantification of proton magnetic resonance spectroscopic imaging with artificial neural networks. J Magn Reson. 2006 Nov;183(1):110–122. doi: 10.1016/j.jmr.2006.08.004. [DOI] [PMC free article] [PubMed] [Google Scholar]
- 44.Naressi A, Couturier C, Devos JM, et al. Java-based graphical user interface for the MRUI quantitation package. MAGMA. 2001 May;12(23):141–152. doi: 10.1007/BF02668096. [DOI] [PubMed] [Google Scholar]
- 45.Maudsley AA, Darkazanli A, Alger JR, et al. Comprehensive processing, display and analysis for in vivo MR spectroscopic imaging. NMR Biomed. 2006 Jun;19(4):492–503. doi: 10.1002/nbm.1025. [DOI] [PMC free article] [PubMed] [Google Scholar]
- 46.Adams HP, Wagner S, Sobel DF, et al. Hypointense and hyperintense lesions on magnetic resonance imaging in secondary-progressive MS patients. Eur Neurol. 1999 Jul;42(1):52–63. doi: 10.1159/000008069. [DOI] [PubMed] [Google Scholar]
- 47.Davie CA, Barker GJ, Thompson AJ, Tofts PS, McDonald WI, Miller DH. 1H magnetic resonance spectroscopy of chronic cerebral white matter lesions and normal appearing white matter in multiple sclerosis. J Neurol Neurosurg Psychiatry. 1997 Dec;63(6):736–742. doi: 10.1136/jnnp.63.6.736. [DOI] [PMC free article] [PubMed] [Google Scholar]
- 48.He J, Inglese M, Li BS, Babb JS, Grossman RI, Gonen O. Relapsing-remitting multiple sclerosis: metabolic abnormality in nonenhancing lesions and normal-appearing white matter at MR imaging: initial experience. Radiology. 2005 Jan;234(1):211–217. doi: 10.1148/radiol.2341031895. [DOI] [PubMed] [Google Scholar]
- 49.Arnold DL, De Stefano N, Narayanan S, Matthews PM. Proton MR spectroscopy in multiple sclerosis. Neuroimaging Clin N Am. 2000 Nov;10(4):789–798. ix–x. [PubMed] [Google Scholar]
- 50.Wolinsky JS, Narayana PA, Fenstermacher MJ. Proton magnetic resonance spectroscopy in multiple sclerosis. Neurology. 1990 Nov;40(11):1764–1769. doi: 10.1212/wnl.40.11.1764. [DOI] [PubMed] [Google Scholar]
- 51.Larsson HB, Christiansen P, Jensen M, et al. Localized in vivo proton spectroscopy in the brain of patients with multiple sclerosis. Magn Reson Med. 1991 Nov;22(1):23–31. doi: 10.1002/mrm.1910220104. [DOI] [PubMed] [Google Scholar]
- 52.Davie CA, Hawkins CP, Barker GJ, et al. Serial proton magnetic resonance spectroscopy in acute multiple sclerosis lesions. Brain. 1994 Feb;117(Pt 1):49–58. doi: 10.1093/brain/117.1.49. [DOI] [PubMed] [Google Scholar]
- 53.Trapp BD, Peterson J, Ransohoff RM, Rudick R, Mork S, Bo L. Axonal transection in the lesions of multiple sclerosis. N Engl J Med. 1998 Jan 29;338(5):278–285. doi: 10.1056/NEJM199801293380502. [DOI] [PubMed] [Google Scholar]
- 54.Reddy H, Narayanan S, Matthews PM, et al. Relating axonal injury to functional recovery in MS. Neurology. 2000 Jan 11;54(1):236–239. doi: 10.1212/wnl.54.1.236. [DOI] [PubMed] [Google Scholar]
- 55.De Stefano N, Matthews PM, Arnold DL. Reversible decreases in N-acetylaspartate after acute brain injury. Magn Reson Med. 1995 Nov;34(5):721–727. doi: 10.1002/mrm.1910340511. [DOI] [PubMed] [Google Scholar]
- 56.Mader I, Roser W, Kappos L, et al. Serial proton MR spectroscopy of contrast-enhancing multiple sclerosis plaques: absolute metabolic values over 2 years during a clinical pharmacological study. AJNR Am J Neuroradiol. 2000 Aug;21(7):1220–1227. [PMC free article] [PubMed] [Google Scholar]
- 57.Arnold DL, Matthews PM, Francis GS, O'Connor J, Antel JP. Proton magnetic resonance spectroscopic imaging for metabolic characterization of demyelinating plaques. Ann Neurol. 1992 Mar;31(3):235–241. doi: 10.1002/ana.410310302. [DOI] [PubMed] [Google Scholar]
- 58.De Stefano N, Matthews PM, Antel JP, Preul M, Francis G, Arnold DL. Chemical pathology of acute demyelinating lesions and its correlation with disability. Ann Neurol. 1995 Dec;38(6):901–909. doi: 10.1002/ana.410380610. [DOI] [PubMed] [Google Scholar]
- 59.Filippi M, Agosta F. Magnetization transfer MRI in multiple sclerosis. J Neuroimaging. 2007 Apr;17 Suppl 1:22S–26S. doi: 10.1111/j.1552-6569.2007.00132.x. [DOI] [PubMed] [Google Scholar]
- 60.Rovaris M, Filippi M. Diffusion tensor MRI in multiple sclerosis. J Neuroimaging. 2007 Apr;17 Suppl 1:27S–30S. doi: 10.1111/j.1552-6569.2007.00133.x. [DOI] [PubMed] [Google Scholar]
- 61.Fu L, Matthews PM, De Stefano N, et al. Imaging axonal damage of normal-appearing white matter in multiple sclerosis. Brain. 1998 Jan;121(Pt 1):103–113. doi: 10.1093/brain/121.1.103. [DOI] [PubMed] [Google Scholar]
- 62.Husted CA, Goodin DS, Hugg JW, et al. Biochemical alterations in multiple sclerosis lesions and normal-appearing white matter detected by in vivo 31P and 1H spectroscopic imaging. Ann Neurol. 1994 Aug;36(2):157–165. doi: 10.1002/ana.410360207. [DOI] [PubMed] [Google Scholar]
- 63.Narayanan S, Fu L, Pioro E, et al. Imaging of axonal damage in multiple sclerosis: spatial distribution of magnetic resonance imaging lesions. Ann Neurol. 1997 Mar;41(3):385–391. doi: 10.1002/ana.410410314. [DOI] [PubMed] [Google Scholar]
- 64.Sarchielli P, Presciutti O, Pelliccioli GP, et al. Absolute quantification of brain metabolites by proton magnetic resonance spectroscopy in normal-appearing white matter of multiple sclerosis patients. Brain. 1999 Mar;122(Pt 3):513–521. doi: 10.1093/brain/122.3.513. [DOI] [PubMed] [Google Scholar]
- 65.Bjartmar C, Kinkel RP, Kidd G, Rudick RA, Trapp BD. Axonal loss in normal-appearing white matter in a patient with acute MS. Neurology. 2001 Oct 9;57(7):1248–1252. doi: 10.1212/wnl.57.7.1248. [DOI] [PubMed] [Google Scholar]
- 66.Tartaglia MC, Narayanan S, De Stefano N, et al. Choline is increased in pre-lesional normal appearing white matter in multiple sclerosis. J Neurol. 2002 Oct;249(10):1382–1390. doi: 10.1007/s00415-002-0846-6. [DOI] [PubMed] [Google Scholar]
- 67.Filippi M, Rocca MA, Martino G, Horsfield MA, Comi G. Magnetization transfer changes in the normal appearing white matter precede the appearance of enhancing lesions in patients with multiple sclerosis. Ann Neurol. 1998 Jun;43(6):809–814. doi: 10.1002/ana.410430616. [DOI] [PubMed] [Google Scholar]
- 68.Chard DT, Griffin CM, McLean MA, et al. Brain metabolite changes in cortical grey and normal-appearing white matter in clinically early relapsing-remitting multiple sclerosis. Brain. 2002 Oct;125(Pt 10):2342–2352. doi: 10.1093/brain/awf240. [DOI] [PubMed] [Google Scholar]
- 69.Tiberio M, Chard DT, Altmann DR, et al. Metabolite changes in early relapsing-remitting multiple sclerosis. A two year follow-up study. J Neurol. 2006 Feb;253(2):224–230. doi: 10.1007/s00415-005-0964-z. [DOI] [PubMed] [Google Scholar]
- 70.Leary SM, Davie CA, Parker GJ, et al. 1H magnetic resonance spectroscopy of normal appearing white matter in primary progressive multiple sclerosis. J Neurol. 1999 Nov;246(11):1023–1026. doi: 10.1007/s004150050507. [DOI] [PubMed] [Google Scholar]
- 71.Inglese M, Li BS, Rusinek H, Babb JS, Grossman RI, Gonen O. Diffusely elevated cerebral choline and creatine in relapsing-remitting multiple sclerosis. Magn Reson Med. 2003 Jul;50(1):190–195. doi: 10.1002/mrm.10481. [DOI] [PubMed] [Google Scholar]
- 72.Suhy J, Rooney WD, Goodkin DE, et al. 1H MRSI comparison of white matter and lesions in primary progressive and relapsing-remitting MS. Mult Scler. 2000 Jun;6(3):148–155. doi: 10.1177/135245850000600303. [DOI] [PMC free article] [PubMed] [Google Scholar]
- 73.Tourbah A, Stievenart JL, Abanou A, et al. Normal-appearing white matter in optic neuritis and multiple sclerosis: a comparative proton spectroscopy study. Neuroradiology. 1999 Oct;41(10):738–743. doi: 10.1007/s002340050835. [DOI] [PubMed] [Google Scholar]
- 74.Fernando KT, McLean MA, Chard DT, et al. Elevated white matter myo-inositol in clinically isolated syndromes suggestive of multiple sclerosis. Brain. 2004 Jun;127(Pt 6):1361–1369. doi: 10.1093/brain/awh153. [DOI] [PubMed] [Google Scholar]
- 75.Wattjes MP, Harzheim M, Lutterbey GG, Klotz L, Schild HH, Traber F. Axonal damage but no increased glial cell activity in the normal-appearing white matter of patients with clinically isolated syndromes suggestive of multiple sclerosis using high-field magnetic resonance spectroscopy. AJNR Am J Neuroradiol. 2007 Sep;28(8):1517–1522. doi: 10.3174/ajnr.A0594. [DOI] [PMC free article] [PubMed] [Google Scholar]
- 76.Wattjes MP, Harzheim M, Lutterbey GG, Bogdanow M, Schild HH, Traber F. High field MR imaging and 1H-MR spectroscopy in clinically isolated syndromes suggestive of multiple sclerosis: correlation between metabolic alterations and diagnostic MR imaging criteria. J Neurol. 2008 Jan;255(1):56–63. doi: 10.1007/s00415-007-0666-9. [DOI] [PubMed] [Google Scholar]
- 77.Minagar A. Gray matter involvement in multiple sclerosis: a new window into pathogenesis. J Neuroimaging. 2003 Oct;13(4):291–292. [PubMed] [Google Scholar]
- 78.Stadelmann C, Albert M, Wegner C, Bruck W. Cortical pathology in multiple sclerosis. Curr Opin Neurol. 2008 Jun;21(3):229–234. doi: 10.1097/01.wco.0000318863.65635.9a. [DOI] [PubMed] [Google Scholar]
- 79.Bedell BJ, Narayana PA. Implementation and evaluation of a new pulse sequence for rapid acquisition of double inversion recovery images for simultaneous suppression of white matter and CSF. J Magn Reson Imaging. 1998 May-Jun;8(3):544–547. doi: 10.1002/jmri.1880080305. [DOI] [PubMed] [Google Scholar]
- 80.Geurts JJ, Pouwels PJ, Uitdehaag BM, Polman CH, Barkhof F, Castelijns JA. Intracortical lesions in multiple sclerosis: improved detection with 3D double inversion-recovery MR imaging. Radiology. 2005 Jul;236(1):254–260. doi: 10.1148/radiol.2361040450. [DOI] [PubMed] [Google Scholar]
- 81.Geurts JJ, Bo L, Pouwels PJ, Castelijns JA, Polman CH, Barkhof F. Cortical lesions in multiple sclerosis: combined postmortem MR imaging and histopathology. AJNR Am J Neuroradiol. 2005 Mar;26(3):572–577. [PMC free article] [PubMed] [Google Scholar]
- 82.Nelson F, Poonawalla AH, Hou P, Huang F, Wolinsky JS, Narayana PA. Improved identification of intracortical lesions in multiple sclerosis with phase-sensitive inversion recovery in combination with fast double inversion recovery MR imaging. AJNR Am J Neuroradiol. 2007 Oct;28(9):1645–1649. doi: 10.3174/ajnr.A0645. [DOI] [PMC free article] [PubMed] [Google Scholar]
- 83.Dehmeshki J, Chard DT, Leary SM, et al. The normal appearing grey matter in primary progressive multiple sclerosis: a magnetisation transfer imaging study. J Neurol. 2003 Jan;250(1):67–74. doi: 10.1007/s00415-003-0955-x. [DOI] [PubMed] [Google Scholar]
- 84.Rovaris M, Bozzali M, Iannucci G, et al. Assessment of normal-appearing white and gray matter in patients with primary progressive multiple sclerosis: a diffusion-tensor magnetic resonance imaging study. Arch Neurol. 2002 Sep;59(9):1406–1412. doi: 10.1001/archneur.59.9.1406. [DOI] [PubMed] [Google Scholar]
- 85.Poonawalla AH, Hasan KM, Gupta RK, et al. Diffusion-tensor MR imaging of cortical lesions in multiple sclerosis: initial findings. Radiology. 2008 Mar;246(3):880–886. doi: 10.1148/radiol.2463070486. [DOI] [PubMed] [Google Scholar]
- 86.Kapeller P, McLean MA, Griffin CM, et al. Preliminary evidence for neuronal damage in cortical grey matter and normal appearing white matter in short duration relapsing-remitting multiple sclerosis: a quantitative MR spectroscopic imaging study. J Neurol. 2001 Feb;248(2):131–138. doi: 10.1007/s004150170248. [DOI] [PubMed] [Google Scholar]
- 87.Sijens PE, Mostert JP, Oudkerk M, De Keyser J. (1)H MR spectroscopy of the brain in multiple sclerosis subtypes with analysis of the metabolite concentrations in gray and white matter: initial findings. Eur Radiol. 2006 Feb;16(2):489–495. doi: 10.1007/s00330-005-2839-1. [DOI] [PubMed] [Google Scholar]
- 88.Van Au Duong M, Audoin B, Le Fur Y, et al. Relationships between gray matter metabolic abnormalities and white matter inflammation in patients at the very early stage of MS : a MRSI study. J Neurol. 2007 Jul;254(7):914–923. doi: 10.1007/s00415-006-0474-7. [DOI] [PubMed] [Google Scholar]
- 89.Geurts JJ, Reuling IE, Vrenken H, et al. MR spectroscopic evidence for thalamic and hippocampal, but not cortical, damage in multiple sclerosis. Magn Reson Med. 2006 Mar;55(3):478–483. doi: 10.1002/mrm.20792. [DOI] [PubMed] [Google Scholar]
- 90.Adalsteinsson E, Langer-Gould A, Homer RJ, et al. Gray matter N-acetyl aspartate deficits in secondary progressive but not relapsing-remitting multiple sclerosis. AJNR Am J Neuroradiol. 2003 Nov-Dec;24(10):1941–1945. [PMC free article] [PubMed] [Google Scholar]
- 91.Sarchielli P, Presciutti O, Tarducci R, et al. Localized (1)H magnetic resonance spectroscopy in mainly cortical gray matter of patients with multiple sclerosis. J Neurol. 2002 Jul;249(7):902–910. doi: 10.1007/s00415-002-0758-5. [DOI] [PubMed] [Google Scholar]
- 92.Cifelli A, Arridge M, Jezzard P, Esiri MM, Palace J, Matthews PM. Thalamic neurodegeneration in multiple sclerosis. Ann Neurol. 2002 Nov;52(5):650–653. doi: 10.1002/ana.10326. [DOI] [PubMed] [Google Scholar]
- 93.Bakshi R, Benedict RH, Bermel RA, et al. T2 hypointensity in the deep gray matter of patients with multiple sclerosis: a quantitative magnetic resonance imaging study. Arch Neurol. 2002 Jan;59(1):62–68. doi: 10.1001/archneur.59.1.62. [DOI] [PubMed] [Google Scholar]
- 94.Wylezinska M, Cifelli A, Jezzard P, Palace J, Alecci M, Matthews PM. Thalamic neurodegeneration in relapsing-remitting multiple sclerosis. Neurology. 2003 Jun 24;60(12):1949–1954. doi: 10.1212/01.wnl.0000069464.22267.95. [DOI] [PubMed] [Google Scholar]
- 95.Birnbaum G, Leist TP, Lublin FD. Commentary I: Pathophysiologic construct for neuronal degeneration/regeneration in multiple sclerosis. Neurology. 2007;68(22 Suppl 3):S2–S4. [Google Scholar]
- 96.Gonen O, Catalaa I, Babb JS, et al. Total brain N-acetylaspartate: a new measure of disease load in MS. Neurology. 2000 Jan 11;54(1):15–19. doi: 10.1212/wnl.54.1.15. [DOI] [PubMed] [Google Scholar]
- 97.Rovaris M, Gallo A, Falini A, et al. Axonal injury and overall tissue loss are not related in primary progressive multiple sclerosis. Arch Neurol. 2005 Jun;62(6):898–902. doi: 10.1001/archneur.62.6.898. [DOI] [PubMed] [Google Scholar]
- 98.Ge Y, Gonen O, Inglese M, Babb JS, Markowitz CE, Grossman RI. Neuronal cell injury precedes brain atrophy in multiple sclerosis. Neurology. 2004 Feb 24;62(4):624–627. doi: 10.1212/wnl.62.4.624. [DOI] [PubMed] [Google Scholar]
- 99.Filippi M, Bozzali M, Rovaris M, et al. Evidence for widespread axonal damage at the earliest clinical stage of multiple sclerosis. Brain. 2003 Feb;126(Pt 2):433–437. doi: 10.1093/brain/awg038. [DOI] [PubMed] [Google Scholar]
- 100.Tartaglino LM, Friedman DP, Flanders AE, Lublin FD, Knobler RL, Liem M. Multiple sclerosis in the spinal cord: MR appearance and correlation with clinical parameters. Radiology. 1995 Jun;195(3):725–732. doi: 10.1148/radiology.195.3.7754002. [DOI] [PubMed] [Google Scholar]
- 101.Bastianello S, Paolillo A, Giugni E, et al. MRI of spinal cord in MS. J Neurovirol. 2000 May;6 Suppl 2:S130–133. [PubMed] [Google Scholar]
- 102.Ganter P, Prince C, Esiri MM. Spinal cord axonal loss in multiple sclerosis: a post-mortem study. Neuropathol Appl Neurobiol. 1999 Dec;25(6):459–467. doi: 10.1046/j.1365-2990.1999.00205.x. [DOI] [PubMed] [Google Scholar]
- 103.DeLuca GC, Ebers GC, Esiri MM. Axonal loss in multiple sclerosis: a pathological survey of the corticospinal and sensory tracts. Brain. 2004 May;127(Pt 5):1009–1018. doi: 10.1093/brain/awh118. [DOI] [PubMed] [Google Scholar]
- 104.Blamire AM, Cader S, Lee M, Palace J, Matthews PM. Axonal damage in the spinal cord of multiple sclerosis patients detected by magnetic resonance spectroscopy. Magn Reson Med. 2007 Nov;58(5):880–885. doi: 10.1002/mrm.21382. [DOI] [PubMed] [Google Scholar]
- 105.Marliani AF, Clementi V, Albini-Riccioli L, Agati R, Leonardi M. Quantitative proton magnetic resonance spectroscopy of the human cervical spinal cord at 3 Tesla. Magn Reson Med. 2007 Jan;57(1):160–163. doi: 10.1002/mrm.21113. [DOI] [PubMed] [Google Scholar]
- 106.Kendi AT, Tan FU, Kendi M, Yilmaz S, Huvaj S, Tellioglu S. MR spectroscopy of cervical spinal cord in patients with multiple sclerosis. Neuroradiology. 2004 Sep;46(9):764–769. doi: 10.1007/s00234-004-1231-1. [DOI] [PubMed] [Google Scholar]
- 107.Ciccarelli O, Wheeler-Kingshott CA, McLean MA, et al. Spinal cord spectroscopy and diffusion-based tractography to assess acute disability in multiple sclerosis. Brain. 2007 Aug;130(Pt 8):2220–2231. doi: 10.1093/brain/awm152. [DOI] [PubMed] [Google Scholar]
- 108.Arnold DL. Evidence for neuroprotection and remyelination using imaging techniques. Neurology. 2007 May 29;68(22 Suppl 3):S83–90. doi: 10.1212/01.wnl.0000275237.28259.9d. discussion S91-86. [DOI] [PubMed] [Google Scholar]
- 109.Khan O, Shen Y, Caon C, et al. Axonal metabolic recovery and potential neuroprotective effect of glatiramer acetate in relapsing-remitting multiple sclerosis. Mult Scler. 2005 Dec;11(6):646–651. doi: 10.1191/1352458505ms1234oa. [DOI] [PubMed] [Google Scholar]
- 110.Comi G, Filippi M, Wolinsky JS. European/Canadian multicenter, double-blind, randomized, placebo-controlled study of the effects of glatiramer acetate on magnetic resonance imaging--measured disease activity and burden in patients with relapsing multiple sclerosis. European/Canadian Glatiramer Acetate Study Group. Ann Neurol. 2001 Mar;49(3):290–297. [PubMed] [Google Scholar]
- 111.Paty DW, Li DK. Interferon beta-1b is effective in relapsing-remitting multiple sclerosis. II. MRI analysis results of a multicenter, randomized, double-blind, placebo-controlled trial. UBC MS/MRI Study Group and the IFNB Multiple Sclerosis Study Group. Neurology. 1993 Apr;43(4):662–667. doi: 10.1212/wnl.43.4.662. [DOI] [PubMed] [Google Scholar]
- 112.Narayanan S, Caramanos Z, Arnold D. The effect of glatiramer acetate treatment on axonal integrity in multiple sclerosis [abstract] Mult Scler. 2004;10(suppl 2)(S256):Abstract P633. [Google Scholar]
- 113.Khan O, Shen Y, Bao F, et al. Long-Term Study of Brain (1)H-MRS Study in Multiple Sclerosis: Effect of Glatiramer Acetate Therapy on Axonal Metabolic Function and Feasibility of Long-Term (1)H-MRS Monitoring in Multiple Sclerosis. J Neuroimaging. 2007 Nov 8; doi: 10.1111/j.1552-6569.2007.00206.x. [DOI] [PubMed] [Google Scholar]
- 114.Sajja BR, Narayana PA, Wolinsky JS, Ahn CW. Longitudinal magnetic resonance spectroscopic imaging of primary progressive multiple sclerosis patients treated with glatiramer acetate: multicenter study. Mult Scler. 2008 Jan;14(1):73–80. doi: 10.1177/1352458507079907. [DOI] [PubMed] [Google Scholar]
- 115.Wolinsky JS, Narayana PA, O'Connor P, et al. Glatiramer acetate in primary progressive multiple sclerosis: results of a multinational, multicenter, double-blind, placebo-controlled trial. Ann Neurol. 2007 Jan;61(1):14–24. doi: 10.1002/ana.21079. [DOI] [PubMed] [Google Scholar]
- 116.Schubert F, Seifert F, Elster C, et al. Serial 1H-MRS in relapsing-remitting multiple sclerosis: effects of interferon-beta therapy on absolute metabolite concentrations. MAGMA. 2002 Jun;14(3):213–222. doi: 10.1007/BF02668215. [DOI] [PubMed] [Google Scholar]
- 117.Sarchielli P, Presciutti O, Tarducci R, et al. 1H-MRS in patients with multiple sclerosis undergoing treatment with interferon beta-1a: results of a preliminary study. J Neurol Neurosurg Psychiatry. 1998 Feb;64(2):204–212. doi: 10.1136/jnnp.64.2.204. [DOI] [PMC free article] [PubMed] [Google Scholar]
- 118.Narayanan S, De Stefano N, Francis GS, et al. Axonal metabolic recovery in multiple sclerosis patients treated with interferon beta-1b. J Neurol. 2001 Nov;248(11):979–986. doi: 10.1007/s004150170052. [DOI] [PubMed] [Google Scholar]