

Abstract
Purpose
To assess function of the central retina in 10 week old infants, multifocal electroretinograms (mfERG) were recorded. MfERG responses represent post-receptor retinal activity.
Methods
In infants (N = 23) and adults (N = 10), mfERG responses to both unscaled and scaled 61 hexagon arrays were recorded. The amplitude and implicit time of the negative (N1, N2) and positive (P1) peaks of the first order kernel were examined. The response from the entire area stimulated and responses to concentric rings were analyzed separately. The overall averaged response of the first slice of the second order kernel was also evaluated. Results from infants and adults were compared.
Results
The amplitude of the infants’ responses (N1, P1, N2) were significantly smaller and the implicit time significantly longer than those of adults. In infants, amplitude and implicit time varied little with eccentricity. In adults, amplitude decreased with eccentricity while implicit time varied little. The infants’ second order kernel was relatively more attenuated than their first order kernel.
Conclusion
The infants’ mfERG responses indicate immaturities of processing in the central retina. Infant-adult differences in the distribution of cones and bipolar cells may account for the results.
Cone mediated electroretinographic (ERG) responses to full field stimuli are relatively mature early in infancy. Specifically, the sensitivity and saturated amplitude of the cone photoresponse are 60% to 70% of the adult values by age 10 weeks.1 Peripheral cones are the main contributors to these ERG responses, while cones in the macula, which comprises less than 5% of the total retinal area, contribute little. Thus, little is known about cone function in the immature central retina. It is well recognized that foveal cone structure does not reach maturity until well into childhood 2, 3 and that visual acuity has a protracted course of development.4
Although the maximum amplitude of the cone driven post-receptor component, the b-wave, is nearly the same in infants as in adults, the shape of the b-wave stimulus/response function differs. The infants’ stimulus/response function does not show a fall off with increasing intensity.1 This absence of the photopic hill 5–9 in infants has been attributed to immaturity of the ON and OFF bipolar cell responses.1
The multifocal ERG (mfERG) provides information about the functional topography of the central retina by recording responses from a large number of small, discrete regions.10, 11 Cone-initiated activity in the bipolar cells is the main contributor to the mfERG response.11, 12 The goal of the present study was to use the mfERG to investigate post-receptor processes in the central retina of healthy young infants.
METHODS
Subjects
Term born 10-week-old infants (median 70 days; range 61 to 77 days; N = 23) were recruited by mail. All had been born within 10 days of their due date and were in good general health. Normal adult control subjects (median 24 years; range 22 to 51 years, N = 10) were also studied. Ophthalmic examination disclosed no abnormality in any subject. All infants had grating acuity 4 within the 95% prediction limits of normal for age. The infants, whose spherical equivalents (median +2.00 diopters; range +1.00 to +4.00 diopters) were within the 95% prediction limits of normal,13 did not wear optical correction during testing. Optical defocus has little effect on the amplitude or implicit time of the first order mfERG response.14, 15 The median ETDRS acuity of adults was 20/16 (range 20/13 to 20/24). Adults wore their optical correction, if any, during the test; median spherical equivalent was −0.88 diopters (range −7.75 diopters to Plano). Written, informed consent was obtained from control subjects and parents of the infants after explanation of the nature and possible consequences of the study. This study conformed to the tenets of the Declaration of Helsinki and was approved by the Children’s Hospital Committee on Clinical Investigation.
Procedure
The left pupil was dilated with cyclopentolate 1%. After 30 minutes, proparacaine 0.5% was instilled and a bipolar Burian-Allen electrode was placed on the left cornea. A ground electrode was placed on the skin over the left mastoid. Responses were differentially amplified (bandpass 0.3 to 100 Hz; gain 100,000), digitized, and displayed using the VERIS 4.1 system (EDI, San Mateo, CA). The real time input signal from the electrode was monitored, and segments contaminated by noise were rejected and recorded again.
An array of 61 hexagons around a central fixation cross was presented on a Nortech Image Technology monitor at a 75 Hz frame rate. At the 45 cm viewing distance, the horizontal extent of this array was 43.2°. The average luminance of the stimulus was ~100 cd/m2, and contrast between the white and black hexagons was >90%. Each hexagon alternated between white and black using a pseudo random m sequence with exponent 14. There were 214-1 m-sequence steps during the 3 minute 38 second recording period, which was divided into eight 27-second segments.
Subjects were tested with unscaled and scaled stimuli. In the unscaled condition, all hexagons were of equal size; this stimulus makes no assumptions about the underlying distribution of retinal cells. In the scaled condition, hexagon size was scaled with eccentricity such that, in adults, all hexagons produce approximately equal amplitude responses.10 A flip of a coin determined which condition was recorded first. Sixteen of the 23 infants completed testing in both conditions, five with scaled stimuli only, and two with unscaled stimuli only. Six of the 10 adults were tested in both conditions and four with scaled stimuli only.
One of the investigators (ABF) held the infant on her lap and supported the chin during the test. To reduce the demands on the infant’s fixation, the recording was broken into eight segments. At the start of each segment, the infant’s gaze was attracted to the center of the display by jiggling a small yarn doll (33 mm × 8 mm) which was removed when recording began. An observer continuously monitored the infant’s fixation during recording. Responses were recorded only when the observer reported that the infant was alert and looking at the center of the monitor. If the infant looked away from the center of the display, the segment was discarded and re-recorded. A control experiment showed that an observer could reliably report when adult subjects looked outside the central 2.8° hexagon. A second control experiment with an adult (RMH) showed that changes of fixation within the central hexagon produced by scanning along the border of that hexagon throughout the trial did not appreciably change the amplitude or implicit time of any component. Menz et al.16 also found that small changes of fixation within the central hexagon have no significant effect on the overall topography of the mfERG response.
Analyses
Responses to unscaled and scaled stimuli (Figure 1) were processed using the VERIS software with one iteration of artifact removal and spatial averaging with 1/6 of the surrounding responses.17 We refer to response density (nV/deg2) as “amplitude.” Amplitude of the first order kernel was measured from the baseline to the trough (N1, N2) or peak (P1) of the waveform. Implicit time was measured from the start of the trace to the trough or peak. First, the overall response of the entire stimulated retinal area was assessed by averaging the responses to all 61 hexagons. The infants’ amplitude and implicit time of each component of this overall averaged response were compared to adults’ using t-tests.
Figure 1.

Sample mfERG records of Infant 15. The 61 first order responses to unscaled (upper trace array) and scaled (lower trace array) stimuli are shown. This infant had amplitudes that were near the median in both conditions. In each panel, a schematic drawing of the stimulus is shown.
Next, responses for each subject were combined in five concentric rings using the VERIS software. Ring 1 was the central hexagon only. The amplitude and implicit time of the three components (N1, P1, N2) of the first order kernel were evaluated as a function of group (infant, adult) and eccentricity (ring 1, 2, 3, 4, 5) using a two factor repeated measures analysis of variance.18 Post-hoc comparisons were made using Scheffe’s test.
The first slice of the second order kernel represented in the averaged response to all 61 hexagons was also examined. The peak to trough amplitude of the second order response was measured. The ratio of this amplitude to P1 amplitude of the first order response was calculated.19–21 The ratio does not depend on absolute amplitude. The ratio in infants and adults was compared using a t-test.
For all statistical tests, the level of significance was p ≤ 0.01.
RESULTS
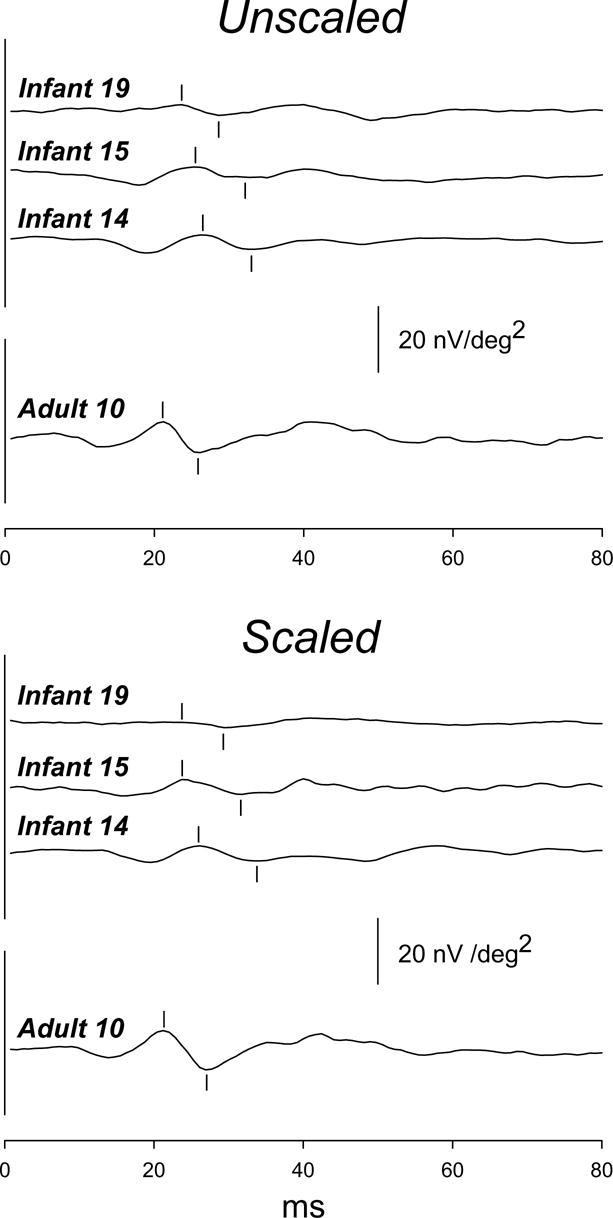
The waveform of the averaged first order kernel of the mfERG was similar in infants and adults for both unscaled and scaled stimuli (Figure 2). For both unscaled and scaled stimuli (Figure 3), the amplitude of P1 and N2 and the implicit time of N1, P1, and N2 differed significantly between infants and adults; N1 amplitude did not differ significantly. These results illustrate the principal features of the infant response: reduced amplitude and increased implicit time.
Figure 2.

First order kernel responses averaged across all 61 hexagons in the unscaled (upper panel) and scaled (lower panel) conditions. Responses are shown for infants who had P1 amplitude near the minimum (Infant 19), median (Infant 15), and maximum (Infant 14) values in both stimulus conditions. Responses from an adult (Adult 10) with P1 amplitude near the median are also shown (lowest trace in each panel). For each subject, waveforms in the unscaled and scaled conditions are similar. In each panel, the calibration bar pertains to all subjects.
Figure 3.

Amplitude (upper panels) and implicit time (lower panels) of overall averaged responses for unscaled (left) and scaled (right) stimuli in infants (filled bars) and adults (open bars). Means (± SEM) for N1, P1, and N2 of the first order kernel are shown.
Ring averages for first order kernel responses in three infants and an adult are shown in Figure 4 for unscaled and scaled stimuli. In Figure 5, mean infant and adult N1, P1, and N2 amplitudes (±SEM) are plotted for each ring, 1 through 5. The difference between infants and adults was greatest for ring 1, the central hexagon, and least for ring 5, the most peripheral ring. In adults, amplitude decreased markedly with eccentricity. In infants, amplitude changed little with eccentricity for unscaled stimuli; for scaled stimuli, amplitude in ring 1 was slightly larger than in rings 2 through 5.
Figure 4.

Ring averages to unscaled (upper panels) and scaled (lower panels) stimuli. The response to the central hexagon (ring 1) and the average response to all hexagons in each concentric ring (2 through 5) are shown. Responses from infants with P1 amplitude at the minimum (Infant 19), median (Infant 15), and maximum (Infant 14) are shown. For comparison, ring averages for an adult (Adult 10) are also plotted. The calibration bar (lower right panel) pertains to all panels.
Figure 5.

Mean amplitude (± SEM) for infants (filled circles) and adults (open circles) for N1, P1, and N2 of the first order kernel plotted for rings 1 through 5. Responses to unscaled stimuli are shown on the left and to scaled stimuli on the right.
For the ring averages, analysis of variance indicated that for both unscaled and scaled stimuli, the mean amplitude of N1, P1, and N2 differed significantly between infants and adults (Table 1). There was a significant interaction of group and eccentricity. For the central hexagon and ring 2, N1, P1, and N2 amplitude was significantly smaller in infants than adults (Scheffe’s test). For the peripheral rings (4 and 5), infant and adult amplitudes did not differ significantly.
Table 1.
Analysis of variance for ring averages.
| Amplitude
|
|||||||
|---|---|---|---|---|---|---|---|
| Unscaled
|
Scaled
|
||||||
| F | df | P | F | df | P | ||
| N1 | Group | 9.27 | 1 | <0.001 | 18.80 | 1 | <0.001 |
| Ring | 57.47 | 4 | <0.001 | 66.05 | 4 | <0.001 | |
| Group × Ring | 31.19 | 4 | <0.001 | 24.53 | 4 | <0.001 | |
| P1 | Group | 24.39 | 1 | <0.001 | 46.14 | 1 | <0.001 |
| Ring | 81.10 | 4 | <0.001 | 154.51 | 4 | <0.001 | |
| Group × Ring | 94.86 | 4 | <0.001 | 58.78 | 4 | <0.001 | |
| N2 | Group | 39.36 | 1 | <0.001 | 38.40 | 1 | <0.001 |
| Ring | 73.75 | 4 | <0.001 | 94.61 | 4 | <0.001 | |
| Group × Ring | 79.70 | 4 | <0.001 | 26.77 | 4 | <0.001 | |
| Implicit Time
|
|||||||
| Unscaled
|
Scaled
|
||||||
| F | df | P | F | df | P | ||
|
| |||||||
| N1 | Group | 25.60 | 1 | <0.001 | 23.93 | 1 | <0.001 |
| Ring | 1.72 | 4 | 0.152 | 0.72 | 4 | 0.578 | |
| Group × Ring | 0.19 | 4 | 0.939 | 0.49 | 4 | 0.742 | |
| P1 | Group | 28.08 | 1 | <0.001 | 58.70 | 1 | <0.001 |
| Ring | 1.54 | 4 | 0.197 | 0.02 | 4 | 0.999 | |
| Group × Ring | 0.43 | 4 | 0.789 | 0.91 | 4 | 0.463 | |
| N2 | Group | 20.97 | 1 | <0.001 | 42.71 | 1 | <0.001 |
| Ring | 0.42 | 4 | 0.795 | 1.12 | 4 | 0.349 | |
| Group × Ring | 1.51 | 4 | 0.206 | 1.44 | 4 | 0.226 | |
Implicit time of all components for both unscaled and scaled conditions was significantly longer in infants than in adults (Figure 6, Table 1). The infant-adult difference did not vary with ring number and was larger for N2 than for the earlier components, N1 and P1.
Figure 6.

Mean implicit time (± SEM) for infants (filled circles) and adults (open circles) for N1, P1, and N2 of the first order kernel plotted for rings 1 through 5. Responses to unscaled stimuli are shown on the left and to scaled stimuli on the right.
The first slice of the second order kernel in three infants and an adult is shown in Figure 7. The mean amplitude of the second order response (Figure 8, upper panels) was significantly smaller in infants than in adults for both unscaled and scaled stimuli. In infants, the second order responses were relatively more attenuated than their first order responses. The average ratio of second order to first order response was significantly lower in infants than in adults (Figure 8, lower panels).
Figure 7.
The second order response averaged across all 61 hexagons in the unscaled (upper panel) and scaled (lower panel) conditions. The peak and trough used to specify amplitude are indicated. Responses are shown for the same subjects as in Figures 2 and 4. In each panel, the calibration bar pertains to all subjects.
Figure 8.

The amplitude of the second order kernel plotted (upper panels) for unscaled (left) and scaled (right) stimuli for infants (filled bars) and adults (open bars). The ratio of the amplitude of the second to first order response (lower panels) is plotted for infants and adults. Means (±SEM) are shown.
DISCUSSION
The present results show that the photopic responses of the central retina are significantly smaller and slower in infants than adults (Figures 3, 5, 6) and, in infants, vary little with eccentricity (Figures 5, 6). The amplitude difference between infants and adults decreases with eccentricity (Figure 5). The large central peak observed in adults is not found in infants. The similarity of infant and adult amplitudes in the peripheral rings is consistent with the relative maturity of the infants’ full field cone ERG which is dominated by peripheral retinal activity.1
In infants, the distribution of cones in the central retina is nearly flat.2, 3, 22 Specifically, results of analysis by Candy et al.23 showed that cone density varies from 15,000 cones/mm2 at the fovea to 12,500 cones/mm2 at 10° in the infant retina compared to ~200,000 cones/mm2 at the fovea and 11,300 cones/mm2 at 10° in the adult retina. If the relative density of bipolar cells is like that of cones, as it is in simian retina,24–27 the amplitude of the infants’ mfERG response would vary little with eccentricity. This would account for the results displayed in Figure 5.
Small changes in fixation within the central hexagon are unlikely to account for the infant-adult difference in mfERG responses. As previous results from adults 16 and our control experiment show, such eye movements have little effect. Furthermore, the shallow gradient of receptors in the infant eye 23 would be likely to reduce the impact of unstable fixation in infants’ mfERG.
The first slice of the second order kernel is thought to reflect non-linear adaptive processes.11, 28, 29 The amplitude of the second order response is very small in infants (Figures 7, 8), indicating that these adaptive processes are not well developed in infants. The present results add to previous knowledge obtained through the study of full field ERG oscillatory potentials,30 which also document immature neural processes in post receptor retina of young infants. These retinal immaturities may explain, in part, the protracted course of visual development.
Acknowledgments
Supported by National Eye Institute Grant EY 10597.
Footnotes
Disclosure: R. M. Hansen, None; A. Moskowitz, None; A. B. Fulton, None.
References
- 1.Hansen RM, Fulton AB. Development of the cone ERG in infants. Invest Ophthalmol Vis Sci. 2005;46:3458–3462. doi: 10.1167/iovs.05-0382. [DOI] [PMC free article] [PubMed] [Google Scholar]
- 2.Hendrickson A, Yuodelis C. The morphological development of the human fovea. Ophthalmology. 1984;91:603–612. doi: 10.1016/s0161-6420(84)34247-6. [DOI] [PubMed] [Google Scholar]
- 3.Yuodelis C, Hendrickson AE. A qualitative and quantitative analysis of the human fovea during development. Vision Res. 1986;26:847–855. doi: 10.1016/0042-6989(86)90143-4. [DOI] [PubMed] [Google Scholar]
- 4.Mayer DL, Beiser AS, Warner AF, Pratt EM, Raye KN, Lang JM. Monocular acuity norms for the Teller acuity cards between ages 1 month and 4 years. Invest Ophthalmol Vis Sci. 1995;36:671–685. [PubMed] [Google Scholar]
- 5.Wali N, Leguire LE. The photopic hill: a new phenomenon of the light adapted electroretinogram. Doc Ophthalmol. 1992;80:335–45. doi: 10.1007/BF00154382. [DOI] [PubMed] [Google Scholar]
- 6.Lachapelle P, Rufiange M, Dembinska O. A physiological basis for definition of the ISCEV ERG standard flash (SF) based on the photopic hill. Doc Ophthalmol. 2001;102:157–62. doi: 10.1023/A:1017505616163. [DOI] [PubMed] [Google Scholar]
- 7.Peachey NS, Alexander KR, Derlacki DJ, Fishman GA. Light adaptation and the luminance-response function of the cone electroretinogram. Doc Ophthalmol. 1992;79:363–269. doi: 10.1007/BF00160949. [DOI] [PubMed] [Google Scholar]
- 8.Rufiange M, Rousseau S, Dembinska O, Lachapelle P. Cone-dominated ERG luminance-response function: the Photopic Hill revisited. Doc Ophthalmol. 2002;104:231–48. doi: 10.1023/a:1015265812018. [DOI] [PubMed] [Google Scholar]
- 9.Rufiange M, Dassa J, Dembinska O, et al. The photopic ERG luminance-response function (photopic hill): method of analysis and clinical application. Vision Res. 2003;43:1405–12. doi: 10.1016/s0042-6989(03)00118-4. [DOI] [PubMed] [Google Scholar]
- 10.Sutter E, Tran D. The field topography of ERG components in man I. The photopic luminance response. Vision Res. 1992;32:433–446. doi: 10.1016/0042-6989(92)90235-b. [DOI] [PubMed] [Google Scholar]
- 11.Hood DC. Assessing retinal function with the multifocal technique. Prog Retin Eye Res. 2000;19:607–646. doi: 10.1016/s1350-9462(00)00013-6. [DOI] [PubMed] [Google Scholar]
- 12.Hood DC, Frishman LJ, Saszik S, Viswanathan S. Retinal origins of the primate multifocal ERG: implications for the human response. Invest Ophthalmol Vis Sci. 2002;43:1673–85. [PubMed] [Google Scholar]
- 13.Mayer DL, Hansen RM, Moore BD, Kim S, Fulton AB. Cycloplegic refractions in healthy children, aged 1 through 48 months. Arch Ophthalmol. 2001;119:1625–1628. doi: 10.1001/archopht.119.11.1625. [DOI] [PubMed] [Google Scholar]
- 14.Chan HL, Siu AW. Effect of optical defocus on multifocal ERG responses. Clin Exp Optom. 2003;86:317–22. doi: 10.1111/j.1444-0938.2003.tb03127.x. [DOI] [PubMed] [Google Scholar]
- 15.Palmowski AM, Berninger T, Allgayer R, Andrielis H, Heinemann-Vernaleken B, Rudolph G. Effects of refractive blur on the multifocal electroretinogram. Doc Ophthalmol. 1999;99:41–54. doi: 10.1023/a:1002432113628. [DOI] [PubMed] [Google Scholar]
- 16.Menz MK, Sutter EE, Menz MD. The effect of fixation instability on the multifocal ERG. Doc Ophthalmol. 2004;109:147–156. doi: 10.1007/s10633-004-3790-1. [DOI] [PubMed] [Google Scholar]
- 17.Bearse MA, Jr, Adams AJ, Han Y, et al. A multifocal electroretinogram model predicting the development of diabetic retinopathy. Prog Retin Eye Res. 2006;25:425–48. doi: 10.1016/j.preteyeres.2006.07.001. [DOI] [PMC free article] [PubMed] [Google Scholar]
- 18.Winer B. Statistical principles in experimental design. New York: McGraw- Hill; 1971. [Google Scholar]
- 19.Kondo M, Miyake Y, Kondo N, et al. Multifocal ERG findings in complete type congenital stationary night blindness. Invest Ophthalmol Vis Sci. 2001;42:1342–8. [PubMed] [Google Scholar]
- 20.Hood DC, Greenstein VC, Holopigian K, et al. An attempt to detect glaucomatous damage to the inner retina with the multifocal ERG. Invest Ophthalmol Vis Sci. 2000;41:1570–9. [PubMed] [Google Scholar]
- 21.Greenstein VC, Holopigian K, Seiple W, Carr RE, Hood DC. Atypical multifocal ERG responses in patients with diseases affecting the photoreceptors. Vision Res. 2004;44:2867–74. doi: 10.1016/j.visres.2004.06.020. [DOI] [PubMed] [Google Scholar]
- 22.Hendrickson AE, Drucker D. The development of parafoveal and midperipheral retina. Behav Brain Res. 1992;19:21–32. doi: 10.1016/s0166-4328(05)80191-3. [DOI] [PubMed] [Google Scholar]
- 23.Candy TR, Crowell JA, Banks MS. Optical, receptoral, and retinal constraints on foveal and peripheral vision in the human neonate. Vision Res. 1998;38:3857–70. doi: 10.1016/s0042-6989(98)00080-7. [DOI] [PubMed] [Google Scholar]
- 24.Calkins DJ, Schein SJ, Tsukamoto Y, Sterling P. M and L cones in macaque fovea connect to midget ganglion cells by different numbers of excitatory synapses. Nature. 1994;371:70–2. doi: 10.1038/371070a0. [DOI] [PubMed] [Google Scholar]
- 25.Chan TL, Martin PR, Clunas N, Grunert U. Bipolar cell diversity in the primate retina: morphologic and immunocytochemical analysis of a new world monkey, the marmoset Callithrix jacchus. J Comp Neurol. 2001;437:219–39. doi: 10.1002/cne.1280. [DOI] [PubMed] [Google Scholar]
- 26.Martin PR, Grunert U. Analysis of the short wavelength-sensitive (“blue”) cone mosaic in the primate retina: comparison of New World and Old World monkeys. J Comp Neurol. 1999;406:1–14. doi: 10.1002/(sici)1096-9861(19990329)406:1<1::aid-cne1>3.0.co;2-1. [DOI] [PubMed] [Google Scholar]
- 27.Wassle H, Grunert U, Martin PR, Boycott BB. Immunocytochemical characterization and spatial distribution of midget bipolar cells in the macaque monkey retina. Vision Res. 1994;34:561–79. doi: 10.1016/0042-6989(94)90013-2. [DOI] [PubMed] [Google Scholar]
- 28.Sutter E. The interpretation of multifocal binary kernels. Doc Ophthalmol. 2000;100:49–75. doi: 10.1023/a:1002702917233. [DOI] [PubMed] [Google Scholar]
- 29.Sutter EE. Imaging visual function with the multifocal m-sequence technique. Vision Res. 2001;41:1241–55. doi: 10.1016/s0042-6989(01)00078-5. [DOI] [PubMed] [Google Scholar]
- 30.Moskowitz A, Hansen RM, Fulton AB. ERG oscillatory potentials in infants. Doc Ophthalmol. 2005;110:265–70. doi: 10.1007/s10633-005-1983-x. [DOI] [PubMed] [Google Scholar]