Abstract
The level of the acute osteoporotic vertebral fracture, fracture type and grade of fracture deformation were determined in 107 consecutive patients and related to pain, disability, activities of daily living (ADL) and quality of life (QoL) after 3 weeks, 3, 6 and 12 months. Two-thirds of the fractured patients were women and with a similar average age, around 75 years, as the men. Fifty-eight of the acute fractures were located in the thoracic spine and 49 in the lumbar spine and predominantly at the Th12 and L1 levels. Sixty-nine percent of the fractures were wedge, 19% concave and 12% crush fractures. There were 22 mildly, 50 moderately and 35 severely deformed vertebrae. The grade of fracture deformation was not related to gender, age or fracture location. Severely deformed vertebrae predominantly (92%) occurred among the crush fracture type. One year after the fracture, irrespective of fracture level, fracture type or grade of fracture deformation, 4/5 still had pronounced pain and deteriorated QoL. Initial severe fracture deformation by far was the worst prognostic factor for severe lasting pain and disability, and deterioration of ADL and QoL. Factors like fracture level, lumbar fractures tended to improve steadily while thoracic deteriorated, type of fracture, the wedge and concave resulting in less pain and better QoL than the crush fracture type and gender influenced to a lesser extent the outcomes during the year after the acute fracture.
Keywords: Vertebral body fracture, Compression fracture, Osteoporosis, Prognosis, Quality of life, Disability, Treatment
Introduction
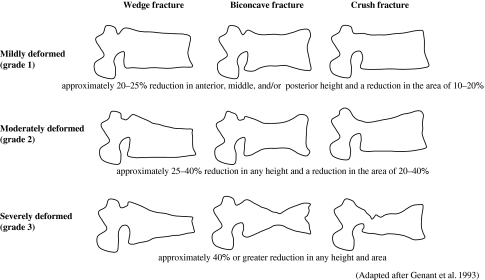
The vertebral body fracture is the most frequent type of osteoporotic fractures [4]. The fracture is usually graded according to its type and deformation (Fig. 1) [19]. The lifetime risk of an osteoporotic vertebral fracture for a woman aged 50 years is estimated at 32% compared with a 15.6% lifetime risk of a hip fracture [9]. It was revealed recently that the natural course of the acute osteoporotic vertebral fracture resulted in severe long lasting pain, disability, reduced activities of daily living (ADL) and low health related quality of life (QoL) at a much higher frequency than earlier assumed [46]. This unsatisfactory situation remained in the majority of fractured patients at least during the subsequent year. There are few apparent explanations in the literature to the long lasting deterioration of health after this particular fracture type.
Fig. 1.
The visual semiquantitative grading system used to determine the grade of fracture deformity in the three fracture types; adapted from Genant et al. [19]
There is limited evidence from studies in women with established osteoporosis that the site of the vertebral deformity may influence both pain intensity and disability [5, 43] and that the number and severity of the fractures influence pain and QoL [24, 35]. Until now almost all the studies of the compression fracture’s relations to the pain, disability and QoL have been retrospective and focused on prevalent fractures [6, 14, 27, 34, 37, 38, 41–43].
There seem to be no studies that prospectively have followed the acute vertebral fracture’s natural course in relation to fracture location (lumbar or thoracic spine), type of fracture (wedge, concave or crush) or grade of fracture deformation (mild, moderate or severe).
The aims of this study were to examine those relations in order to better understand which type of fracture, location or grade of fracture deformation is more painful or disabling in the acute as well as in the chronic phase.
Materials and methods
All patients over 40 years of age who were admitted to the emergency unit at Sahlgrenska University Hospital, Gothenburg, Sweden because of back pain and had a radiologically acute vertebral fracture which resulted from a low energy trauma were eligible for the study. Patients with an acute fracture in earlier fractured spine were also included. The study was conducted from December 2003 until November 2006.
Excluded were those with any other type of acute fracture (forearm, hip etc.), fracture/fractures related to malignancy, infection or any other bone disease, except osteoporosis, that could affect the mechanical integrity of the vertebrae in the lumbar or thoracic spines. The presence or suspicion of more than one acute fracture excluded from the study. Within ten days after the visit to the hospital’s emergency unit, all eligible patients received written information about the study and an invitation to participate. The patients that agreed to participate received a first questionnaire at the latest 3 weeks after the fracture had been diagnosed and then after 3, 6 and 12 months. The questionnaires were self explanatory and intended to be used for postal surveys. The patients returned the filled-in questionnaires which seemed to make later comparisons unlikely. The questionnaires described below were used in the study; all of the questionnaires were used at each of the four follow-up times.
Questionnaires
von Korff’s pain intensity and disability questionnaires
This instrument is self-administered and was designed and validated for use among patients with among others back pain outside the hospital setting [49, 50]. It includes three pain intensity and four disability items. The three pain items ask the patient to rate the back pain intensity right now, the worst pain and the average pain since the start of the pain problem where 0 is “no pain” and 10 is “pain as bad could be”. The Pain intensity score is calculated as the average of the three 0–10 ratings multiplied by 10 to yield a 0–100 score. Low values on the score mean less pain. Three of the disability items also have a ten-graded response possibility. One item is about the interference of the back pain on the daily activities ranging between 0 “no interference” to 10 “unable to carry on any activities” and two are about how the back pain has changed the ability to take part in family, social or recreational activities, or the ability to work (including household) both ranging between 0 “no change” and 10 “extreme change”. The fourth disability question asks about the number of days the patient, due to the pain, has been kept from the usual activities during the last 6 months. This fourth question is not used in this study. The disability score is calculated as the average of three 0–10 interference ratings in daily, social and work activities multiplied by 10 to yield a 0–100 score. Low values on the score means less disability [49, 50]. The scores have been used in several international and Swedish studies of long-term back pain [21, 22].
Hannover ADL score
This questionnaire is also self-administered and consists of 12 items. It assesses functional limitations in ADL among patients with musculoskeletal disorders. Item examples are; “Can you wash and dry yourself from head to toe?” and “Can you raise yourself from a lying position?” The response alternatives are three (circle one); 1. Either unable to do or able only with help (score = 0), 2. Yes, but with some difficulties (score = 1), or 3. Yes, without difficulties (score = 2). The 12 items are scored, summed and transformed on to a scale from 0 (worst back function) to 100 (best back function) [31]. The questionnaire has been used in international and Swedish studies of long-term back pain [20–22].
EQ-5D
This is a generic health-related QoL measure. It provides a single index. The individuals classify their own health status into five dimensions; mobility, self-care, usual activity, pain/discomfort and anxiety/depression within three levels (i.e. no problems, moderate problems and severe problems). The instrument yields a total of 243 possible health states, and the Time Trade Off method is used to rate the different states of health. The value 0 indicates “dead” and 1 indicates “full health” [11, 12]. Negative values are possible and represent conditions worse than dead. In Sweden, the instrument has been validated on extensive cohorts of back pain patients and of ages similar to those expected in the present study [3].
Spinal radiographs
Lateral and frontal view radiographs of the spine were taken at the first visit to the hospital’s emergency unit. The X-ray examination was used for the determination of presence of a fracture, fracture level, fracture type and grade. The presence of an acute fracture was primarily decided by the attending radiologist. For the purpose of the study, two experienced spine surgeons separately re-evaluated the radiograph. A fracture was considered acute when there was an evident sharp edge in the compressed region and no callus formation was visible [2]. In questionable cases, the previous or subsequent examinations were used to confirm the acuteness. When MR images were available, this information was also used for determining if the fracture was acute. Eight patients had their acute fractures confirmed by previous X-rays, 27 patients by subsequent X-rays and 11 patients through MRI. In cases of divergent opinions, the cases were discussed and consensus reached.
Fracture type and grade of fracture deformation
Three osteoporotic fracture types—wedge, crush, and concave—have been described. The wedge fracture has a collapsed anterior border with an intact or almost intact posterior border. The crush fracture means a collapse of the entire vertebral body. Concave fracture shows collapse of the central portion of the vertebral body [40].
The grade of fracture deformation was evaluated by the semi-quantitative method presented by Genant [17–19].
The extent of deformation was graded on visual inspection and without direct vertebral measurement as normal (grade 0), mildly deformed (grade 1, approximately 20–25% reduction in anterior, middle, and/or posterior height and a reduction in the area of 10–20%), moderately deformed (grade 2, approximately 25–40% reduction in any height and a reduction in the area of 20–40%), and severely deformed (grade 3, approximately 40% or greater reduction in any height and area) (Fig. 1).
Treatment
All the patients were mobilized as soon as possible, usually more or less immediately and usually without casts or braces. If pain prevented from such an early mobilization, a soft brace was used. Twelve of the patients used a soft brace for different lengths of time. Analgesics were usually prescribed and the advice to the patient was to try to resume as normal physical activity as possible as soon as possible. The prognosis told was that pain would disappear within weeks to some months. If continuing problems, the patients were recommended contact with their general practitioners.
Preventive treatment
Fourteen of the 107 patients reported that they had taken medication during the year prior to the actual fracture in order to increase their bone mineral.
Statistical analysis
The SPSS 14.0 for Windows was used for analyzing the data.
Parametric tests, independent or paired t tests were used for analyzing difference between groups of parametric scale variables. Differences between groups of nominal variables were tested using the Chi-square test. For comparison of repeated measurements, repeated ANOVA was used. If the repeated ANOVA was significant, the Bonferroni/Dunn procedure was used as a post hoc test. All tests were two-sided. The results were considered to be significant at P < 0.05. A multiple linear regression analysis (stepwise method) was performed to evaluate the influences of combined effect factors.
Ethical approval
The study was ethically approved by the Research Ethical Committee of the Medical Faculty, Gothenburg University, 17 June 2003 (S 270-03).
Results
Study population
A total of 341 patients were invited to participate in the study. Sixty-seven of those actively refused to participate due to old age and/or co-morbidities as the main reasons. One hundred and twenty-two patients did not respond to the invitation, thus were excluded. Five patients had died within the weeks after the fracture episode. One hundred and forty-seven patients accepted to participate. Among the 147 patients, 110 answered the questionnaires at all four of the follow-ups; 29 patients did not answer the 1-year follow-up questionnaires in spite of three reminders, and eight patients died during the 1-year follow-up. Three of 110 patients, underwent vertebroplasty during the follow-up period and thus were excluded. The final analysis included 107 patients followed for 1 year.
Due to internal missing data in the response to von Korff’s disability score, six patients had to be excluded from the analysis of this particular instrument.
The average age for those refraining from participation, irrespective of reason, was 81.1 years (SD 13.2) which was older (P < 0.05) than for those included in the study. There was no difference between the proportion of women and men in the two groups (P > 0.05).
Gender
Thirty-five (32.7%) were male and 72 (67.3%) were female. Among those with a thoracic fracture, 16 (27.6%) were male and 42 (72.4%) were female. Among the lumbar spine fracture patients, 17 (38.8%) were male and 30 (61.2%) were female (P > 0.05). No correlations were found between gender and fracture location, type of fracture or grade of fracture deformation (P > 0.05).
Age
The average age was 75.5 years old (SD 11.9) and ranged between 42 and 96 years.
The average age of the men was 76.1 years old (SD 11.2) and ranged between 43 and 92 years. The average age of the women was 75.3 years old (SD 12.3) and ranged between 42 and 96 years. There was no age difference between the genders (P > 0.05).
The fracture location, type of fracture and grade of fracture deformation were not related to the age of the participants (P > 0.05).
Time elapsed before visiting the emergency unit
Seventy-two (67.3%) of the patients visited the emergency unit within the first week after the fracture episode and the majority of them were within a day. Fifteen (14.9%) waited for 1–3 weeks before they visited the hospital. Nineteen (17.8%) could not distinctly clarify how long they had waited before they visited the hospital.
Fracture location
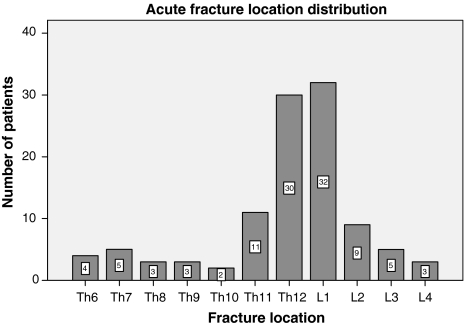
The levels of the acute fractures can be seen in Fig. 2. There were 58 thoracic and 49 lumbar fractures. The fracture was most common at T12–L1.
Fig. 2.
The level and occurrence of the acute fracture in the 107 patients
Type of fracture
There were 69% wedge, 19% concave and 12% crush fractures.
There were no differences between the proportions of the different fracture types in the thoracic or lumbar spines (P > 0.05).
When the spine was divided into thoracic (Th6–Th11), thoracolumbar (Th12 and L1) and lumbar spine (L2–L4) sections, the thoracic and the thoracolumbar spines had a higher proportion of wedge fractures than the lumbar spine (P < 0.01) and the lumbar spine included relatively more concave fractures than the thoracic and thoracolumbar spine (P < 0.01) (Table 1).
Table 1.
The number of acute fractures and their type in the thoracic (Th6–Th11), thoracolumbar (Th12 and L1) and the lumbar (L2–L4) spines
| Fracture type | Total | |||
|---|---|---|---|---|
| Wedge | Concave | Crush | ||
| Th6 to Th11 | 22 (76*) | 2 (7) | 5 (17) | 29 (100) |
| Th12 and L1 | 43 (72*) | 9 (15) | 8 (13) | 60 (100) |
| L2 to L4 | 9 (50) | 9 (50*) | 0 (0) | 18 (100) |
| Total | 74 (69) | 20 (19) | 13 (12) | 107 (100) |
Values represent number (%)
* P < 0.01
Grade of fracture deformation
There were 20.6% mildly, 46.7% moderately and 32.7% severely deformed vertebrae. The predominance of moderately deformed vertebrae was statistically significant (P = 0.004).
The grade of fracture deformation was not related to gender, age or fracture location. On the other hand the type of fracture correlated with the degree of fracture deformation in such a way that the crush fracture type more frequently meant severe fracture deformation (P < 0.000) (Table 2).
Table 2.
Type of fracture and grade of deformation among the 107 acute vertebral fractures
| Fracture type | Grade of deformation | Total | ||
|---|---|---|---|---|
| Mild | Moderate | Severe | ||
| Wedge | 13 (17.6) | 40 (54.1) | 21 (28.4) | 74 (100.0) |
| Concave | 9 (45.0) | 9 (45.0) | 2 (10.0) | 20 (100.0) |
| Crush | 0 (0) | 1 (7.7) | 12 (92.3*) | 13 (100.0) |
| Total | 22 (20.6) | 50 (46.7) | 35 (32.7) | 107 (100.0) |
Values represent number (%)
* P < 0.000
Questionnaire results
Thoracic spine versus lumbar spine
All outcome measures, pain, disability, ADL and QoL, showed an improvement between the 3 weeks and the three months follow ups irrespective of fracture location. For patients with the fracture occurring in the thoracic spine, the scores of all the questionnaires marked statistically significant improvements. For patients with fractures in the lumbar spine, the early improvement was statistically significant for pain intensity and disability only (von Korff’s pain intensity and disability score) (Table 3). There was, however, no statistically significant difference between the thoracic or lumbar spines in any of the outcome measures at any time during the 1-year follow up.
Table 3.
The outcome scores in the thoracic and lumbar spines separately after 3 weeks, 3, 6 and 12 months
| Time | Thoracic spine (n = 58) (n = 55)§ | Lumbar spine (n = 49) (n = 46)§ | Difference between T/S and L/S | |||
|---|---|---|---|---|---|---|
| Mean | SD | Mean | SD | P | ||
| von Korff’s pain intensity score | 3 weeks | 70.7 | 21.9 | 71.0 | 16.0 | NS |
| 3 months | 62.1* | 21.0 | 60.7* | 22.0 | NS | |
| 6 months | 62.0* | 20.1 | 59.2* | 23.3 | NS | |
| 12 months | 63.8* | 21.0 | 56.6* | 24.8 | NS | |
| von Korff’s disability score | 3 weeks | 66.5 | 23.9 | 71.8 | 23.2 | NS |
| 3 months | 54.1* | 24.1 | 59.0* | 27.1 | NS | |
| 6 months | 50.0* | 25.0 | 52.3* | 30.5 | NS | |
| 12 months | 54.7* | 24.8 | 53.0* | 31.3 | NS | |
| EQ-5D | 3 weeks | 0.38 | 0.37 | 0.37 | 0.37 | NS |
| 3 months | 0.58* | 0.27 | 0.45 | 0.43 | NS | |
| 6 months | 0.56* | 0.31 | 0.52* | 0.41 | NS | |
| 12 months | 0.51 | 0.36 | 0.53* | 0.41 | NS | |
| Hannover ADL score | 3 weeks | 36.8 | 23.0 | 38.9 | 21.1 | NS |
| 3 months | 49.8* | 23.4 | 45.8 | 26.8 | NS | |
| 6 months | 45.7* | 24.8 | 45.9 | 28.3 | NS | |
| 12 months | 45.7* | 24.8 | 49.8* | 28.2 | NS | |
NS not significant
* Comparison with 3 weeks result, significant difference P < 0.05
§Number of patients for the von Korff’s disability score analysis = total 101 patients
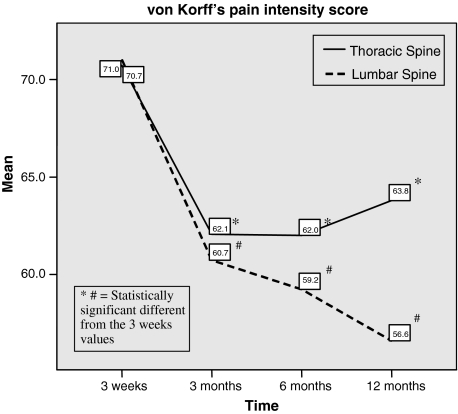
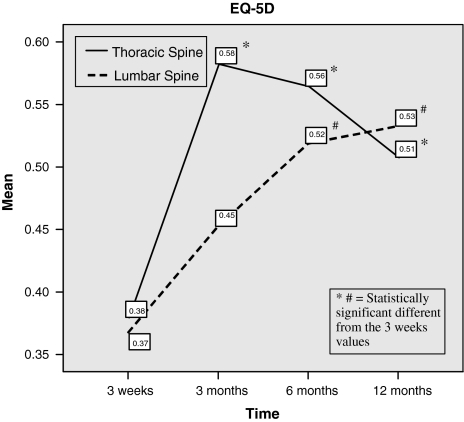
As can be seen in Figs. 3 and 4, in the lumbar spine it was a tendency of a slight but continuous improvement also after the substantial initial improvements. After the early improvement in the thoracic spine on the other hand the tendency was that of a gradual deterioration.
Fig. 3.
The von Korff’s pain intensity score 3 weeks 3, 6 and 12 months after the acute vertebral fracture in the thoracic and lumbar spines
Fig. 4.
The EQ-5D score 3 weeks 3, 6 and 12 months after the acute vertebral fracture in the thoracic and lumbar spines
Similar tendencies of differences between thoracic or lumbar fracture were noted when the five different dimensions of the EQ-5Ds were analyzed separately. The only exception in this respect was the behavior in the pain/discomfort dimension that was also the dimension with the highest inclusion of problems rated as severe (Table 4).
Table 4.
The five dimensions of the EQ-5D for the thoracic and lumbar spines separately and the relative number of patients reporting no, moderate or severe problems at the four measuring occasions the year after an acute vertebral fracture
| Time | Thoracic spine (%) (n = 58) | Lumbar spine (%) (n = 49) | |||||
|---|---|---|---|---|---|---|---|
| No problem | Moderate problem | Severe problem | No problem | Moderate problem | Severe problem | ||
| Mobility | 3 weeks | 37.9 | 58.6 | 3.4 | 40.8 | 57.1 | 2.0 |
| 3 months | 50.0 | 50.0 | 0.0 | 42.9 | 51.0 | 6.1 | |
| 6 months | 51.7 | 48.3 | 0.0 | 49.0 | 42.9 | 8.2 | |
| 12 months | 46.6 | 50.0 | 3.4 | 44.9 | 49.0 | 6.1 | |
| Self-care | 3 weeks | 75.9 | 22.4 | 1.7 | 79.6 | 14.3 | 6.1 |
| 3 months | 87.9 | 12.1 | 0.0 | 81.6 | 16.3 | 2.0 | |
| 6 months | 86.2 | 12.1 | 1.7 | 85.7 | 12.2 | 2.0 | |
| 12 months | 87.9 | 8.6 | 3.4 | 87.8 | 10.2 | 2.0 | |
| Usual activity | 3 weeks | 17.2 | 55.2 | 27.6 | 18.4 | 53.1 | 28.6 |
| 3 months | 25.9 | 60.3 | 13.8 | 36.7 | 38.8 | 24.5 | |
| 6 months | 22.4 | 63.8 | 13.8 | 40.8 | 36.7 | 22.4 | |
| 12 months | 22.4 | 62.1 | 15.5 | 42.9 | 42.9 | 14.3 | |
| Pain/discomfort | 3 weeks | 5.2 | 56.9 | 37.9 | 0.0 | 63.3 | 36.7 |
| 3 months | 6.9 | 81.0 | 12.1 | 16.3 | 51.0 | 32.7 | |
| 6 months | 10.3 | 72.4 | 17.2 | 16.3 | 63.3 | 20.4 | |
| 12 months | 10.3 | 65.5 | 24.1 | 12.2 | 63.3 | 24.5 | |
| Anxiety/depression | 3 weeks | 24.1 | 63.8 | 12.1 | 30.6 | 55.1 | 14.3 |
| 3 months | 37.9 | 58.6 | 3.4 | 49.0 | 38.8 | 12.2 | |
| 6 months | 51.7 | 43.1 | 5.2 | 42.9 | 44.9 | 12.2 | |
| 12 months | 37.9 | 53.4 | 8.6 | 53.1 | 36.7 | 10.2 | |
When the thoracolumbar fractures were analyzed separately and compared with the thoracic and lumbar fractures, no statistically significant differences could be detected between any of them.
Separate vertebral levels
When all the represented fractured levels (Th6 to L4) were tested separately, it was not possible to detect any major differences.
Type of fracture
For the wedge fracture type, all scores improved in a statistically significant way between the initial measurement and the three months follow-up (Table 5). After three months, the scores for the wedge fractures remained at this improved, however, far from normalized level.
Table 5.
The outcome score values for the three different fracture types separately after 3 weeks, 3, 6 and 12 months
| Time | Wedge (n = 74) (n = 69)§ | Concave (n = 20) (n = 19)§ | Crush (n = 13) (n = 13)§ | Difference between type | ||||
|---|---|---|---|---|---|---|---|---|
| Mean | SD | Mean | SD | Mean | SD | P | ||
| von Korff’s pain intensity score | 3 weeks | 70.1 | 19.9 | 72.5 | 18.4 | 72.3 | 18.4 | NS |
| 3 months | 60.6* | 20.7 | 58.8* | 24.7 | 70.2 | 18.6 | NS | |
| 6 months | 59.8* | 22.3 | 60.7* | 21.5 | 66.2 | 18.1 | NS | |
| 12 months | 60.0* | 21.7 | 56.7* | 26.9 | 69.3 | 23.1 | NS | |
| von Korff’s disability score | 3 weeks | 67.4 | 23.7 | 72.6 | 25.3 | 71.8 | 21.5 | NS |
| 3 months | 56.0* | 25.6 | 57.7 | 24.6 | 56.5 | 28.0 | NS | |
| 6 months | 49.4* | 27.5 | 53.0* | 28.2 | 56.9 | 28.0 | NS | |
| 12 months | 53.9* | 27.2 | 50.5* | 29.6 | 59.0 | 29.8 | NS | |
| EQ-5D | 3 weeks | 0.39 | 0.37 | 0.33 | 0.37 | 0.37 | 0.37 | NS |
| 3 months | 0.56* | 0.32 | 0.53* | 0.34 | 0.29 | 0.48 | 0.042# | |
| 6 months | 0.57* | 0.33 | 0.55* | 0.32 | 0.40 | 0.54 | NS | |
| 12 months | 0.51* | 0.37 | 0.63* | 0.29 | 0.39 | 0.53 | NS | |
| Hannover ADL score | 3 weeks | 37.4 | 22.5 | 37.7 | 19.9 | 39.4 | 24.6 | NS |
| 3 months | 50.8* | 25.6 | 40.7 | 19.9 | 43.3 | 26.9 | NS | |
| 6 months | 47.5* | 26.8 | 41.5 | 23.2 | 42.7 | 29.0 | NS | |
| 12 months | 48.1* | 27.0 | 46.9 | 23.6 | 45.8 | 28.8 | NS | |
NS not significant
#Between wedge and crush fracture difference
* Compared with the 3 weeks result, significant difference P < 0.05
§Number of patients for the von Korff’s disability score analysis = total 101 patients
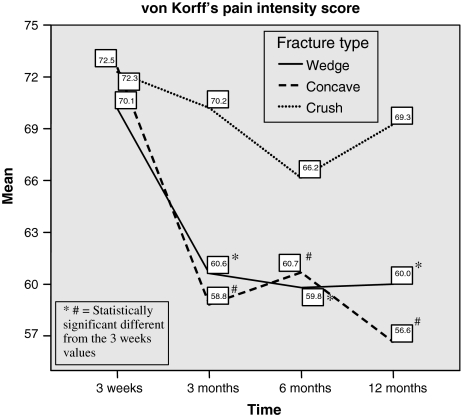
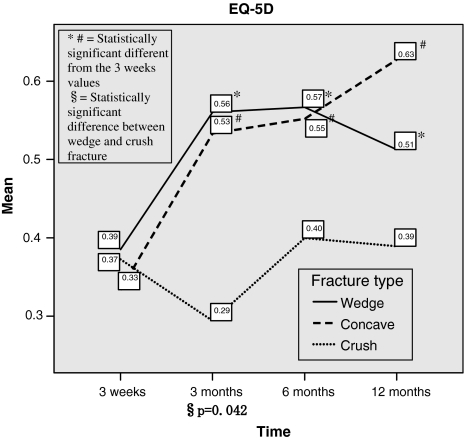
The concave fracture type improved steadily through the follow-up year but still without normalizing at the end of the study. Distinctly the crush fracture type had the worst prognosis for all outcome measures. The initial improvement was of a lower magnitude and none of the 1-year scores were significantly differing from the initial situation (P > 0.05) (Table 5, Figs. 5, 6).
Fig. 5.
Diagram of the development of von Korff’s pain intensity score in the three different fracture types during the year after an acute vertebral fracture
Fig. 6.
The EQ-5D scores in the wedge, concave and crush fracture types at the four different follow up occasions
Grade of fracture deformation
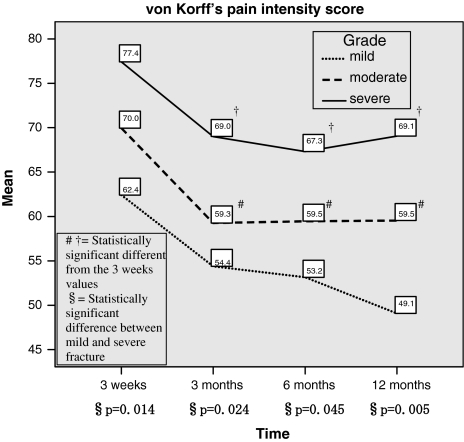
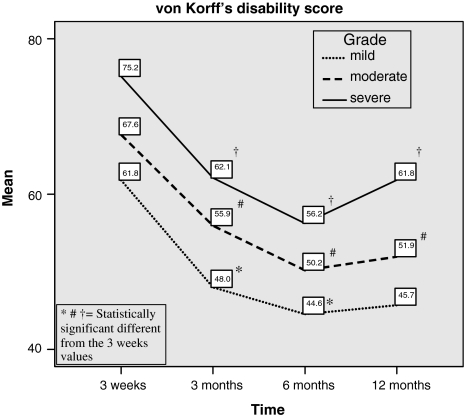
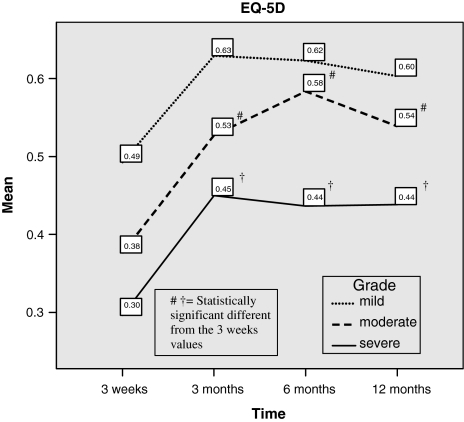
The general tendency of the greatest improvement occurring during the first three months held true also for the three grades of fracture deformation. It was striking except for the Hannover ADL score that the three deformation grades represented three quite distinct severity entities of pain intensity, disability and QoL (Table 6). That was particularly evident when the development of pain intensity, disability and QoL was presented graphically (Figs. 7, 8, 9).
Table 6.
The grade of fracture deformation and its relation to pain intensity, disability, activities of daily living and quality of life during the year after the acute fracture
| Time | Mild (n = 22) (n = 20)§ | Moderate (n = 50) (n = 48)§ | Severe (n = 35) (n = 33)§ | Difference between grade | ||||
|---|---|---|---|---|---|---|---|---|
| Mean | SD | Mean | SD | Mean | SD | P | ||
| von Korff’s pain intensity score | 3 weeks | 62.4 | 24.0 | 70.0 | 19.2 | 77.4 | 13.6 | 0.014# |
| 3 months | 54.4 | 27.0 | 59.3* | 21.5 | 69.0* | 14.4 | 0.024# | |
| 6 months | 53.2 | 26.0 | 59.5* | 21.8 | 67.3* | 16.3 | 0.045# | |
| 12 months | 49.1 | 26.8 | 59.5* | 22.9 | 69.1* | 16.8 | 0.005# | |
| von Korff’s disability score | 3 weeks | 61.8 | 23.3 | 67.6 | 25.9 | 75.2 | 19.0 | NS |
| 3 months | 48.0* | 24.2 | 55.9* | 26.4 | 62.1* | 24.0 | NS | |
| 6 months | 44.6* | 26.1 | 50.2* | 29.6 | 56.2* | 24.9 | NS | |
| 12 months | 45.7 | 28.3 | 51.9* | 29.0 | 61.8* | 24.3 | NS | |
| EQ-5D | 3 weeks | 0.49 | 0.31 | 0.38 | 0.39 | 0.30 | 0.36 | NS |
| 3 months | 0.63 | 0.32 | 0.53* | 0.35 | 0.45 | 0.38 | NS | |
| 6 months | 0.62 | 0.30 | 0.58* | 0.33 | 0.44 | 0.41 | NS | |
| 12 months | 0.60 | 0.36 | 0.54* | 0.34 | 0.44 | 0.44 | NS | |
| Hannover ADL score | 3 weeks | 42.3 | 20.0 | 40.6 | 23.9 | 30.8 | 19.3 | NS |
| 3 months | 52.5 | 23.7 | 48.5* | 26.4 | 44.3* | 23.9 | NS | |
| 6 months | 47.0 | 28.6 | 48.7* | 26.7 | 40.8* | 24.3 | NS | |
| 12 months | 59.5* | 25.5 | 46.1 | 26.8 | 42.2* | 24.7 | 0.047# | |
NS not significant
#Between mild and severe fracture difference
* Compare with 3 weeks result, significant difference P < 0.05
§Number of patients for the von Korff’s disability score analysis = total 101 patients
Fig. 7.
The average pain intensity in mildly, moderately and severely deformed acute fractures acutely and after 3, 6 and 12 months
Fig. 8.
The obvious differences in disability depending on the grade of fracture deformation the year after an acute vertebral fracture
Fig. 9.
The quality of life (EQ-5D) the year after an acute vertebral fracture and its relation to the grade of fracture deformation
Multiple linear regression analysis
When gender, age, fracture location (Th or L), type of fracture and grade of fracture deformity were entered as independent variables and tested against each questionnaire (dependent variable), several statistically significant relations were found (Table 7).
Table 7.
The statistically significant relations from the multiple linear regression analysis when the score of each of the four outcome questionnaires after 3 weeks, 3, 6 and 12 months (dependent factors) was tested against factors like fracture type, deformation severity, etc. (independent factors)
| Time | Effect factor 1 (β) | Effect factor 2 (β) | Effect factor 3 (β) | Adjusted R2 (P) | |
|---|---|---|---|---|---|
| von Korff’s pain intensity score | 3 weeks | Severe fracture (0.239)↑ | 0.048 (0.013) | ||
| 3 months | Severe fracture (0.244)↑ | Male (−0.221)↓ | 0.093 (0.002) | ||
| 6 months | Severe fracture (0.214)↑ | 0.037 (0.027) | |||
| 12 months | Severe fracture (0.261)↑ | 0.059 (0.007) | |||
| von Korff’s disability score | 3 weeks | Mild fracture (−0.224)↓ | 0.041 (0.021) | ||
| 12 months | Severe fracture (0.197)↑ | 0.029 (0.043) | |||
| EQ-5D | 3 months | Male (0.193)↑ | Crush fracture (−0.226)↓ | Th fracture (0.219)↑ | 0.108 (0.002) |
| 6 months | Severe fracture (−0.209)↓ | 0.035 (0.031) | |||
| Hannover ADL score | 3 weeks | Male (0.297)↑ | Severe fracture (−0.318)↓ | Crush fracture (0.220)↑ | 0.133 (0.001) |
| 3 months | Male (0.301)↑ | 0.082 (0.002) | |||
| 6 months | Male (0.198)↑ | 0.030 (0.041) | |||
| 12 months | Male (0.194)↑ | Mild fracture (0.204)↑ | 0.072 (0.007) |
β Indicate standardized partial regression coefficient
Discussion
The acute osteoporotic vertebral body fracture leads, in more than 4/5 of all fractured patients, to a long-lasting, painful and disabling condition deteriorating the patients’ QoL [46]. This study showed that the factor most significantly interrelated to this pitiful situation was the severity of fracture deformation (Table 7).
Factors like fracture level, type of fracture and gender influenced to a lesser extent pain, disability and QoL during the year after the fracture.
Grade of fracture deformation
The final multiple linear regression analysis showed that especially the severe grade of fracture deformation influenced the outcome factors in a significant way (Table 7). That severe vertebral fracture deformities were associated with chronic and severe back pain and greater limitation of the activity involving the back has been shown earlier [14, 32]. Although it seems reasonable that the greatest deformation creates the worst problems, the exact mechanisms for that are still unknown. One such mechanism was revealed when dynamic contrast enhanced MRI was performed [28]. This study showed that the crush fracture caused more subsequent collapse than the other fracture types. The crush type of fracture was likely to injure the perfusion to the vertebral body. In the present study the crush fracture type by far had the highest inclusion of severely deformed vertebrae (Table 2). It is possible that especially the severely deformed crush fracture may undergo a continuous collapse similar to and for the same circulatory reasons as the collapse often seen in the head of femur after dislocated cervical neck fractures. But without any repeat X-ray examinations after the index one, the current study could not confirm or reject the possibilities of a continuous collapse occurring predominantly in the crush or severely deformed fractures.
In less deformed fractures development of instability, pseudarthrosis, gibbus formation with disturbances of the loading conditions and the postural muscular control of the fractured segment have been suggested as pain and disability mechanisms [13, 23, 30, 47].
Type of fracture
There are few studies that have evaluated the long term effects of vertebral fracture type. No differences in pain or disability were found when wedge, concave (endplate) or crush fracture types were compared in a cross-sectional study [14]. When random samples of men and women above 50 years of age were recruited from 30 European centers, all three fracture types were linked to an adverse outcome in a similar way [26].
In this study the acute wedge and concave fracture types resulted in less pain and better QoL than the crush fracture type (Figs. 5, 6). It is reasonable to assume that the somewhat milder symptoms after wedge or concave fractures mostly was explained by the fact that those types included a much higher portion of mildly or moderately grades of fracture deformation (Table 2). As already mentioned, the crush fracture type included an exceptionally high portion of severely deformed fractures.
Fracture location
The acute fracture was most common at Th12–L1 in this prospective study. That was in agreement with previous studies [7, 33].
Few reports about the relationship between fracture location and pain, disability, ADL or QoL have been localized. Two previous studies have shown that prevalent lumbar vertebral compression fractures lead to lower QoL and more severe pain than the prevalent thoracic vertebral fracture [5, 38]. A stabilizing effect of the thoracic cage has been suggested as a reason for fewer problems after thoracic fractures [38]. The findings in the present study suggested a different development at least during the first post fracture year between fractures in the thoracic and lumbar spines. While the lumbar fractures tended to improve steadily for the rest of the year, the thoracic fractures tended to deteriorate after the initial three months improvement noted in both the lumbar and thoracic spines (Fig. 3, 4). The fact that thoracic fractures are correlated with the kyphotic change of the thoracic spine and an increased kyphosis has been related to pain and disability possibly due to an increased intramuscular back muscle pressure and accompanying ischemia causing muscle fatigue could be a more reasonable explanation to the findings in the thoracic spine noted in the current study [8, 10, 13, 15, 32, 47].
Gender difference
The multiple linear regression analysis also showed that gender differences influenced the outcome factors significantly (Table 6).
Several studies of different back problems have found that women consistently report more functional limitations and physical disability and slower recovery from disability than men [1, 22, 36, 39]. The common finding has been that women are more likely to report or over report ill health and disability while men tend to underreport their infirmities [25, 29, 48]. The higher prevalence of not only osteoporotic vertebral fractures but also other disabling conditions like osteoarthritis and chronic joint pain but also spinal stenosis and other degenerative spine disorders among women are factors that contribute to the higher reporting of functional limitation [16, 45, 48].
Limitation
The number of the patients is too limited to allow a proper analysis of the effect of, e.g. fracture level.
The absence of imaging follow-ups made it impossible to detect subsequent changes among the fractured patients like progressive collapses, new fractures, gibbus formation, etc., all changes that could contribute to and maintain the symptoms.
The severity of the outcome in this study could at least to a certain extent be influenced by other health conditions. It is well known for example that QoL in older populations generally is affected by many conditions such as cardiovascular disease, diabetes and other chronic illnesses [44].
A high number of patients refused to participate in this study. The dominating reason was old age, with difficulties to read, write, etc. For such reasons it seems impossible to include the oldest and the sickest in a study like this although they might be those most negatively affected by the fracture. We therefore suppose that inclusion of the refusals would have made the results of this study even worse.
Conclusion
This study showed that the factor most significantly predicting both severity and longevity of the symptoms after an acute low energy vertebral compression fracture was the severity of fracture deformation. The presence of a severely deformed acute fracture caused with few exceptions severe pain, deteriorated disability, ADL and QoL at least during the first post fracture year.
Factors like fracture level, lumbar fractures tended to improve steadily while thoracic deteriorated, type of fracture, the wedge and concave resulting in less pain and better QoL than the crush fracture type and gender influenced to a lesser extent the outcomes during the year after the acute fracture.
Open Access
This article is distributed under the terms of the Creative Commons Attribution Noncommercial License which permits any noncommercial use, distribution, and reproduction in any medium, provided the original author(s) and source are credited.
References
- 1.Beckett LA, Brock DB, Lemke JH, Mendes de Leon CF, Guralnik JM, Fillenbaum GG, Branch LG, Wetle TT, Evans DA (1996) Analysis of change in self-reported physical function among older persons in four population studies. Am J Epidemiol 143:766–778 [DOI] [PubMed]
- 2.Bengner U, Johnell O, Redlund-Johnell I (1988) Changes in incidence and prevalence of vertebral fractures during 30 years. Calcif Tissue Int 42:293–296. doi:10.1007/BF02556362 [DOI] [PubMed]
- 3.Burstrom K, Johannesson M, Rehnberg C (2007) Deteriorating health status in Stockholm 1998–2002: results from repeated population surveys using the EQ-5D. Qual Life Res 16:1547–1553. doi:10.1007/s11136-007-9243-z [DOI] [PubMed]
- 4.Cauley JA, Hochberg MC, Lui LY, Palermo L, Ensrud KE, Hillier TA, Nevitt MC, Cummings SR (2007) Long-term risk of incident vertebral fractures. JAMA 298:2761–2767. doi:10.1001/jama.298.23.2761 [DOI] [PubMed]
- 5.Cockerill W, Ismail AA, Cooper C, Matthis C, Raspe H, Silman AJ, O’Neill TW (2000) Does location of vertebral deformity within the spine influence back pain and disability? European Vertebral Osteoporosis Study (EVOS) Group. Ann Rheum Dis 59:368–371. doi:10.1136/ard.59.5.368 [DOI] [PMC free article] [PubMed]
- 6.Cook DJ, Guyatt GH, Adachi JD, Clifton J, Griffith LE, Epstein RS, Juniper EF (1993) Quality of life issues in women with vertebral fractures due to osteoporosis. Arthritis Rheum 36:750–756. doi:10.1002/art.1780360603 [DOI] [PubMed]
- 7.Cooper C, Atkinson EJ, O’Fallon WM, Melton LJ 3rd (1992) Incidence of clinically diagnosed vertebral fractures: a population-based study in Rochester, Minnesota, 1985–1989. J Bone Miner Res 7:221–227 [DOI] [PubMed]
- 8.Cortet B, Roches E, Logier R, Houvenagel E, Gaydier-Souquieres G, Puisieux F, Delcambre B (2002) Evaluation of spinal curvatures after a recent osteoporotic vertebral fracture. Joint Bone Spine 69:201–208. doi:10.1016/S1297-319X(02)00381-0 [DOI] [PubMed]
- 9.Cummings SR, Black DM, Rubin SM (1989) Lifetime risks of hip, Colles’, or vertebral fracture and coronary heart disease among white postmenopausal women. Arch Intern Med 149:2445–2448. doi:10.1001/archinte.149.11.2445 [DOI] [PubMed]
- 10.De Smet AA, Robinson RG, Johnson BE, Lukert BP (1988) Spinal compression fractures in osteoporotic women: patterns and relationship to hyperkyphosis. Radiology 166:497–500 [DOI] [PubMed]
- 11.Dolan P, Gudex C, Kind P, Williams A (1996) The time trade-off method: results from a general population study. Health Econ 5:141–154. doi :10.1002/(SICI)1099-1050(199603)5:2<141::AID-HEC189>3.0.CO;2-N [DOI] [PubMed]
- 12.Dolan P, Gudex C, Kind P, Williams A (1996) Valuing health states: a comparison of methods. J Health Econ 15:209–231. doi:10.1016/0167-6296(95)00038-0 [DOI] [PubMed]
- 13.Ensrud KE, Black DM, Harris F, Ettinger B, Cummings SR (1997) Correlates of kyphosis in older women. The Fracture Intervention Trial Research Group. J Am Geriatr Soc 45:682–687 [DOI] [PubMed]
- 14.Ettinger B, Black DM, Nevitt MC, Rundle AC, Cauley JA, Cummings SR, Genant HK (1992) Contribution of vertebral deformities to chronic back pain and disability. The Study of Osteoporotic Fractures Research Group. J Bone Miner Res 7:449–456 [DOI] [PubMed]
- 15.Finsen V (1988) Osteoporosis and back pain among the elderly. Acta Med Scand 223:443–449 [DOI] [PubMed]
- 16.Fries JF, Spitz P, Kraines RG, Holman HR (1980) Measurement of patient outcome in arthritis. Arthritis Rheum 23:137–145. doi:10.1002/art.1780230202 [DOI] [PubMed]
- 17.Genant HK, Jergas M (2003) Assessment of prevalent and incident vertebral fractures in osteoporosis research. Osteoporos Int 14(Suppl 3):S43–S55. doi:10.1007/s00198-003-1472-6 [DOI] [PubMed]
- 18.Genant HK, Jergas M, Palermo L, Nevitt M, Valentin RS, Black D, Cummings SR (1996) Comparison of semiquantitative visual and quantitative morphometric assessment of prevalent and incident vertebral fractures in osteoporosis The Study of Osteoporotic Fractures Research Group. J Bone Miner Res 11:984–996 [DOI] [PubMed]
- 19.Genant HK, Wu CY, van Kuijk C, Nevitt MC (1993) Vertebral fracture assessment using a semiquantitative technique. J Bone Miner Res 8:1137–1148 [DOI] [PubMed]
- 20.Hansson E, Hansson T (2007) The cost-utility of lumbar disc herniation surgery. Eur Spine J 16:329–337. doi:10.1007/s00586-006-0131-y [DOI] [PMC free article] [PubMed]
- 21.Hansson E, Hansson T, Jonsson R (2006) Predictors for work ability and disability in men and women with low-back or neck problems. Eur Spine J 15:780–793. doi:10.1007/s00586-004-0863-5 [DOI] [PMC free article] [PubMed]
- 22.Hansson TH, Hansson EK (2000) The effects of common medical interventions on pain, back function, and work resumption in patients with chronic low back pain: a prospective 2-year cohort study in six countries. Spine 25:3055–3064. doi:10.1097/00007632-200012010-00013 [DOI] [PubMed]
- 23.Hashidate H, Kamimura M, Nakagawa H, Takahara K, Uchiyama S (2006) Pseudoarthrosis of vertebral fracture: radiographic and characteristic clinical features and natural history. J Orthop Sci 11:28–33. doi:10.1007/s00776-005-0967-8 [DOI] [PubMed]
- 24.Huang C, Ross PD, Wasnich RD (1996) Vertebral fractures and other predictors of back pain among older women. J Bone Miner Res 11:1026–1032 [DOI] [PubMed]
- 25.Hubert HB, Bloch DA, Fries JF (1993) Risk factors for physical disability in an aging cohort: the NHANES I epidemiologic followup study. J Rheumatol 20:480–488 [PubMed]
- 26.Ismail AA, Cooper C, Felsenberg D, Varlow J, Kanis JA, Silman AJ, O’Neill TW (1999) Number and type of vertebral deformities: epidemiological characteristics and relation to back pain and height loss. European Vertebral Osteoporosis Study Group. Osteoporos Int 9:206–213. doi:10.1007/s001980050138 [DOI] [PubMed]
- 27.Jinbayashi H, Aoyagi K, Ross PD, Ito M, Shindo H, Takemoto T (2002) Prevalence of vertebral deformity and its associations with physical impairment among Japanese women: the Hizen-Oshima study. Osteoporos Int 13:723–730. doi:10.1007/s001980200099 [DOI] [PubMed]
- 28.Kanchiku T, Taguchi T, Toyoda K, Fujii K, Kawai S (2003) Dynamic contrast-enhanced magnetic resonance imaging of osteoporotic vertebral fracture. Spine 28:2522–2526 (discussion 2522). doi:10.1097/01.BRS.0000092384.29767.85 [DOI] [PubMed]
- 29.Kandrack MA, Grant KR, Segall A (1991) Gender differences in health related behaviour: some unanswered questions. Soc Sci Med 32:579–590 [DOI] [PubMed]
- 30.Keller TS, Harrison DE, Colloca CJ, Harrison DD, Janik TJ (2003) Prediction of osteoporotic spinal deformity. Spine 28:455–462. doi:10.1097/00007632-200303010-00009 [DOI] [PubMed]
- 31.Kohlmann T, Raspe H (1996) Hannover functional questionnaire in ambulatory diagnosis of functional disability caused by backache. Rehabilitation 35:I–VIII [PubMed]
- 32.Leidig G, Minne HW, Sauer P, Wuster C, Wuster J, Lojen M, Raue F, Ziegler R (1990) A study of complaints and their relation to vertebral destruction in patients with osteoporosis. Bone Miner 8:217–229. doi:10.1016/0169-6009(90)90107-Q [DOI] [PubMed]
- 33.Lunt M, O’Neill TW, Felsenberg D, Reeve J, Kanis JA, Cooper C, Silman AJ (2003) Characteristics of a prevalent vertebral deformity predict subsequent vertebral fracture: results from the European prospective osteoporosis study (EPOS). Bone 33:505–513. doi:10.1016/S8756-3282(03)00248-5 [DOI] [PubMed]
- 34.Lyles KW, Gold DT, Shipp KM, Pieper CF, Martinez S, Mulhausen PL (1993) Association of osteoporotic vertebral compression fractures with impaired functional status. Am J Med 94:595–601. doi:10.1016/0002-9343(93)90210-G [DOI] [PubMed]
- 35.Matthis C, Weber U, O’Neill TW, Raspe H (1998) Health impact associated with vertebral deformities: results from the European vertebral osteoporosis study (EVOS). Osteoporos Int 8:364–372. doi:10.1007/s001980050076 [DOI] [PubMed]
- 36.Murtagh KN, Hubert HB (2004) Gender differences in physical disability among an elderly cohort. Am J Public Health 94:1406–1411 [DOI] [PMC free article] [PubMed]
- 37.Nevitt MC, Ettinger B, Black DM, Stone K, Jamal SA, Ensrud K, Segal M, Genant HK, Cummings SR (1998) The association of radiographically detected vertebral fractures with back pain and function: a prospective study. Ann Intern Med 128:793–800 [DOI] [PubMed]
- 38.Oleksik A, Lips P, Dawson A, Minshall ME, Shen W, Cooper C, Kanis J (2000) Health-related quality of life in postmenopausal women with low BMD with or without prevalent vertebral fractures. J Bone Miner Res 15:1384–1392. doi:10.1359/jbmr.2000.15.7.1384 [DOI] [PubMed]
- 39.Penning MJ, Strain LA (1994) Gender differences in disability, assistance, and subjective well-being in later life. J Gerontol 49:S202–S208 [DOI] [PubMed]
- 40.Rao RD, Singrakhia MD (2003) Painful osteoporotic vertebral fracture. Pathogenesis, evaluation, and roles of vertebroplasty and kyphoplasty in its management. J Bone Joint Surg 85-A:2010–2022 [PubMed]
- 41.Ross PD (1997) Clinical consequences of vertebral fractures. Am J Med 103:30S–42S (discussion 42S–43S). doi:10.1016/S0002-9343(97)90025-5 [DOI] [PubMed]
- 42.Ross PD, Ettinger B, Davis JW, Melton LJ 3rd, Wasnich RD (1991) Evaluation of adverse health outcomes associated with vertebral fractures. Osteoporos Int 1:134–140. doi:10.1007/BF01625442 [DOI] [PubMed]
- 43.Ryan PJ, Blake G, Herd R, Fogelman I (1994) A clinical profile of back pain and disability in patients with spinal osteoporosis. Bone 15:27–30. doi:10.1016/8756-3282(94)90887-7 [DOI] [PubMed]
- 44.Silverman SL, Minshall ME, Shen W, Harper KD, Xie S (2001) The relationship of health-related quality of life to prevalent and incident vertebral fractures in postmenopausal women with osteoporosis: results from the multiple outcomes of raloxifene evaluation study. Arthritis Rheum 44:2611–2619. doi :10.1002/1529-0131(200111)44:11<2611::AID-ART441>3.0.CO;2-N [DOI] [PubMed]
- 45.Stromqvist B, Fritzell P, Hagg O, Jonsson B (2005) One-year report from the Swedish national spine register. Swedish society of spinal surgeons. Acta Orthop 76:1–24. doi:10.1080/17453690510041950 [DOI] [PubMed]
- 46.Suzuki N, Ogikubo O, Hansson T (2008) The course of the acute vertebral body fragility fracture: its effect on pain, disability and quality of life during 12 months. Eur Spine J 17:1380–1390. doi:10.1007/s00586-008-0753-3 [DOI] [PMC free article] [PubMed]
- 47.Takahashi I, Kikuchi S, Sato K, Iwabuchi M (2007) Effects of the mechanical load on forward bending motion of the trunk: comparison between patients with motion-induced intermittent low back pain and healthy subjects. Spine 32:E73–E78. doi:10.1097/01.brs.0000252203.16357.9a [DOI] [PubMed]
- 48.Verbrugge LM, Wingard DL (1987) Sex differentials in health and mortality. Women Health 12:103–145. doi:10.1300/J013v12n02_07 [DOI] [PubMed]
- 49.Von Korff M, Deyo RA, Cherkin D, Barlow W (1993) Back pain in primary care. Outcomes at 1 year. Spine 18:855–862. doi:10.1097/00007632-199306000-00008 [DOI] [PubMed]
- 50.Von Korff M, Ormel J, Keefe FJ, Dworkin SF (1992) Grading the severity of chronic pain. Pain 50:133–149. doi:10.1016/0304-3959(92)90154-4 [DOI] [PubMed]


