

Abstract
Gene transfer has proven to be an effective neurobiological tool in a number of neurodegenerative diseases, but it is not known if it can correct a sleep disorder. Narcolepsy is a neurodegenerative sleep disorder linked to the loss of neurons containing the neuropeptide orexin, also known as hypocretin. Here, a replication-defective herpes simplex virus-1 amplicon-based vector was constructed to transfer the gene for mouse prepro-orexin into mice with a genetic deletion of the orexin gene. After in vitro tests confirmed successful gene transfer into cells, the gene vector was delivered to the lateral hypothalamus of orexin knockout (KO) mice where the orexin peptide was robustly expressed in the somata and processes of numerous neurons, and the peptide product was detected in the cerebrospinal fluid. During the 4-day life-span of the vector the incidence of cataplexy declined by 60%, and the levels of rapid eye movement sleep during the second half of the night were similar to levels in wild-type mice, indicating that narcoleptic sleep–wake behavior in orexin KO mice can be improved by targeted gene transfer.
Keywords: cataplexy, gene delivery, herpes simplex virus, hypocretin, narcolepsy, orexin
Introduction
Narcolepsy is a disabling neurological disorder characterized by excessive daytime sleepiness, sleep attacks, sleep fragmentation, cataplexy, rapid-onset rapid eye movement (REM) sleep episodes and hypnagogic hallucinations (Aldrich, 1991; Mignot, 1998). Narcolepsy is now regarded to be a neurodegenerative disorder resulting from the loss of neurons containing the neuropeptide orexin, also named hypocretin (Peyron et al., 2000; Thannickal et al., 2000). Consistent with the neuronal loss, patients with narcolepsy have low to negligible levels of orexin-A in the cerebrospinal fluid (Nishino et al., 2001). Two other peptides, dynorphin and neuronal activity-related pentraxin, that colocalize with orexin are also absent in human post mortem tissue (Blouin et al., 2005; Crocker et al., 2005), indicating death of the orexin neuron rather than reduction of the peptide. A behavioral phenotype that resembles narcolepsy occurs in mice, rats and canines when the orexin gene is deleted (Chemelli et al., 1999), the orexin neuron is destroyed (Gerashchenko et al., 2001; Hara et al., 2001; Beuckmann et al., 2004), or the orexin receptor-2 is deleted (Willie et al., 2003) or mutated (Lin et al., 1999).
The orexin neurons are present only in the perifornical region of the lateral hypothalamus (LH) from where they project to the entire brain and spinal cord, providing especially heavy innervation to forebrain and brainstem neuronal populations implicated in arousal (de Lecea et al., 1998; Peyron et al., 1998; Sakurai et al., 1998). Because this is the only collection of orexin neurons in the CNS and a reliable murine model exists (Chemelli et al., 1999), orexin gene transfer can be explored to determine whether it can correct a sleep disorder. Here we demonstrate that a replication-defective herpes simplex virus-1 (HSV-1) amplicon-based vector delivered the gene for mouse prepro-orexin along with the reporter gene, enhanced green fluorescent protein (HSV-GFP-orexin) into the LH of orexin knockout (KO) mice. We find that orexin gene delivery into the LH was effective in reducing by 60% narcoleptic behavior and reversing the aberrant night-time REM sleep levels.
Materials and methods
Construction of vector
HSV-GFP-orexin is a modified form of the vector HSV-1-PrpUC, where the mouse prepro-orexin gene expression is driven by the constitutive HSV-1 IE4/5, while expression of GFP is driven by a CMV promoter (Fig. 1A). Both amplicon constructs were packaged with helper 5dl1.2, purified on a sucrose gradient, pelleted and resuspended in 10% sucrose (Carlezon et al., 1997; Neve et al., 2005). The titers of infectious vector particles were determined by counting the numbers of GFP-positive cells obtained 1 day after infection of BHK21 cells.
Fig. 1.
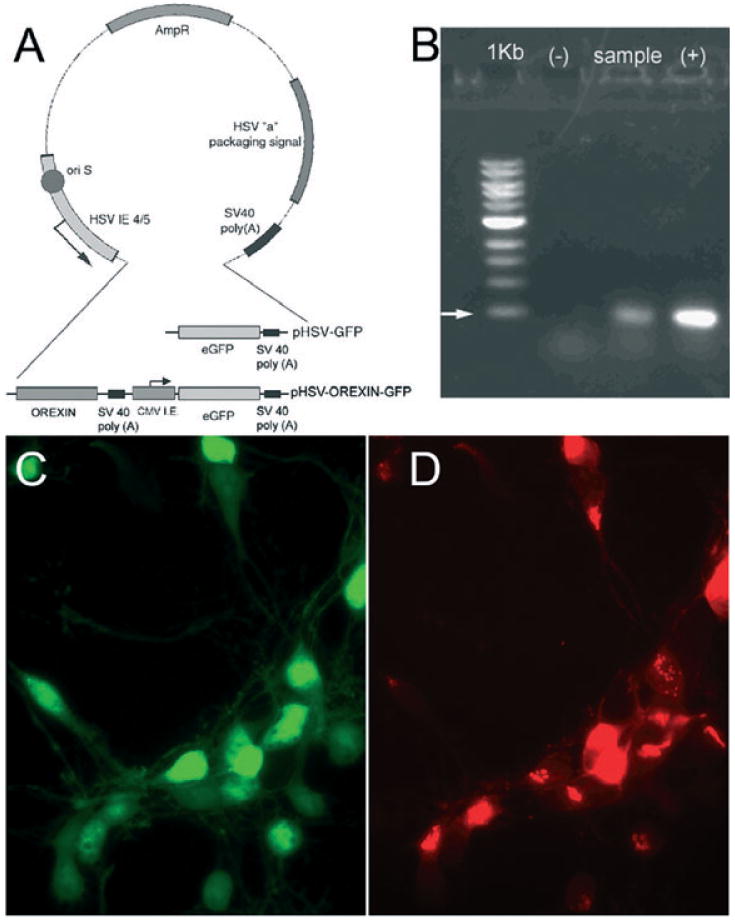
Construction map of herpes simplex virus (HSV)-green fluorescent protein (GFP)-orexin (A) and in vitro expression of hypocretin mRNA (B) and protein (C and D). The plasmids were initially verified by sequence analysis, and expression of the orexin mRNA was confirmed in BHK-21 cell lines infected with the orexin vector (B). Identification of the orexin gene product (photomicrographs C and D) was made in primary hippocampal neurons infected with the orexin vector (24 h) followed by immunohistochemistry to detect orexin-A. Primary hippocampal neurons express the GFP reporter gene (C) and many of these also contain orexin-A (D). Abbreviations: AmpR, ampicillin resistance gene; eGFP, enhanced green fluorescent protein; orexin, hypocretin; ori S, HSV origin of replication. (B) Lane 1 = 1 kb ladder; lane 2 (−) = negative control (BHK cells transected with the HSV-GFP vector); lane 3 (sample): BHK21 cells infected with HSV-GFP-orexin vector; lane 4 (+) = positive control (orexin cDNA). (B) The arrow points to 500 bp.
Total mRNA from fresh BHK 21 cells infected with HSVPrpUC-orexin was purified using Oligo Direct mRNA kit (Qiagen, Valencia, CA, USA), and the manufacturer's recommended procedures. After quantification, 1 μg mRNA was reverse-transcribed into first-strand cDNA using iScript cDNA synthesis kit (BioRad, Hercules, CA, USA). Orexin was selectively amplified by 35 cycles of polymerase chain reaction (PCR) using a pair of primers that are specific for the orexin gene (upstream: 5′-GCCACCATGAACTTTCCTTC-3′; downstream: 5′-TCAGACTCCGGACCCTCCCCG-3′), yielding a 393-bp nucleotide PCR product. Reverse-transcription PCR and regular PCR were also done with HSVPrpUC (without orexin) as negative control. Regular PCR on pMXs-orexin was used as positive control.
In vitro infection
Primary rat hippocampal neurons (Genlantis, San Diego, CA, USA) were infected with vector stock (MOI, 0.1). Twenty-four hours later we determined whether the gene product, orexin-A, was present by adding a goat anti-orexin-A antibody (Santa Cruz, CA, USA; 1 : 5000; 1-h incubation) followed by a rhodamine-conjugated donkey anti-goat IgG (1 : 200; Jackson Immunoresearch, West Grove, PA, USA; 1-h incubation). The primary hippocampal neurons were observed under appropriate filters (rhodamine for orexin-A and FITC for GFP). The reliability of the antibody against the gene product, orexin-A, was tested and confirmed by exposing brain tissue sections from the orexin KO mice, and no orexin-A immunoreactivity was found to be present. Tissue from wild-type (WT) mice labeled a discrete population of neurons only in the perifornical area of the LH, as previously described (de Lecea et al., 1998; Peyron et al., 1998; Sakurai et al., 1998). The mice were killed by an overdose of sodium pentoborbital (intraperitoneal injection)
Delivery of vector
The experimental (HSV-GFP-orexin) and control (HSV-GFP) vectors were delivered in a volume of 1.0 μL each side at the rate of 100 nL/min with the aid of a Hamilton syringe (2 μL) connected to an ultra micropump-II driven by a micropump syringe controller (Micro4, World Precision Instruments, Sarasota, FL, USA). Following the microinjection, the bilateral stainless steel injector cannulae (33 gage; Plastics one, Roanoke, VA, USA) were left in place for 10 min and then withdrawn slowly. The mice were anesthetized with isoflurane (2%; continuous)
Cerebrospinal fluid (CSF) orexin-A levels assayed with ELISA
CSF was collected from the cisterna magna of WT mice (C57BL/6J) and orexin KO mice (see next section for information on WT and orexin KO mice) according to the technique in a published report (Fischer et al., 2006) and stored at −80°C. The concentration of orexin-A in the CSF was estimated using ELISA according to the manufacturer's instructions (S-1146, range 0–25 ng/mL; Peninsula Laboratories, San Carlos, CA, USA). A maximum of ∼10–15 μL of CSF could be acquired from each mouse. Therefore, CSF samples from two mice were pooled to yield the 25 μL required for the assay. Separate groups of orexin KO mice were given the gene vector or the control vector, and the CSF was sampled 24 or 48 h post-injection. Maximum numbers of orexin neurons occurred at these time-points, and we reasoned that the two data points should corroborate each other.
To confirm the levels seen in the orexin KO mice, CSF was collected from two separate groups of WT mice. One group was sampled at ZT 9 (9 h after lights on) without any sleep deprivation, and a separate group of WT mice was kept awake for 6 h (slowly rotating running wheel; 2 rev/min) and CSF was sampled at the same time-point as the normal sleep group. The sleep-deprived WT group corroborated the results of the WT mice that slept normally. To provide additional reference points, CSF was collected from the cisterna magna of Sprague–Dawley rats (300 g) at ZT 1 (1 h after lights on) and ZT 4. In rats, ∼80–100 μL of CSF could be extracted from each rat and, as such, the assay was performed on individual rats. For some rat samples where there was sufficient CSF, the assay was performed in duplicate. For the duplicate rat samples, there was concordance between the two samples, and the two data points were averaged before calculating the group average. CSF was collected from rats under deep anesthesia (isofluorane; 2%), but in mice where CSF collection was a terminal procedure it was collected under pentobarbital anesthesia (overdose). The sample size for each group is noted in the figure legend of Fig. 4.
Fig. 4.
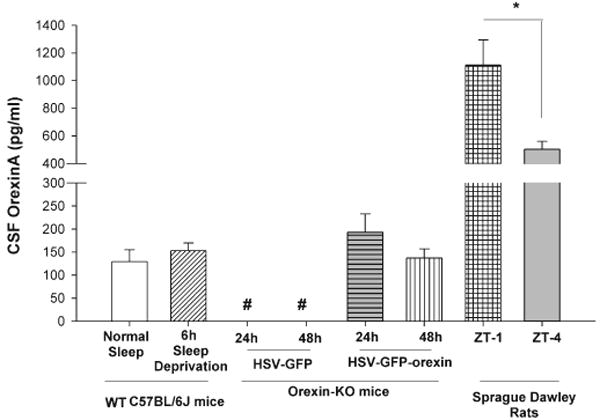
Concentration of orexin-A (HCRT-1)(pg/mL) in the cerebrospinal fluid (CSF) of C57BL/6J mice and Sprague–Dawley rats assessed by ELISA. The ELISA assay was first verified in Sprague–Dawley rats where concentration of CSF orexin-A levels at two circadian time-points (ZT 1; 1 h after lights on; n = 8; ZT 4; n = 5) was consistent with published reports (Yoshida et al., 2001; Desarnaud et al., 2004). The levels of orexin-A in wild-type (WT) C57BL/6J mice, assessed after normal sleep (n = 3) and after 6 h of sleep deprivation (n = 4), were also consistent with published reports using a similar assay in mice (Lin et al., 2002). Orexin knockout (KO) mice given the herpes simplex virus (HSV)-orexin gene in the LH and killed 24 h (n = 4) and 48 h (n = 5) after post-injection had CSF orexin-A levels that were similar to WT mice and WT mice that were sleep deprived. Orexin KO mice given the HSV-control vector did not have detectable levels of orexin-A when killed after 24 h (n = 2) and 48 h (n = 2) post-injection. The CSF was collected from the cisterna magna of mice and rats and stored at −80°C. A maximum of ∼10–15 μL of CSF could be acquired from each mouse. Therefore, CSF samples from two mice were pooled to yield the 25 μL required for the assay. Thus, for mice n = 2 represents CSF collected from four mice. In rats, CSF from individual rats was used in the assay. #P < 0.002 vs. the mice groups; one-way anova followed by Holm-Sidak post-hoc test. *P = 0.05, independent t-test.
Mice and sleep-recording electrodes
All animals were treated in accordance with the guidelines established by the National Institutes of Health (USA), and the research protocol was approved by the West Roxbury VA Medical Center's institutional animal care and use committee (IACUC). Orexin KO mice were bred in our facility and KOs genotyped using PCR of tail snips. The mice have been backcrossed for many generations on a C57BL/6J line. WT mice of the same age and background strain (C57BL/6J) as the orexin KOs were also implanted with sleep-recording electrodes. The mice (3–7 months old; 20–35 g) were implanted under anesthesia [isoflurane; 2%; continuous] with electrodes to record the electroencephalogram (EEG) and electromyogram (EMG) as described previously (Shiromani et al., 2004). Four stainless steel screw electrodes were positioned in the skull to sit on the surface of the cortex and were used to record the EEG. Two cortical screw electrodes (one frontal cortex and the second in the contralateral parietal cortex) recorded the EEG, and two flexible multistranded wires in the nuchal muscles recorded the muscle activity. The electrodes were placed in a plug and secured onto the skull using dental cement. In orexin KO mice two stainless steel guide cannulae (26 gage) were targeted 2 mm dorsal to the LH, so that an inner cannulae (33 gage) could be inserted and extend to the perifornical area of the LH.
Sleep experiment protocol
One day after the surgery the animals were connected to lightweight recording cables. After a 2-week period of adaptation and recovery from the effects of surgery, a 48-h baseline sleep recording was made (pre-injection baseline). The next day, the mice were anesthetized (isofluorane, 2% continuous) and either the HSV-GFP-orexin vector (experimental) or the control vector (HSV-GFP) was delivered to the LH. Immediately after insertion of the vectors sleep was recorded for 96 h. Because the time-course data indicated complete disappearance of orexin-immunoreactive somata by the 7th day, on the 8th day the mice that were initially given control vector were administered the experimental vector, and the mice that were initially given the experimental vector were now given the control vector thereby completing a crossover design. EEG sleep was recorded. Forty-eight hours of sleep was also recorded in a separate group of WT mice 2 weeks after surgery.
Sleep recording
The EEG was recorded from two contralateral screws (frontal-occipital). The EEG and EMG signals were amplified via a Grass polygraph and recorded onto the hard disk using an analog-digital board (National Instruments, Austin, TX, USA). The animals were housed singly in Plexiglas cages with wood-shavings, and food and water were available ad libitum. The temperature in the sleep recording room was 25°C, and a 12 : 12 h light : dark cycle (07.00–19.00 h lights on; 100 lux) was maintained.
Identification of behavioral arrest
The EEG and EMG recordings were examined for signs of sudden loss of muscle tone when the mice were awake. Previously, in the orexin KO mice such episodes are referred to as ‘behavioral arrests’ because the mice abruptly stop moving and lose muscle tone while engaged in behavioral activity (Chemelli et al., 1999). In rats and mice with loss of orexin or orexin neurons, such behavioral incidences are clearly evident on the EEG/EMG recordings. In the present study, ‘behavioral arrests’ were identified using EEG/EMG criteria alone and verified using video recording. A strict criteria was used to identify ‘behavioral arrests’: such episodes had to occur when the mouse was awake (=2 min); the episode had to last 48 s (four epochs since we score sleep–wake states in 12-s epochs): during the episode theta activity had to be present, and delta activity diminished; and there was loss of muscle tone (Fig. 5). The number and duration of each of these episodes during the night was determined.
Fig. 5.
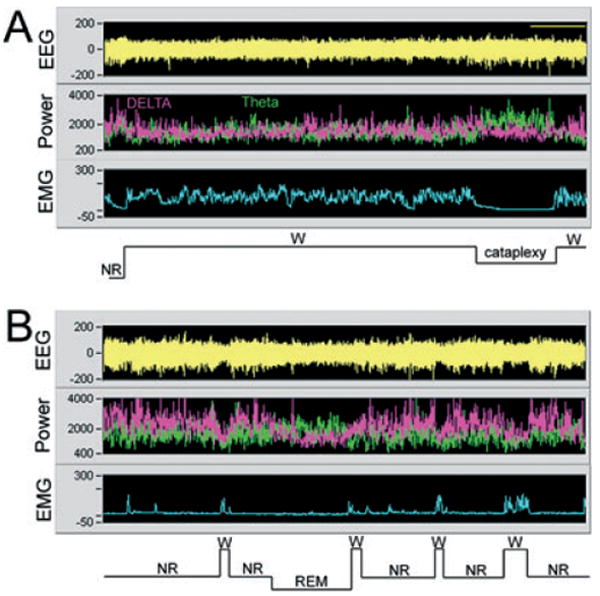
Example of an episode of ‘behavioral arrest’ (A) vs. normal rapid eye movement (REM) sleep onset (B) in a representative hypocretin knockout (KO) mouse. Each panel consists of a 20-min recording of the electroencephalogram (EEG), power of the EEG in the delta (0.3–4 Hz; pink) and theta bands (4–12 Hz; green), and integrated activity of the nuchal muscles (EMG) during the night. The sleep–wake state is determined by the relationship of the EEG, EEG power and EMG activity. In the top panel, high EMG activity coupled with low-amplitude EEG and low delta power (pink) indicates that the mouse is awake. The cataplexy is identified by an abrupt loss of EMG tone, and an increase in theta activity. (B) A normal transition into a REM sleep episode in the same mouse. Videotape recordings verified that the behavioral arrest coincided with EEG/EMG indices. Abbreviations: EEG, electroencephalogram; EMG, electromyogram; NR, non-REM sleep; REM, rapid eye movement sleep; W, awake.
Identification of sleep–wake states
Sleep that was recorded during preinjection, and 48 h and 96 h post-injection was analysed. The 24-h EEG and EMG recordings were scored manually on a computer (Icelus software; Mark Opp; Univ Michigan, Ann Arbor, MI, USA) in 12-s epochs for awake, non-REM sleep and REM sleep by staff blind to the type of vector administered to the mice. Wakefulness was identified by the presence of desynchronized EEG and high EMG activity. Non-REM sleep consisted of high-amplitude slow waves together with a low EMG tone relative to waking. REM sleep was identified by the presence of regular EEG theta activity coupled with low EMG relative to slow wave sleep. The amount of time spent in wakefulness, non-REM sleep and REM was determined for each hour. After the EEG data were scored, the code was broken to reveal the identity of each mouse.
Identification of vector delivery site
Because the mice were killed at the end of the life-span of the vector, the vector placement site was marked by delivering 10 nL cholera toxin subunit B (CTB; 0.5%) using a micropipette, and the mice killed immediately (nembutal overdose). The brains were perfused as described previously, and 40-μm-thick sections were processed for visualization of the CTB using avidin-biotin complex (ABC)–diaminobenzidine (DAB) method (Vector Labs, Burlingame, CA, USA). Tissue sections were incubated overnight at room temperature in the primary antibody (CTB; List Biochemicals; 1 : 30 000) followed the next day by 1-h incubation in secondary antibody (1 : 250; Millipore, Billerica, MA, USA), 1 h incubation in ABC (Vector Labs, Burlingame, CA, USA) and 5 min in DAB–nickel chloride–hydrogen peroxide solution. The tissue sections were mounted onto gelatin-coated slides and coverslipped. The CTB injection site was identified and plotted using a drawing tube attached to a microscope.
Tally of orexin-immunoreactive cells in the life-span experiment
The mice were deeply anesthetized with nembutal and perfused transcardially with 0.9% saline (10 mL) followed by 10% buffered formalin in 0.1 m phosphate-buffered saline (PBS; 50 mL). The brains were placed in 30% sucrose (0.1 m PBS) and allowed to equilibrate. The tissue was cut on a sliding-microtome (40-μm-thick sections) and 1 in 4 series of sections were processed for visualization of orexin-immunoreactive (orexin-ir) neurons. The tissue was incubated overnight (room temperature) in the primary antibody (goat anti-orexin-A antibody; Santa Cruz, CA, USA; 1 : 5000) and visualized using Alexa-568-conjugated donkey anti-goat IgG (2 h incubation; 1 : 100; Molecular Probes, Eugene, OR, USA). The tissue sections were mounted onto gelatin-coated slides and coverslipped using florescence mounting medium (Dako Cytomation, Carpenteria, CA, USA). The GFP and orexin-A-ir cells were visualized and the images were acquired using a Nikon Eclipse TE 200-U microscope with a Nikon C1si confocal scanner (Nikon Corporation, Melville, NY, USA). The images for each section were scanned in a sequential scanning mode (1 micron) and stacked. Every fourth section in the series was analysed and the GFP + orexin-A cells were counted off-line using EZ-C1 Viewer software (version 3.2; Nikon Corporation, Melville, NY, USA). The colocalization of GFP and orexin was confirmed by analysing the z-series stack, which allows viewing the cell in x–y and y–z directions. The tally of cells containing GFP or GFP + orexin-A was made from three–four sections (first well in 1 in 4 series) that contained the highest density of GFP-labeled cells. The tally represents the total number of labeled neurons at each injection site for each mouse. In WT mice (n = 4), orexin-A-ir neurons were counted in three–four sections (first well in 1 in 4 series) that contained the highest density of orexin-A-ir neurons. The tally represents the total number of orexin-A-ir labeled neurons for one hemisphere in each mouse. Counts were made from sections that were 160 μm apart (40-μm-thick, every fourth section) to eliminate the error of counting the same neuron twice.
Statistical analysis
Repeated-measures anova and t-tests (paired and independent, where appropriate) were used to compare changes in sleep parameters. Statistical significance was evaluated at the P < 0.05 level. In three mice the quality of the EEG signal had deteriorated by 96 h post-injection so that sleep could not be reliably scored. However, in these mice cataplexy could still be identified as the EMG signal was strong.
Results
In vitro confirmation of peptide
Expression of orexin mRNA was first confirmed in BHK21 cells. A band corresponding to mouse prepro-orexin mRNA was evident in cells transduced with the HSV-GFP-orexin vector (Fig. 1B), but not in cells transduced with the control vector (HSV-GFP). Next, the gene product was identified in primary hippocampal neurons using immunohistochemistry (Fig. 1C and D). Primary hippocampal neurons transduced with the orexin vector expressed orexin-A in neurons that also expressed the reporter gene, GFP (Fig. 1C and D).
In vivo delivery of orexin vector to the LH: life-span of expression
After the in vitro studies confirmed orexin mRNA and its protein product in infected cells, the HSV-GFP-orexin vector was placed in the LH of orexin KO mice. To determine the life-span of expression of the gene product, the mice were killed at various intervals (1, 2, 3, 4, 7 days) after vector delivery. Some mice (n = 5) were administered control vector and killed 1 or 3 days later. Brain tissue from all mice was examined for orexin-A-ir neurons. Numerous orexin-A-ir cells were evident in the LH (Fig. 2D–F). Orexin-A-ir cells were never evident in mice given control vector (Fig. 2A–D). Orexin-A-ir varicosities were clearly evident in the LH (Fig. 2I), indicating presence of the peptide in the axons and dendrites. Although orexin-A-ir varicosities were clearly evident some distance away from the soma, orexin-A-ir at the efferent terminal sites in the locus coeruleus or the tuberomammillary nucleus were not evident. This might be a result of sensitivity of the immunostaining as GFP was clearly evident at these sites in mice given the HSV-GFP-orexin vector indicating transport to distal sites (Supporting information, Fig. S1). Numerous orexin-A-ir neurons were found for 1–4 days after HSV-GFP-orexin vector delivery, and complete disappearance of cells containing either GFP or orexin-A-ir by the 7th day (Fig. 3). Maximal numbers of orexin-A-ir neurons were evident during the first 3 days (Fig. 3). In WT mice we determined that there are on average 330 ± 21.3 (n = 4) orexin-A-ir neurons in one hemisphere. Thus, we estimate that during the first 3 days after gene transfer, on average 44% of the orexin-A-ir neurons found in WT were present in orexin KO mice given the orexin gene at each target site (P < 0.01). On the 4th day post-gene delivery, the number of orexin-A-ir neurons had decreased by only one-third compared with Days 1–3. Thus, there was a robust expression of orexin-A-ir neurons during the 4-day period when the brains were assessed. Some of the brain tissue was processed for visualization of melanin-concentrating hormone (MCH-ir), and orexin-A-ir was present in some of these neurons (Fig. 2G–H). Normally, MCH neurons occur in the same region as the orexin neurons, but they are a separate and distinct population (Broberger et al., 1998).
Fig. 2.
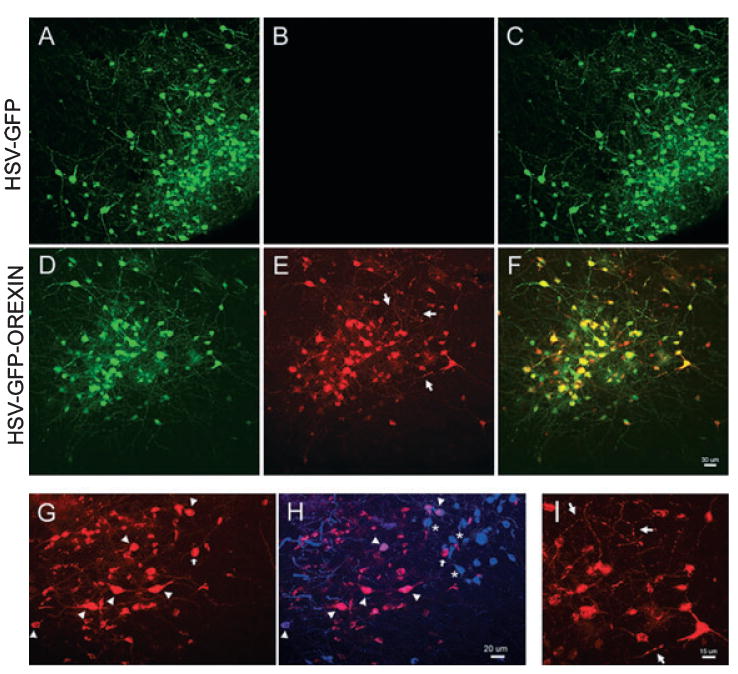
Confocal laser scanned images of orexin-A-immunoreactive (orexin-A-ir) neurons in the LH. In orexin KO mice microinjections (1 μL) of an herpes simplex virus (HSV)-1 amplicon vector containing the orexin gene [HSV-green fluorescent protein (GFP)-orexin] or the control vector (HSV-GFP) were made to the LH. (A and D) Identify cells expressing the reporter gene, GFP (green), in the LH in response to the two vectors. (B and E) Depict orexin-A-ir cells (red) in mice given the orexin vector (E), whereas mice given the control vector do not have orexin-A (B). (C and F) Merged GFP and orexin-A images where colocalization of GFP and orexin-A in the same cell (yellow) is seen only in photo (F). (I) A higher magnification (40×) of the area marked by arrows in (E), and shows the rich arborization of orexin-A-containing processes, including dense varicosities. (G and H) Identify the presence of orexin-A (G) in neurons containing MCH (H; MCH neurons identified in blue). In WT mice, MCH and orexin neurons are found in the same area of the LH, but these two peptides are not colocalized in the same neurons. As a result of the orexin vector some MCH neurons also express orexin. (G and H) The orexin + MCH neurons (purple) are marked by arrowheads. (H) Asterisks identify MCH neurons that are adjacent to the double-labeled (arrowheads) or the single-labeled orexin-A neuron (arrow in H). (A–C) From a representative mouse given the control vector and killed 72 h after vector delivery, while (D–F) are from a representative mouse given the orexin vector and killed 48 h later. The tally of neurons from these two mice is included in the time-course data presented in Fig. 3A. The calibration bar in (F) applies to photos (A–F), and the bar in (H) applies to (G).
Fig. 3.
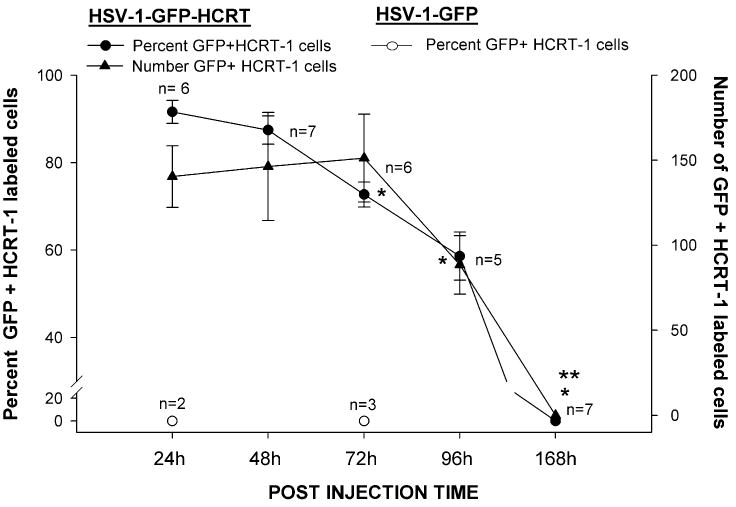
Time-course of expression of orexin-A-immunoreactivity (orexin-A-ir) and green fluorescent protein (GFP) in the LH of orexin KO mice after microinjection of the two vectors. The right axis summarizes the average number of cells that were GFP + orexin-A-ir in each mouse at each time-point and injection site, while the left axis summarizes these data as a percentage of GFP-labeled cells. The number of mice given the orexin vector and examined 1, 2, 3, 4 and 7 days after administration of the orexin vector is as follows: n = 6, 7, 6, 5, 7 at each respective time-point. The number of mice given the control vector [herpes simplex virus (HSV)-GFP] and examined after 1 or 3 days is: n = 2 and n = 3. *P < 0.001 vs. Day 1 (percentage of GFP + orexin-A cells); **P < 0.001 vs. day 1 (number of GFP + orexin-A cells).
Orexin-A in the CSF
Figure 4 summarizes the concentration of orexin-A in the CSF of mice and rats. CSF was taken from the cisterna magna in Sprague–Dawley rats at two time-points (ZT 1 and 4), and the levels of orexin-A were similar to published reports by us (Gerashchenko et al., 2003; Zhang et al., 2007) and others (Yoshida et al., 2001). Moreover, levels at ZT 1 were significantly higher than ZT 4 (independent t-test; t = 2.63; df = 11; P < 0.023), which is also consistent with the circadian rhythm of CSF orexin levels (Yoshida et al., 2001; Desarnaud et al., 2004). This verifies the utility of the ELISA method to accurately detect orexin-A levels in the CSF. The rat CSF orexin-A levels also provide a reference point for levels in mice. In orexin null mice given the control vector, orexin-A was not detected 24 and 48 h after delivery of the vector to the LH. In contrast, in mice given the orexin gene transfer, orexin-A was detected in the CSF 24 and 48 h after delivery of the gene to the LH, and were similar to levels in WT C57BL/6J mice (one-way anova; F5,14 = 6.82; P = 0.002; Fig. 4). WT mice that were kept awake for 6 h had a small but insignificant increase compared with the WT mice.
Effect of gene delivery on ‘behavioral arrests’
Next, the effect of the orexin gene transfer on sleep–wake behavior was examined. Cataplexy was the first behavior that was assessed, as in narcoleptic humans and canines it is an important diagnostic symptom of narcolepsy (Aldrich, 1991; Mignot, 1998). In the orexin null mice such episodes occur during periods of waking and can be easily identified because the mice abruptly stop moving, gradually lose muscle tone and have high theta activity (Chemelli et al., 1999; Fig. 5). Forty-eight hours after orexin vector administration, in 10 of 13 mice there was a significant decrease in the incidence of cataplexy compared with pre-injection levels (paired t-test = 4.02; df = 9; P < 0.003) and vs. mice given the control vector (independent t-test = 2.162; df = 21; P < 0.04; Fig. 6). Ninety-six hours after orexin administration the number of attacks had returned to preinjection levels. This trend was consistent with the time-course of clearance of the vector. There was no change in the length of episodes of cataplexy. Three of the 13 mice that were given the experimental vector showed no clear trend in cataplexy across the recording period. WT mice did not show any evidence of cataplexy.
Fig. 6.
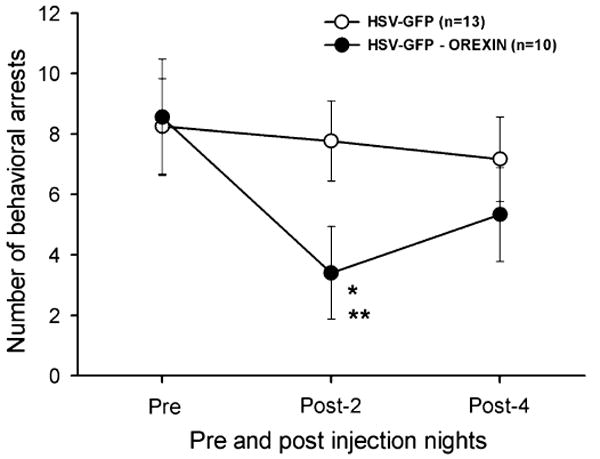
Effects of orexin gene delivery on behavioral arrests. Each data point represents the average (± SEM) number of behavioral arrests in orexin KO mice before (pre), and on the 2nd (post-2) and 4th (post-4) nights after administration of the vectors. The number of behavioral arrests pre-injection is comparable to published reports (Chemelli et al., 1999). * = vs. pre-injection (P < 0.003); ** = vs. control vector (P < 0.04). The mice given the orexin vector demonstrate a significant trend (quadratic component; F = 28.5; P < 0.001).
Effect on REM sleep
Next, the effects of the gene transfer on the amount of time spent in REM sleep were assessed. In both the rat and mouse models of narcolepsy there is a pronounced increase in REM sleep at night compared with WT rodents (Chemelli et al., 1999; Gerashchenko et al., 2001; Hara et al., 2001; Beuckmann et al., 2004; Mochizuki et al., 2004). Because the sleep effects are most evident at night, the 12-h night period sleep data (summarized in Table 1) were divided into two 6-h blocks (first and second half of the night) and compared with sleep in WT mice (n = 9).
Table 1.
Average percentage REM sleep, non-REM sleep and wake during the 12-h day and night cycles
| REM sleep | Non-REM sleep | Wake | |
|---|---|---|---|
| 12-h day | |||
| WT (n = 9) | 11.17 ± 0.56 | 45.87 ± 1.3 | 42.96 ± 1.53 |
| Control vector (n = 10) | |||
| Pre-injection | 11.29 ± 0.91 | 36.62 ± 1.28 | 52.09 ± 1.56 |
| Post-injection day 2 | 9.43 ± 0.88 | 38.68 ± 1.77 | 51.90 ± 2.15 |
| Post-injection day 4 | 9.98 ± 0.73 | 40.11 ± 1.11 | 49.92 ± 1.42 |
| Orexin vector (n = 7) | |||
| Pre-injection | 11.42 ± 0.94 | 39.20 ± 1.92 | 49.39 ± 1.85 |
| Post-injection day 2 | 9.25 ± 1.47 | 40.96 ± 2.84 | 49.78 ± 3.31 |
| Post-injection day 4 | 10.61 ± 1.17 | 43.85 ± 2.53 | 45.55 ± 2.15 |
| 12-h night | |||
| WT (n = 9) | 3.61 ± 0.35 | 19.77 ± 2.13 | 76.62 ± 2.45 |
| Control vector (n = 10) | |||
| Pre-injection | 8.28 ± 0.64* | 25.92 ± 1.91 | 65.80 ± 2.14* |
| Post-injection night 2 | 8.15 ± 0.50* | 32.07 ± 1.87* | 59.78 ± 1.97* |
| Post-injection night 4 | 8.09 ± 0.26* | 28.16 ± 2.33 | 63.75 ± 2.34* |
| Orexin vector (n = 7) | |||
| Pre-injection | 8.57 ± 0.94* | 27.26 ± 2.28 | 64.18 ± 2.88* |
| Post-injection night 2 | 6.55 ± 0.84* | 29.21 ± 4.80* | 64.24 ± 4.88* |
| Post-injection night 4 | 5.78 ± 0.67*,†,‡ | 24.59 ± 3.35 | 69.63 ± 3.69 |
Data are presented as averages ± SEM. One-way anova vs. WT.
P < 0.01 vs. WT.
P < 0.001 vs. control vector post-injection night 4.
P < 0.05 vs. orexin pre-injection (one-way repeated-measures anova). REM, rapid eye movement; WT, wild-type.
First, we established that the pre-injection REM sleep in the orexin KOs was significantly higher in the first (F2,25 = 16.6; P < 0.001) and second half (F2,25 = 12.03; P < 0.001) of the night compared with WT (Fig. 7A and B). The orexin KOs also had significantly more non-REM sleep (F2,25 = 8.6; P < 0.002) and were less awake (F2,25 = 11.9; P < 0.001) during the first half of the night compared with WT (Fig. 7). Daytime levels of wake, non-REM and REM sleep were not significantly different from WT (Table 1). Thus, consistent with the previous study (Chemelli et al., 1999), pre-injection sleep in the KOs at night was significantly different compared with WT, which permits us to test the effects of the gene transfer on sleep.
Fig. 7.
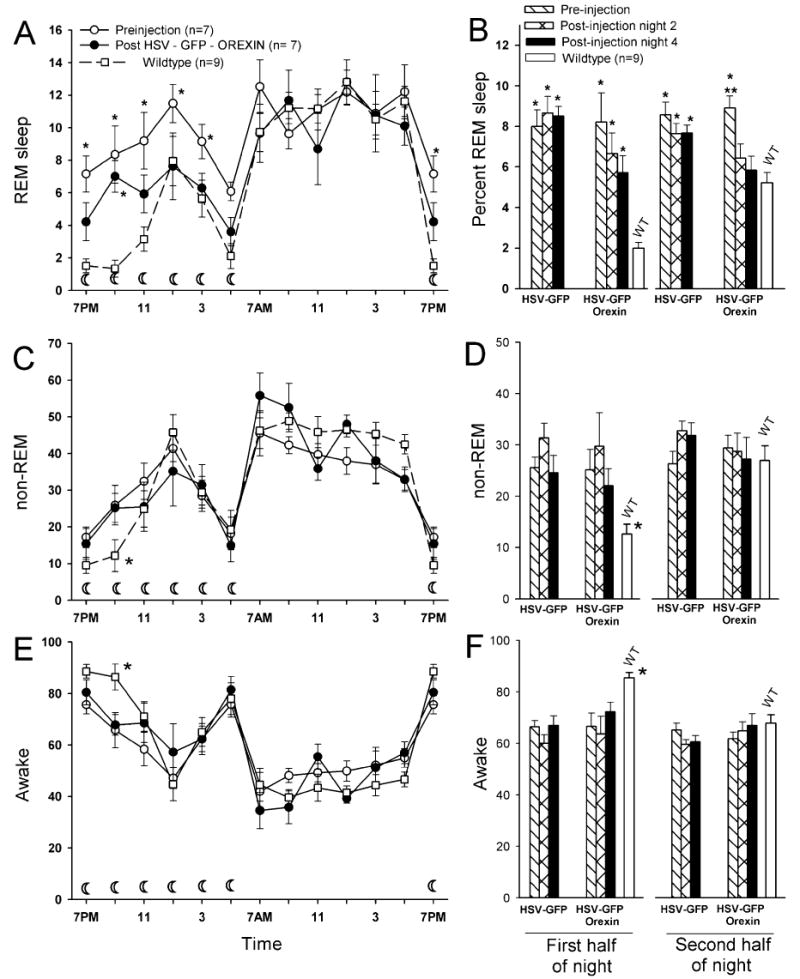
Mean (± SEM) percent REM, non-REM and awake in orexin KO mice administered HSV vector, and in WT C57 BL/6J mice. The line graphs (A, C, E) summarize the average REM, non-REM and awake levels (averaged in 2-h intervals) in WT mice (open squares) and the orexin KO mice before (open circles) and on the 4th day and night after delivery of the orexin vector (closed circles). (A, C and E) The 19.00 h data point is plotted twice. The bar graphs (B, D, F) summarize the average (± SEM), REM sleep, non-REM and wake levels during the first and second half of the night cycle in WT mice, and in orexin KO mice before (pre), and 2nd and 4th night after vector delivery. The crescent moon symbol in (A), (C) and (E) represents the 12-h lights-off period. In A and B, single asterisk (*) represents P < 0.001 vs. WT, and double asterisk (**) is P < 0.001 vs. nights 2, 4, and WT. In C–F single asterisk (*) represents WT P < 0.01 vs. pre and post first half of night.
In mice given control vector (n = 10; HSV + GFP) there were no significant changes in wake, non-REM or REM sleep compared with pre-injection during the 2nd and 4th night after injection (Fig. 7). Daytime sleep–wake levels were also not different from pre-injection (Table 1). In contrast, in the group of mice that had a decrease in cataplexy in response to the orexin vector there were seven mice that had a progressive decrease in REM sleep levels across the 96-h recording period vs. pre-injection levels (linear trend analysis; F1,6 = 21.11; P < 0.004). The variability in the response of mice to the orexin gene is not surprising, and may reflect the degree of orexin transduction or location of delivery site. In these seven mice given the orexin gene (HSV-GFP-orexin), REM sleep during the first half of the night was intermediate between their pre-injection and WT mice (Fig. 7A and B), suggesting that the orexin gene was beginning to have an effect during this portion of the night. However, during the second half of the night, in these mice REM sleep was significantly lower compared with pre-injection (P < 0.05) and mice given control vector (P < 0.05), but not significantly different from WT (Fig. 7A and B). This indicates that orexin gene delivery in the KOs reversed the increase in REM sleep during the second half of the night, and the effects were evident on the 2nd and 4th nights. Delivery of the orexin gene did not change levels of non-REM sleep or wake, which continued to be different compared with WT mice (Fig. 7C–F).
Effect on sleep fragmentation
Next, we assessed whether the orexin gene delivery affected the number and length of sleep–wake bouts. In humans with narcolepsy and in both the rat and mouse models of narcolepsy there are frequent transitions between sleep–wake states, which results in a highly fragmented sleep–wake pattern (Chemelli et al., 1999; Gerashchenko et al., 2001; Beuckmann et al., 2004). Table 2 summarizes the number and length of bouts of wake, non-REM and REM sleep during the day and night. On the 4th night after orexin gene delivery, a time when the effects on REM sleep were most pronounced, the mice had fewer REM sleep bouts compared with mice given the control vector (P < 0.05; Table 2). In these mice, the number of bouts of waking and non-REM sleep was intermediate to control vector and WT mice. Overall at night, in these mice sleep fragmentation was intermediate between WT and control vector mice (Table 2).
Table 2.
Average numbers and lengths of bouts of wake, non-REM and REM sleep on the 4th day and night after vector delivery
| Number of bouts (per 12 h) | Length of bouts (min) | |||||
|---|---|---|---|---|---|---|
| Wild type | HCRT vector | Control vector | Wild type | HCRT vector | Control vector | |
| Day | ||||||
| Wake | 218.0 ± 9.4 | 189.6 ± 30.8 | 220.3 ± 12.6 | 1.42 ± 0.06 | 2.5 ± 0.81 | 1.69 ± 0.12 |
| Non-REM sleep | 217.8 ± 9.4 | 189.0 ± 30.6 | 217.7 ± 12.4 | 1.56 ± 0.08 | 2.97 ± 1.51 | 1.37 ± 0.08 |
| REM sleep | 95.5 ± 6.1 | 96.1 ± 17.8 | 99.7 ± 10.1 | 0.87 ± 0.04 | 0.94 ± 0.18 | 0.74 ± 0.03 |
| Total sleep transitions | 531.3 ± 18.3 | 474.7 ± 77.3 | 537.7 ± 31.9 | |||
| Night | ||||||
| Wake | 82.9 ± 10.4 | 110.9 ± 22.8 | 135.8 ± 11.5* | 8.35 ± 1.70 | 7.06 ± 2.30 | 3.72 ± 0.35* |
| Non-REM sleep | 82.7 ± 10.4 | 105.3 ± 22.1 | 126.3 ± 13.0 | 1.80 ± 0.13 | 2.21 ± 0.62 | 1.58 ± 0.10 |
| REM sleep | 29.7 ± 3.7 | 48.4 ± 8.3 | 68.2 ± 4.1† | 0.91 ± 0.06 | 0.98 ± 0.16 | 0.85 ± 0.04 |
| Total sleep transitions | 195.1 ± 24.2 | 264.6 ±51.2 | 330.3 ± 26.2* | |||
Data are presented as averages ± SEM. Sleep transitions represent the tally of entries into wake, non-REM and REM sleep.
P < 0.05 vs. WT.
P < 0.05 vs. WT and HCRT vector. The number of mice in each group is as follows: WT = 9; HCRT vector = 7; control vector = 10. REM, rapid eye movement; WT, wild-type.
Identification of vector delivery site
At the end of the experiment 10 nL of CTB was injected (see Materials and methods) through the in-dwelling cannula and the mice killed immediately (nembutal overdose). The tip of the cannula was identified and plotted. In those mice (n = 7) that had a reduction in cataplexy and REM sleep, the tip of the microinjection cannula was found to be in the perifornical area where the orexin-A-ir neurons are located in WT mice (Fig. 8). Of the mice (n = 3) that showed a decrease in cataplexy but not in REM sleep the sites of the injection in two of them were very close to the effective sites, while in the third mouse (M461) the tips were on the edge of LH. In two mice (M202 and M480) the cannula tip was on target but behavior (cataplexy or REM sleep) was not changed. In one mouse (M421) both tips were in the dorsomedial hypothalamus and in this mouse behavior (cataplexy or REM sleep) was not changed.
Fig. 8.
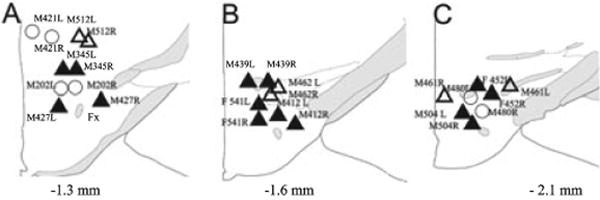
Site of vector delivery in the LH in all 13 mice in the experiment. Each drawing represents a coronal section of the part of the posterior hypothalamus where the vectors were injected. The numbers below each schematic drawing in (A–C) represent the distance posterior to bregma. The mice were killed at the end of the life-span of the viral vector when no GFP was evident. Therefore, to facilitate location of the vector delivery site, a biomarker, cholera toxin subunit B (CTB) was injected (10 nL; 0.5%) and the mice killed immediately. The symbols represent location of the CTB in the LH. The lettering and numbers next to the symbols denote each mouse (M, male; F, female; L, left LH; R, right LH). The triangles denote the 10 mice that had a decrease in cataplexy. The closed triangles denote the seven mice that also had a progressive decline in REM sleep over the four nights. The three pairs of open circles denote the three mice that did not show a change in behavior or REM sleep after delivery of the orexin vector.
Discussion
HSV-1 transferred the gene for mouse prepro-orexin to the LH of orexin KO mice. The peptide product, orexin-A, was identified in the somata and processes of LH neurons and also detected in the CSF, indicating successful gene transfer, synthesis of prepro-orexin and release of the peptide from the LH neurons. Most importantly, sleep behavior was significantly improved in orexin KO mice given the gene transfer.
There are a number of viral vectors that can be used to transfer genes (for review, see Neve et al., 2005). HSV-1 was selected because: (i) it primarily targets neurons, and it does so with very high transduction efficiency; (ii) it has negligible cytotoxicity (Carlezon et al., 1997; Neve et al., 2005); (iii) cloning manipulations are relatively easy due to the small size (5–10 kb) of the plasmid, a factor that is important for future experiments where several genes can be packaged in one vector; and (iv) it has a relatively short life-span compared with others (Carlezon et al., 1997; Neve et al., 2005), which makes it possible to rapidly identify ‘hot-sites’ that are most effective. Optimal sites can then be targeted with vectors with a longer term expression.
A series of in vitro and in vivo tests confirmed successful transfer of the orexin gene into neurons and release of the peptide into the CSF. Expression of the orexin mRNA (by PCR) was first confirmed in primary cell cultures (Fig. 1B) and then the gene product was identified in primary hippocampal neurons (Fig. 1C). The reliability of the antibody was verified in the orexin KO mice, and in orexin KO mice given the control vector, and no immunostained neurons were evident. In vivo tests in the brains of orexin KO mice verified that the peptide product was present in the somata of LH neurons, and its presence in processes indicated (Fig. 2I) migration out of the cell body.
Orexin-A was detected in the CSF of orexin KO mice given the gene, indicating release of the peptide. The levels of orexin-A in the CSF in the mice given the gene were similar to levels in WT C57BL/6J mice. Indeed, this is the first study to measure orexin-A in the CSF in mice. A previous study (Lin et al., 2002) measured orexin-A levels in various strains of mice, including C57BL/6J. However, their assessment was based on whole-brain homogenates, where orexin-A in the perikarya would also be measured. In their study, they also validated the ELISA method by demonstrating a strong concordance between radioimmunoassay (RIA) and the ELISA method. They concluded that the ELISA method was an economical, rapid and accurate way to measure orexin-A without the limitations posed by RIA, which requires 125I.
In the present study, the concentration of orexin-A was substantiated by CSF samples from WT mice and rats. We found that the concentration of orexin-A in rats at two time-points (see Fig. 4) was similar to published reports with RIA (Yoshida et al., 2001; Desarnaud et al., 2004), which validates our assay. Moreover, two time-points were sampled in rats so that they would corroborate each other and ZT 1 levels were significantly higher than ZT 4, which is consistent with published reports. The results (Fig. 4) suggest a sixfold difference in the concentration of orexin-A in the CSF between rats and mice.
Additional corroborating data were from WT mice that were kept awake for 6 h, and CSF was sampled at the same circadian time-point as WT mice that slept normally. We reasoned that in the WT awake group the concentration of orexin-A would be same or higher than WT mice that were allowed to sleep as orexin-A levels increase with waking (Yoshida et al., 2001). The results indicated that the sleep-deprived WT mice had a small albeit non-significant increase in orexin-A compared with the WT group that were not sleep deprived. To the best of our knowledge, this is the first study to assess the effects of sleep deprivation on CSF orexin-A levels in mice. In rats (Yoshida et al., 2001; Desarnaud et al., 2004) and canines (Wu et al., 2002), orexin-A levels increase with waking, whereas in the present study such an increase was not found in the WT mice. The difference between mice and other larger animals might be in detecting the very small changes in orexin-A levels that are likely to occur in mice. In mice, a circadian rhythm in orexin-A has not been detected (Lin et al., 2002), whereas such a rhythm is present in rats (Yoshida et al., 2001; Desarnaud et al., 2004) and non-human primates (Zeitzer et al., 2003).
Next, we proceeded to test the effects of the gene transfer on sleep–wake behavior. We considered it a prudent strategy to first demonstrate the effects of the gene transfer in a simpler model, one where only the gene has been deleted but the neuron exists (Chou et al., 2001). Therefore, the orexin KO mice were chosen. Having established baseline parameters in a simple model, subsequent studies can then utilize more complex models, such as the orexin-ataxin mice, and even canines. The LH was chosen as the site as placing the vector here would allow for the orexin gene to be inserted in neurons that already exist. The potential drawback of gene transfer is that the viral vector will penetrate other neurons in the region. Indeed, here we found that the orexin gene was also present in a few MCH-containing neurons. The effects of orexin in MCH neurons may be established in orexin-ataxin mice as the MCH neurons are the largest phenotype present in the LH once the orexin neurons have degenerated.
The primary finding of this study was that transfer of the gene for prepro-orexin into the LH of orexin KO mice was successful in reducing narcoleptic behavior and REM sleep at night. There were differences among the mice in the response to the orexin vector. In those mice that had a reduction in cataplexy and REM sleep, the tip of the microinjection cannula was in the perifornical area where the orexin-A-ir neurons are located in WT mice (Fig. 4E–G). Even when the cannula tip was on target behavior was not changed in some mice given orexin vector. This might be due to off-site location of one or both cannulae, poor delivery of the vector and/or insufficient orexin gene expression. At this time it is not possible to determine the extent of orexin-A expression in mice whose sleep behavior was recorded, as the brains were assessed at the end of the life-span of the vector.
The decrease in REM sleep and cataplexy might be due to direct release of orexin-A at target sites, CSF delivery of orexin-A to distal sites or a combination of the two. We suggest that the level of orexin-A in the CSF represents the output of all of the LH neurons expressing the orexin gene, and some of these might not innervate the relevant sites regulating sleep–wake behavior. Intracerebroventricular (i.c.v.) injections of orexin-A in orexin-ataxin-3 mice rescues the phenotype (Mieda et al., 2004), but the concentration of the peptide that was injected in that study (3 nm) was at least 1000-fold higher than the levels evident in the CSF of WT mice (Fig. 4).
In the rodent models of narcolepsy REM sleep is typically increased at night (Chemelli et al., 1999; Gerashchenko et al., 2001; Hara et al., 2001; Beuckmann et al., 2004; Mochizuki et al., 2004). In the present study, the orexin KOs also had more REM sleep at night compared with the WT mice. After orexin gene delivery REM sleep levels during the second half of the night decreased compared with preinjection and vs. mice given control vector, and were not different from REM sleep levels in WT mice. The reversal of REM sleep during the second half of the night suggests that in the orexin KOs the newly transduced LH neurons might be stimulated to release the peptide during the second half of the night. This is relevant as in WT rats (Yoshida et al., 2001; Desarnaud et al., 2004) and non-human primates (Zeitzer et al., 2003) orexin levels are maximum at the end of the active phase.
The decrease in cataplexy and REM sleep were specific to mice given the gene vector, and such changes did not occur in mice given control vector. Moreover, in the gene vector group the REM sleep reduction occurred at night, especially the second half of the night. If it was a non-specific effect then the reduction in REM sleep in the gene vector group should also have occurred during the day. No changes in non-REM sleep were evident in mice given the HSV-1 vector, indicating that there was no cytotoxicity associated with the ‘gutless’ viral vector.
In the orexin KO mice given the gene transfer the orexin gene product was expressed for at least 4 days, with peak expression during the first 3 days. The number of neurons that were orexin-A-ir at each injection site during peak expression represents 44% of the number of orexin-ir neurons in the WT mice, and it was sufficient to ameliorate narcoleptic symptoms. From this we suggest that full recovery might require replacing more than 50% of the neurons as mice carrying one copy of the orexin gene (heterozygotes) do not have a narcoleptic phenotype (Chemelli et al., 1999).
In the present study, the same methodology was used to count orexin-ir neurons in WT mice and in the orexin KO mice given the gene transfer. We counted orexin-ir neurons in three–four sections spaced 160 μm apart (every 4th section; 40-μm-thick sections; coronal sections) so as to eliminate the error of counting the same neuron twice. In WT C57BL/6J mice we found a total of 330 ± 21.3 (average of four mice) orexin-ir neurons in one hemisphere. If we extrapolate our data to include both hemispheres and alternate sections (wells 1 and 3 in a 4-well series) then we obtain 1320 orexin-ir neurons [330 × 2 (alternate sections) × 2 hemispheres]. Our tally of orexin-ir neurons is reasonable considering that a recent paper used unbiased stereology and estimated that there are 1152 orexin-ir neurons in the LH of the C57BL/6J mouse (Gardi et al., 2008).
The orexin gene transfer decreased the number of REM sleep bouts at night but did not stabilize the overall architecture of sleep. The orexin neurons project to multiple arousal sites (de Lecea et al., 1998; Peyron et al., 1998; Sakurai et al., 1998), and to stabilize sleep–wake transitions many more neurons might need to express orexin, perhaps for a longer time period than the 4 days in the present study. REM sleep was more sensitive to the orexin gene transfer compared with wake or non-REM sleep, indicating that it may be possible to selectively influence REM sleep and cataplexy without adversely impacting non-REM sleep or waking. In the orexin null mice the deletion of the gene might have increased the sensitivity of the receptors such that when the peptide was available there was a decrease in narcoleptic behavior and REM sleep. The effect of the gene transfer might also be related to the presence of orexin in neurons that normally do not contain the peptide, such as the MCH neurons. Many neurons in the LH project to targets that are innervated by the orexin neurons (Elias et al., 1998). However, some of these neurons, such as those containing MCH, behave differently (Verret et al., 2003; Hanriot et al., 2007) compared with the orexin neurons, and they may have attenuated the full impact of the gene transfer. Because of differences in activity of LH neurons during the sleep–wake cycle, it was necessary to test effects of gene transfer in a much simpler model, such as the orexin KO mice. However, a more complex model such as the orexin-ataxin-3 mice will need to be tested as in human narcoleptics where there is a profound loss of the orexin neurons, orexin gene transfer to other neurons will be necessary to ameliorate symptoms.
Gene transfer has been tried in animal models of a number of neurodegenerative diseases (Mandel et al., 2006) where it has proven to be a useful neurobiological tool. Ectopic expression of orexin in mice lacking the orexin neurons rescues the phenotype, but the orexin is constitutively expressed in every cell from conception (Mieda et al., 2004). Thus, there is a need to explore methods that reintroduce the orexin peptide, but in a discrete region of the brain. Orexin neurons have been transplanted in rats (Arias-Carrion et al., 2004), but very few (1–5%) of the transplanted neurons survive. Here, feasibility of the gene transfer was demonstrated first in the orexin KO mice. This provides a neurobiological tool to repair a sleep disorder resulting from a missing gene.
Supplementary Material
Additional Supporting Information may be found in the online version of this article:
Fig. S1. Neuronal processes containing GFP in the tuberomammillary nucleus (TMN) and locus coeruleus (LC) of orexin KO mice. The mice were administered HSV-GFP-orexin gene vector in the LH and killed 4 days later. Orexin-A-ir was not evident at these orexin terminal sites, perhaps due to sensitivity of the immunohistochemical methods to detect orexin-A-ir distal to the somata.
Please note: Wiley-Blackwell are not responsible for the content or functionality of any supporting material supplied by the authors. Any queries (other than missing material) should be directed to the corresponding author for the article.
Acknowledgments
We thank Elizabeth Winston for expert technical assistance and Dr Errol Baker for advice on statistics. This study was supported by NIH grants NS030140, NS052287, HL091363 and Medical Research Service of the Department of Veterans Affairs. M.Y. is a HHMI investigator.
Abbreviations
- ABC
avidin-biotin complex
- CSF
cerebrospinal fluid
- CTB
cholera toxin subunit B
- DAB
diaminobenzidine
- EEG
electroencephalogram
- EMG
electromyogram
- GFP
green fluorescent protein
- HSV
herpes simplex virus
- ir
immunoreactive
- KO
knockout
- LH
lateral hypothalamus
- MCH
melanin-concentrating hormone
- PBS
phosphate-buffered saline
- PCR
polymerase chain reaction
- REM
rapid eye movement
- RIA
radioimmunoassay
- WT
wild-type
References
- Aldrich MS. The neurobiology of narcolepsy. Trends Neurosci. 1991;14:235–239. doi: 10.1016/0166-2236(91)90121-a. [DOI] [PubMed] [Google Scholar]
- Arias-Carrion O, Murillo-Rodriguez E, Xu M, Blanco-Centurion C, Drucker-Colin R, Shiromani PJ. Transplantation of hypocretin neurons into the pontine reticular formation: preliminary results. Sleep. 2004;27:1465–1470. doi: 10.1093/sleep/27.8.1465. [DOI] [PMC free article] [PubMed] [Google Scholar]
- Beuckmann CT, Sinton CM, Williams SC, Richardson JA, Hammer RE, Sakurai T, Yanagisawa M. Expression of a poly-glutamine-ataxin-3 transgene in orexin neurons induces narcolepsy-cataplexy in the rat. J Neurosci. 2004;24:4469–4477. doi: 10.1523/JNEUROSCI.5560-03.2004. [DOI] [PMC free article] [PubMed] [Google Scholar]
- Blouin AM, Thannickal TC, Worley PF, Baraban JM, Reti IM, Siegel JM. Narp immunostaining of human hypocretin (orexin) neurons: loss in narcolepsy. Neurology. 2005;65:1189–1192. doi: 10.1212/01.wnl.0000175219.01544.c8. [DOI] [PMC free article] [PubMed] [Google Scholar]
- Broberger C, de Lecea L, Sutcliffe JG, Hokfelt T. Hypocretin/orexin- and melanin-concentrating hormone-expressing cells form distinct populations in the rodent lateral hypothalamus: relationship to the neuropeptide Y and agouti gene-related protein systems. J Comp Neurol. 1998;402:460–474. [PubMed] [Google Scholar]
- Carlezon WA, Jr, Boundy VA, Haile CN, Lane SB, Kalb RG, Neve RL, Nestler EJ. Sensitization to morphine induced by viral-mediated gene transfer. Science. 1997;277:812–814. doi: 10.1126/science.277.5327.812. [DOI] [PubMed] [Google Scholar]
- Chemelli RM, Willie JT, Sinton CM, Elmquist JK, Scammell T, Lee C, Richardson JA, Williams SC, Xiong Y, Kisanuki Y, Fitch TE, Nakazato M, Hammer RE, Saper CB, Yanagisawa M. Narcolepsy in orexin knockout mice: molecular genetics of sleep regulation. Cell. 1999;98:437–451. doi: 10.1016/s0092-8674(00)81973-x. [DOI] [PubMed] [Google Scholar]
- Chou TC, Lee CE, Lu J, Elmquist JK, Hara J, Willie JT, Beuckmann CT, Chemelli RM, Sakurai T, Yanagisawa M, Saper CB, Scammell TE. Orexin (hypocretin) neurons contain dynorphin. J Neurosci. 2001;21:RC168. doi: 10.1523/JNEUROSCI.21-19-j0003.2001. [DOI] [PMC free article] [PubMed] [Google Scholar]
- Crocker A, Espana RA, Papadopoulou M, Saper CB, Faraco J, Sakurai T, Honda M, Mignot E, Scammell TE. Concomitant loss of dynorphin, NARP, and orexin in narcolepsy. Neurology. 2005;65:1184–1188. doi: 10.1212/01.wnl.0000168173.71940.ab. [DOI] [PMC free article] [PubMed] [Google Scholar]
- Desarnaud F, Murillo-Rodriguez E, Lin L, Xu M, Gerashchenko D, Shiromani SN, Nishino S, Mignot E, Shiromani PJ. The diurnal rhythm of hypocretin in young and old F344 rats. Sleep. 2004;27:851–856. doi: 10.1093/sleep/27.5.851. [DOI] [PMC free article] [PubMed] [Google Scholar]
- Elias CF, Saper CB, Maratos-Flier E, Tritos NA, Lee C, Kelly J, Tatro JB, Hoffman GE, Ollmann MM, Barsh GS, Sakurai T, Yanagisawa M, Elmquist JK. Chemically defined projections linking the mediobasal hypothalamus and the lateral hypothalamic area. J Comp Neurol. 1998;402:442–459. [PubMed] [Google Scholar]
- Fischer DF, Hol EM, Hobo B, van Leeuwen FW. Alzheimer-associated APP+1 transgenic mice: frameshift beta-amyloid precursor protein is secreted in cerebrospinal fluid without inducing neuropathology. Neurobiol Aging. 2006;27:1445–1450. doi: 10.1016/j.neurobiolaging.2005.09.010. [DOI] [PubMed] [Google Scholar]
- Gardi JE, Nyengaard JR, Gundersen HJ. Automatic sampling for unbiased and efficient stereological estimation using the proportionator in biological studies. J Microsc. 2008;230:108–120. doi: 10.1111/j.1365-2818.2008.01963.x. [DOI] [PubMed] [Google Scholar]
- Gerashchenko D, Kohls MD, Greco M, Waleh NS, Salin-Pascual R, Kilduff TS, Lappi DA, Shiromani PJ. Hypocretin-2-saporin lesions of the lateral hypothalamus produce narcoleptic-like sleep behavior in the rat. J Neurosci. 2001;21:7273–7283. doi: 10.1523/JNEUROSCI.21-18-07273.2001. [DOI] [PMC free article] [PubMed] [Google Scholar]
- Gerashchenko D, Murillo-Rodriguez E, Lin L, Xu M, Hallett L, Nishino S, Mignot E, Shiromani PJ. Relationship between CSF hypocretin levels and hypocretin neuronal loss. Exp Neurol. 2003;184:1010–1016. doi: 10.1016/S0014-4886(03)00388-1. [DOI] [PubMed] [Google Scholar]
- Hanriot L, Camargo N, Courau AC, Leger L, Luppi PH, Peyron C. Characterization of the melanin-concentrating hormone neurons activated during paradoxical sleep hypersomnia in rats. J Comp Neurol. 2007;505:147–157. doi: 10.1002/cne.21482. [DOI] [PubMed] [Google Scholar]
- Hara J, Beuckmann CT, Nambu T, Willie JT, Chemelli RM, Sinton CM, Sugiyama F, Yagami K, Goto K, Yanagisawa M, Sakurai T. Genetic ablation of orexin neurons in mice results in narcolepsy, hypophagia, and obesity. Neuron. 2001;30:345–354. doi: 10.1016/s0896-6273(01)00293-8. [DOI] [PubMed] [Google Scholar]
- de Lecea L, Kilduff TS, Peyron C, Gao X, Foye PE, Danielson PE, Fukuhara C, Battenberg EL, Gautvik VT, Bartlett FS, Frankel WN, van den Pol AN, Bloom FE, Gautvik KM, Sutcliffe JG. The hypocretins: hypothalamus-specific peptides with neuroexcitatory activity. Proc Natl Acad Sci USA. 1998;95:322–327. doi: 10.1073/pnas.95.1.322. [DOI] [PMC free article] [PubMed] [Google Scholar]
- Lin L, Faraco J, Li R, Kadotani H, Rogers W, Lin X, Qiu X, de Jong PJ, Nishino S, Mignot E. The sleep disorder canine narcolepsy is caused by a mutation in the hypocretin (orexin) receptor 2 gene. Cell. 1999;98:365–376. doi: 10.1016/s0092-8674(00)81965-0. [DOI] [PubMed] [Google Scholar]
- Lin L, Wisor J, Shiba T, Taheri S, Yanai K, Wurts S, Lin X, Vitaterna M, Takahashi J, Lovenberg TW, Koehl M, Uhl G, Nishino S, Mignot E. Measurement of hypocretin/orexin content in the mouse brain using an enzyme immunoassay: the effect of circadian time, age and genetic background. Peptides. 2002;23:2203–2211. doi: 10.1016/s0196-9781(02)00251-6. [DOI] [PubMed] [Google Scholar]
- Mandel RJ, Manfredsson FP, Foust KD, Rising A, Reimsnider S, Nash K, Burger C. Recombinant adeno-associated viral vectors as therapeutic agents to treat neurological disorders. Mol Ther. 2006;13:463–483. doi: 10.1016/j.ymthe.2005.11.009. [DOI] [PubMed] [Google Scholar]
- Mieda M, Willie JT, Hara J, Sinton CM, Sakurai T, Yanagisawa M. Orexin peptides prevent cataplexy and improve wakefulness in an orexin neuron-ablated model of narcolepsy in mice. Proc Natl Acad Sci USA. 2004;101:4649–4654. doi: 10.1073/pnas.0400590101. [DOI] [PMC free article] [PubMed] [Google Scholar]
- Mignot E. Genetic and familial aspects of narcolepsy. Neurology. 1998;50:S16–S22. doi: 10.1212/wnl.50.2_suppl_1.s16. [DOI] [PubMed] [Google Scholar]
- Mochizuki T, Crocker A, McCormack S, Yanagisawa M, Sakurai T, Scammell TE. Behavioral state instability in orexin knock-out mice. J Neurosci. 2004;24:6291–6300. doi: 10.1523/JNEUROSCI.0586-04.2004. [DOI] [PMC free article] [PubMed] [Google Scholar]
- Neve RL, Neve KA, Nestler EJ, Carlezon WA., Jr Use of herpes virus amplicon vectors to study brain disorders. Biotechniques. 2005;39:381–391. doi: 10.2144/05393PS01. [DOI] [PubMed] [Google Scholar]
- Nishino S, Ripley B, Overeem S, Nevsimalova S, Lammers GJ, Vankova J, Okun M, Rogers W, Brooks S, Mignot E. Low cerebrospinal fluid hypocretin (Orexin) and altered energy homeostasis in human narcolepsy. Ann Neurol. 2001;50:381–388. doi: 10.1002/ana.1130. [DOI] [PubMed] [Google Scholar]
- Peyron C, Tighe DK, van den Pol AN, de Lecea L, Heller HC, Sutcliffe JG, Kilduff TS. Neurons containing hypocretin (orexin) project to multiple neuronal systems. J Neurosci. 1998;18:9996–10015. doi: 10.1523/JNEUROSCI.18-23-09996.1998. [DOI] [PMC free article] [PubMed] [Google Scholar]
- Peyron C, Faraco J, Rogers W, Ripley B, Overeem S, Charnay Y, Nevsimalova S, Aldrich M, Reynolds D, Albin R, Li R, Hungs M, Pedrazzoli M, Padigaru M, Kucherlapati M, Fan J, Maki R, Lammers GJ, Bouras C, Kucherlapati R, Nishino S, Mignot E. A mutation in a case of early onset narcolepsy and a generalized absence of hypocretin peptides in human narcoleptic brains. Nat Med. 2000;6:991–997. doi: 10.1038/79690. [DOI] [PubMed] [Google Scholar]
- Sakurai T, Amemiya A, Ishii M, Matsuzaki I, Chemelli RM, Tanaka H, Williams SC, Richarson JA, Kozlowski GP, Wilson S, Arch JR, Buckingham RE, Haynes AC, Carr SA, Annan RS, McNulty DE, Liu WS, Terrett JA, Elshourbagy NA, Bergsma DJ, Yanagisawa M. Orexins and orexin receptors: a family of hypothalamic neuropeptides and G protein-coupled receptors that regulate feeding behavior [comment] Cell. 1998;92:573–585. doi: 10.1016/s0092-8674(00)80949-6. [DOI] [PubMed] [Google Scholar]
- Shiromani PJ, Xu M, Winston EM, Shiromani SN, Gerashchenko D, Weaver DR. Sleep rhythmicity and homeostasis in mice with targeted disruption of mPeriod genes. Am J Physiol Regul Integr Comp Physiol. 2004;287:R47–R57. doi: 10.1152/ajpregu.00138.2004. [DOI] [PubMed] [Google Scholar]
- Thannickal TC, Moore RY, Nienhuis R, Ramanathan L, Gulyani S, Aldrich M, Cornford M, Siegel JM. Reduced number of hypocretin neurons in human narcolepsy. Neuron. 2000;27:469–474. doi: 10.1016/s0896-6273(00)00058-1. [DOI] [PMC free article] [PubMed] [Google Scholar]
- Verret L, Goutagny R, Fort P, Cagnon L, Salvert D, Leger L, Boissard R, Salin P, Peyron C, Luppi PH. A role of melanin-concentrating hormone producing neurons in the central regulation of paradoxical sleep. BMC Neurosci. 2003;4:19. doi: 10.1186/1471-2202-4-19. [DOI] [PMC free article] [PubMed] [Google Scholar]
- Willie JT, Chemelli RM, Sinton CM, Tokita S, Williams SC, Kisanuki YY, Marcus JN, Lee C, Elmquist JK, Kohlmeier KA, Leonard CS, Richardson JA, Hammer RE, Yanagisawa M. Distinct narcolepsy syndromes in orexin receptor-2 and orexin null mice. Molecular genetic dissection of non-REM and REM sleep regulatory processes. Neuron. 2003;38:715–730. doi: 10.1016/s0896-6273(03)00330-1. [DOI] [PubMed] [Google Scholar]
- Wu MF, John J, Maidment N, Lam HA, Siegel JM. Hypocretin release in normal and narcoleptic dogs after food and sleep deprivation, eating, and movement. Am J Physiol Regul Integr Comp Physiol. 2002;283:R1079–R1086. doi: 10.1152/ajpregu.00207.2002. [DOI] [PMC free article] [PubMed] [Google Scholar]
- Yoshida Y, Fujiki N, Nakajima T, Ripley B, Matsumura H, Yoneda H, Mignot E, Nishino S. Fluctuation of extracellular hypocretin-1 (orexin A) levels in the rat in relation to the light-dark cycle and sleep-wake activities. Eur J Neurosci. 2001;14:1075–1081. doi: 10.1046/j.0953-816x.2001.01725.x. [DOI] [PubMed] [Google Scholar]
- Zeitzer JM, Buckmaster CL, Parker KJ, Hauck CM, Lyons DM, Mignot E. Circadian and homeostatic regulation of hypocretin in a primate model: implications for the consolidation of wakefulness. J Neurosci. 2003;23:3555–3560. doi: 10.1523/JNEUROSCI.23-08-03555.2003. [DOI] [PMC free article] [PubMed] [Google Scholar]
- Zhang S, Lin L, Kaur S, Thankachan S, Blanco-Centurion C, Yanagisawa M, Mignot E, Shiromani PJ. The development of hypocretin (OREXIN) deficiency in hypocretin/ataxin-3 transgenic rats. Neuroscience. 2007;148:34–43. doi: 10.1016/j.neuroscience.2007.05.029. [DOI] [PMC free article] [PubMed] [Google Scholar]
Associated Data
This section collects any data citations, data availability statements, or supplementary materials included in this article.
Supplementary Materials
Additional Supporting Information may be found in the online version of this article:
Fig. S1. Neuronal processes containing GFP in the tuberomammillary nucleus (TMN) and locus coeruleus (LC) of orexin KO mice. The mice were administered HSV-GFP-orexin gene vector in the LH and killed 4 days later. Orexin-A-ir was not evident at these orexin terminal sites, perhaps due to sensitivity of the immunohistochemical methods to detect orexin-A-ir distal to the somata.
Please note: Wiley-Blackwell are not responsible for the content or functionality of any supporting material supplied by the authors. Any queries (other than missing material) should be directed to the corresponding author for the article.