Abstract
For more than 50 years, it has been assumed that ventricular fibrillation (VF) is maintained solely by reentry in the working myocardium. This hypothesis has never been tested by recording VF with electrodes spaced sufficiently close to map activation sequences in 3D. We recorded the first 10 minutes of electrically induced VF from the anterior left ventricular (LV) free wall near the insertion of the anterior papillary muscle in 6 pigs. A 3D transmural unipolar electrode array consisting of a 9×9 array of needles with 2-mm spacing and 6 electrodes 2 mm apart on each needle was used for recordings. Automatic analyses were performed to recognize 3D reentry and foci. Our results showed that intramural reentry is present early but not late during VF in the mapped region. The incidence of reentry in working myocardium decreases almost to 0 after 3 minutes of VF. In contrast, intramural foci are present during early VF and, as VF continues, increase in incidence, so that by 10 minutes of VF, 27% of wavefronts arise from intramural foci. These results suggest that, particularly after the first 3 minutes of VF, mechanisms other than local reentry in the working myocardium maintain VF in the anterior LV free wall near the root of the anterior papillary muscle. Intramural foci may play an important role in later VF maintenance. It remains to be determined if these foci arise from Purkinje fibers attributable to abnormal automaticity, afterdepolarizations, or reentry.
Keywords: intramural VF, focal arrhythmia, long duration VF
Sudden cardiac arrest is a leading cause of death in the industrialized world.1 Many sudden cardiac arrests are caused by ventricular fibrillation (VF).1 Sustained reentry in the working myocardium has been assumed to maintain VF,2–4 which was confirmed by the experimental observations of epicardial reentry in guinea pigs and rabbits.5–8 However, in larger hearts of a size near to that of human hearts, epicardial reentry is rare and short-lived.9–12 Intramural reentry has been suggested to be responsible for VF maintenance.11,13 However, 3D intramural mapping with a spatial resolution sufficient to track reentrant wavefronts have not previously been conducted.
Although much has been learned about VF from animal, human and computer modeling studies,1 most of these studies deal with short duration VF. Yet the mean time from collapse until defibrillation in the prehospital setting where most cardiac arrests occur ranges from 4 to 10 minutes.14,15 This time markedly affects outcome, with the odds of survival decreasing approximately 10% per minute.14 Understanding the temporal dynamics of the electrophysiological mechanism for VF maintenance may increase our understanding of decreasing survival as VF continues.
A suite of computer programs has been developed previously by Rogers and coworkers,10,16,17 in which the electric activations on a 2D plane are quantitatively analyzed. In this study, we extended this suit of programs to 3D and used it to analyze electric recordings in a 3D volume with 2-mm spacing. We recorded long-duration VF from the anterior left ventricle (LV) free wall in swine hearts and detected intramural wavefronts, intramural reentry, and intramural foci with these 3D programs. We found that the incidence of reentry in working myocardium decreases almost to 0 after 3 minutes of VF. In contrast, intramural foci are present during VF and, as VF continues, increase in incidence.
Materials and Methods
Animal Preparation
The use of experimental animals in this study was approved by the Institution Animal Care and Use Committee at the University of Alabama at Birmingham. All studies were performed in accordance with the guidelines of the American Heart Association on Research Animal Use.
Twelve pigs (42.6±4.0 kg) were studied. Details of the animal preparation have been described previously.18 The animals were anesthetized and ventilated in a restrained, dorsally recumbent position. The chest was opened by median sternotomy, and the heart was exposed.
Data Acquisition
Six pigs were used for 2D epicardial plaque recordings for comparison with the 3D results. A 504-electrode (24×21, 2-mm spacing) plaque was sutured to the anterior lateral right ventricle and anterior LV epicardium near the apex. The electric signals during sinus rhythm and pacing from the apex at 300-ms basic cycle length were recorded with a 528-channel, 2-KHz-sampling-rate mapping system and band pass–filtered between 0.5 Hz and 1 kHz. After that, a 10-minute VF episode induced by a 9-V battery touching the right ventricle was recorded.
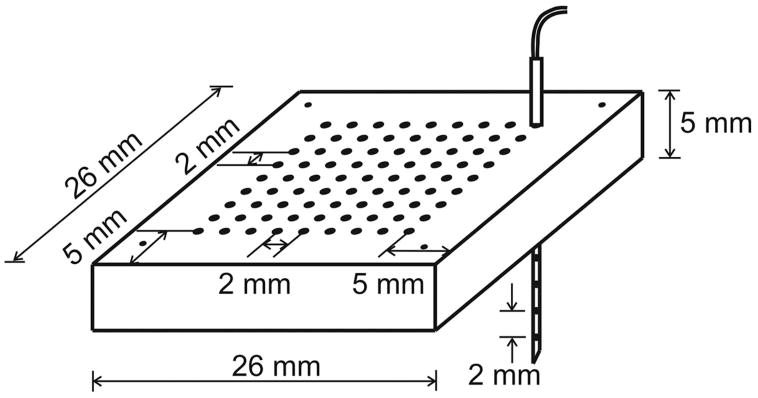
Six pigs were used for the 3D plunge needle study. A transparent silicon rubber (Sylgard 184, Dow Corning Corporation, Midland, Mich) plaque was sutured to the anterior LV epicardium ≈0.5 cm from the left anterior descending artery and ≈1 cm from the apex. The plaque contains 9×9 holes with 2-mm spacing for guidance of the needle insertions (Figure 1). Fiberglass-reinforced epoxy needles with a diameter <0.7 mm were constructed as described previously.19 Each needle contains 6 unipolar electrodes with 2 mm spacing. The size of the mapped regions is 1.8×1.8×1.2 cm3. The typical thickness of the LV free wall at our mapped regions is ≈1.6 cm. To alleviate ischemia, no needles were inserted through any holes with significant branches of the left anterior descending artery below them.
Figure 1.
Configuration of the plaque for 3D mapping. There are 9×9 holes at the center of the plaque for holding the needles. Four small holes at the corner are for suture. One plunge needle is shown inserted through the plaque.
After insertion of all needles, we waited for 30 minutes before the data recordings to eliminate the injury current. The activations during sinus rhythm, pacing, and 10 minutes of VF were recorded with the same settings as in 2D mapping. After the experiment, the heart was fixed in 10% formalin overnight. The locations of the needles and the electrodes were determined as described previously.20,21
Wavefront Analysis
Three-dimensional wavefront analysis programs were developed using algorithms similar to those for 2D analysis developed previously.16,17 Samples with the first time derivatives (dV/dt) less than −0.5 V/sec were considered active. Individual wavefronts were isolated by grouping active samples adjacent in space and time. The source wavefronts and the resultant wavefronts resulting from wavefront fractionation and collision were considered to be different wavefronts.
The following 4 types of wavefronts were recognized: (1) foci, a wavefront that appears de novo within the central portion of the mapped region, without arising from another wavefront or without propagating into the mapped region from outside it; (2) fractionation, a wavefront arising from the split of a previous wavefront into 2 or more wavefronts; (3) collision, a wavefront arising from 2 or more wavefronts colliding; and (4) boundary, a wavefront propagating into the mapped region from outside it. The 10-minute VF recording was divided into 600 one-second episodes. On each episode the above wavefront analysis was performed.
Reentry Analysis
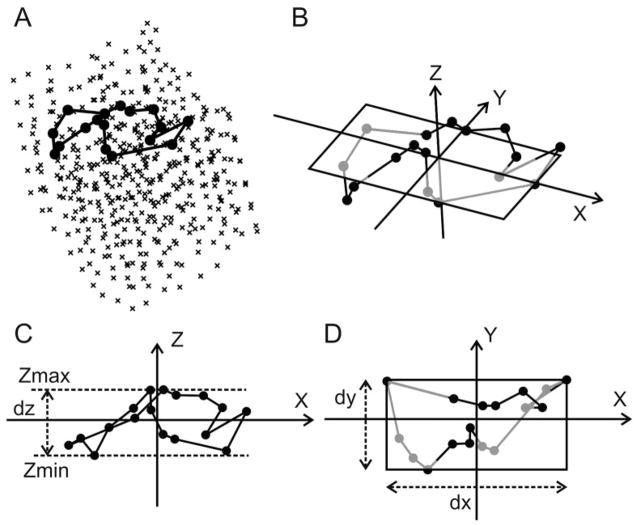
Three-dimensional reentry was detected using the same algorithm as in 2D.10 Wavefronts were combined into “components.” A component is defined as a group of wavefronts connected by fractionations and collisions. All components were divided into 3 types: (1) reentrant, which contains a sequence of wavefronts that activate the same portion of tissue more that once; (2) multiple-wavefront, which is nonreentrant, but contains multiple wavefronts,; (3) single-wavefront, which is nonreentrant and contains one wavefront. For the reentrant component, the wavetip and the core of the 3D reentry were defined in the same way as in 2D.10 In short, the broken end of a reentrant wave is called the “wavetip.” The wavetip path is defined as the shortest possible path connecting active electrodes in each frame of a reentrant component.10 When the wavetip path forms a closed cycle (Figure 2A), the region enclosed by the path is called the “core.”22 A reentry core was recognized when the reentry wavetip passes the same electrode twice within a certain time interval (details in online data supplement, available at http://circres.ahajournals.org). The cycle length of the reentry core was calculated.
Figure 2.
Three-dimensional reentry core analysis. A, Example of a program-recognized reentry core. Crosses represent electrodes. Filled black circles represent core electrodes. Black polygon represents wavetip path around the core. B, The final 3D Cartesian coordinate system. The x-y plane is the optimal 2D plane, on which the rectangle encompasses the reentry core. The core electrodes and the wavetip path below the rectangle are gray and above the plane are black. C and D, The content of B with different viewing angles and the definitions of dx, dy, and dz.
For each reentry core, an optimal 2D plane was calculated as follows. Firstly, a 3D Cartesian coordinate system (Figure 2B) is defined with its origin located at the geometric center of the core electrodes (all the electrodes located on the closed reentry wavetip path surrounding the reentry core). We define dx, dy, and dz as the maximum value minus the minimum value of the x, y, and z coordinates of the core electrodes. The orientation of the z-axis is determined such that dz is the smallest (Figure 2C). The x-y plane perpendicular to the z-axis (Figure 2B and 2D) is defined as the optimal 2D plane. When the 3D reentry cycle is projected on the optimal 2D plane, the “optimal” 2D view of the 3D reentry is achieved that shows the complete reentry circuit on this plane. Once the z-axis orientation is determined, the orientations of the x- and the y-axis are determined such that the product of dx and dy is the smallest (Figure 2D). Once the orientations of the x-, the y-, and the z-axis are all determined, dz is defined as the first short axis of the reentry core, the smaller value of dx and dy is defined as the second short axis, and the larger value of dx and dy is defined as the long axis. The core electrodes can be contained within a cuboid whose volume is the product of dx, dy, and dz, which is defined as the core size. The angles between the optimal 2D plane and the epicardial surface (represented by the 2D plane composed of the most epicardial electrode locations on all the needles) were calculated for each reentry core.
Evaluation of the Effect of the Three-Dimensional Mapping Array on Cardiac Electric Activation
To determine whether the introduction of the 3D mapping array significantly changes the electric properties of the tissue, we constructed a 2D plane using the electrodes located on the epicardium (the first electrode on each plunge needle). The conduction velocities (CVs) on this plane during sinus rhythm, pacing, and 10 minutes VF were compared with those from the 2D epicardial recordings at the same location. The CV was calculated using the algorithm of Salama et al.23
If the 3D mapping array had no significant effect on activation, the number of VF wavefronts entering and exiting the array should be equal. To test this prediction, all the electrodes were divided into 6 planes parallel to the epicardium (composed of the first to the sixth electrode on each needle). The planes closest to the epicardium and the endocardium were excluded from the analysis. The electrodes on the other 4 planes were divided into “boundary electrodes” composed of the most outside electrodes and “center electrodes” composed of the remaining electrodes. To evaluate whether there is unidirectional wavefront block at the boundary of the 3D array, we conducted the following analysis. The mean activation rates, defined as the number of activations (dV/dt changes from above −0.5 V/sec to below it) on each electrode per unit of time, of the boundary electrodes and the center electrodes were calculated for each 1-second VF episode and were compared. The number of wavefronts propagating from boundary electrodes to center electrodes per millimeter squared and the number of wavefronts propagating in the reverse direction per millimeter squared were counted and compared.
To determine whether insertion of the needles damages the tissue and causes focal activations, we visually inspected all the sinus rhythm activations after the insertion of the needles and before the 10-minute VF recordings. The number of ectopic beats was counted. Whether the ectopic beats initiated from outside or inside the mapped region was determined by analyzing the activation patterns.
Statistical Analysis
Group data were expressed as means±SD. Student t test was used to compare group data. ANOVA with repeated measures was used to compare the epicardial CV of 2D and 3D recordings and the difference between the boundary electrodes and the center electrodes during 10 minutes of VF. A 3D Kolmogorov–Smirnov goodness-of-fit test24 was conducted to determine whether the distribution of reentry wavetips and the sites of foci differed from a uniform distribution. P<0.05 was considered statistically significant.
Results
Effect of the Three-Dimensional Mapping Array on Cardiac Electric Activations
With 3D mapping, the CV at the epicardium during sinus rhythm was significantly decreased compared with 2D mapping (1.03±0.11 m/sec versus 1.37±0.34 m/sec, unpaired t test, P=0.04). During pacing from the apex at a 300-ms basic cycle length, the epicardial CV was not significantly different for 3D versus 2D (0.86±0.13 m/sec versus 0.95±0.17 m/sec, unpaired t test, P=0.25). During 10 minutes of VF, the epicardial CV was not significantly different for 3D versus 2D (ANOVA with repeated measures, P=0.31, see Figure II in the online data supplement for more details).
The activation rate difference between the boundary electrodes and the center electrodes was insignificant (ANOVA with repeated measures, P=0.07). The incidence of the wavefronts propagating from boundary to center was not significantly different from the incidence of the wavefronts in the reverse direction (ANOVA with repeated measures, P=0.69). More details are shown in supplemental Figure III.
Of the 739 sinus beats recorded from the 6 animals, 16 (2.1%) were ectopic beats, including 2 (0.3%) focal ectopic beats initiating from inside the mapped region. The incidence of foci during sinus rhythm was significantly lower than that during the first 10 seconds of VF (0.0022±0.0038 foci/sec versus 0.5±0.48 foci/sec, P=0.03, paired t test).
Intramural Reentrant Circuits
Of the 80 565 components detected during the six 10-minute VF episodes, 419 (0.5%) were reentrant, 10 339 (12.8%) were multiple-wavefront, and 69 807 (86.6%) were single-wavefront. A representative example of program-detected 3D reentry is shown in Figure 3. This reentry lasted 3 complete cycles. During each cycle, the reentry wavetip meandered along a complex 3D pathway, making it difficult to identify reentry by visual inspection of the 3D isochronal maps (Figure 3, first column). However, the complete reentrant circuit was observed on the 2D optimal plane for each cycle (Figure 3, second column). None of the 2D optimal planes was parallel to the epicardium. Therefore, these intramural reentrant circuits may not appear “reentrant” on the epicardial surface. A complete reentrant circuit was also observed from the electric recordings around the reentry core (Figure 3, fourth column), where the activation propagated from electrode 1 to electrode 10 and then reentered at electrode 1. Double-peak activations were observed at electrodes 2 and 9, which were located at the sharp-angle corners of the reentry core.
Figure 3.
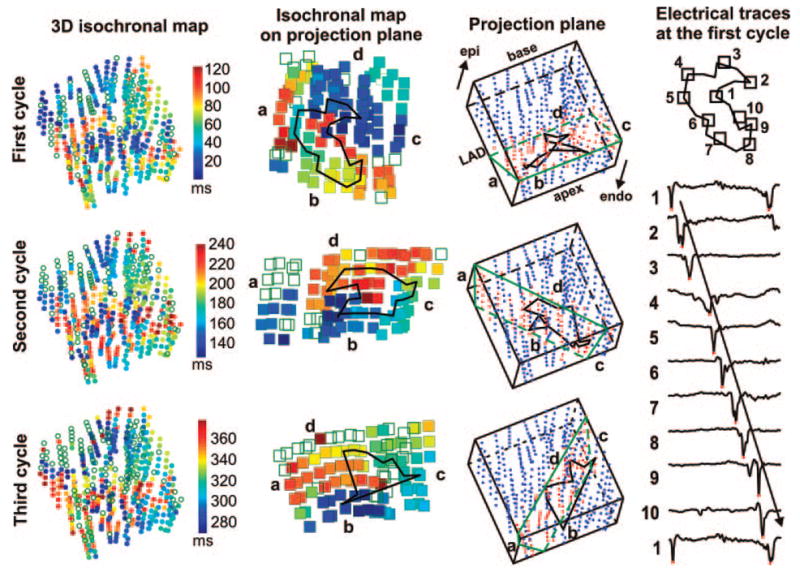
Recordings demonstrating intramural reentry. The first column shows isochronal activation maps of the 3 reentrant cycles. The 6 electrodes along each needle are shown as a row of 6 circles. Empty circles represent electrodes not activated during this cycle. Colors indicate the local activation time at each electrode according to the time scale displayed at the right side of the first column. The green outlines in the third column represent the 2D optimal planes. The electrodes within 1.5 mm of these planes are shown as red dots. The second column shows the projected isochronal maps of these electrodes on the 2D optimal planes. The time scale is the same as for the first column. The reentry wavetip path is shown as black polygons in the second and third columns. The orientation of the 3D preparation is shown in the first row, third column. The fourth column demonstrates the dV/dt traces from the 10 core electrodes shown at the top during the first reentrant cycle. The red dots on traces represent the local activation time when the dV/dt reached a minimum.
Characteristics of Reentry Cores
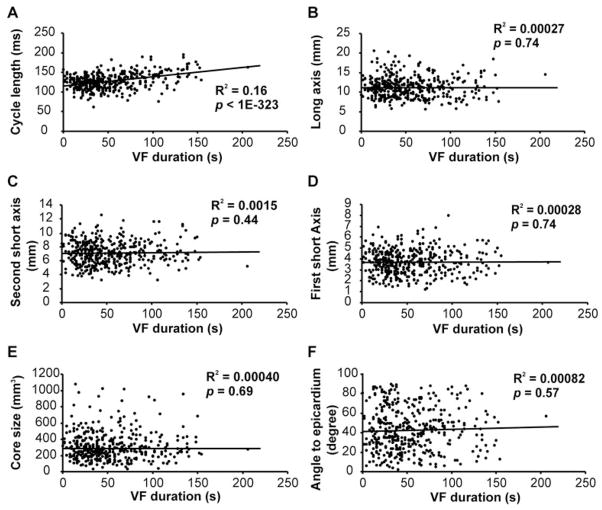
The characteristics of the reentry core during 10 minutes of VF are shown in Figure 4. The size of the reentry core was 322±177 mm3, which was ≈12.6% of the mapped volume. The angle between the 2D optimal planes of the reentry core and the epicardial surface was 42° ± 22°. The cycle length increased as VF continued. The size and orientation of the core didn’t change with VF duration.
Figure 4.
The characteristics of the reentry cores in 10-minute VF. A, The cycle length of the reentry cores. B through D, The long axis (B), the second short axis (C), and the first short axis (D) of the reentry cores. E, The size of the reentry cores. F, The angle between the optimal 2D plane and the epicardial surface. In A through F, the reentry core parameters of the 6 animals are shown as scattered dots, and the line is the linear regression fit of the reentry core parameters to the time of reentry occurrence after VF induction. The R2 and the probability values of the fit are indicated.
Intramural Focal Wavefronts
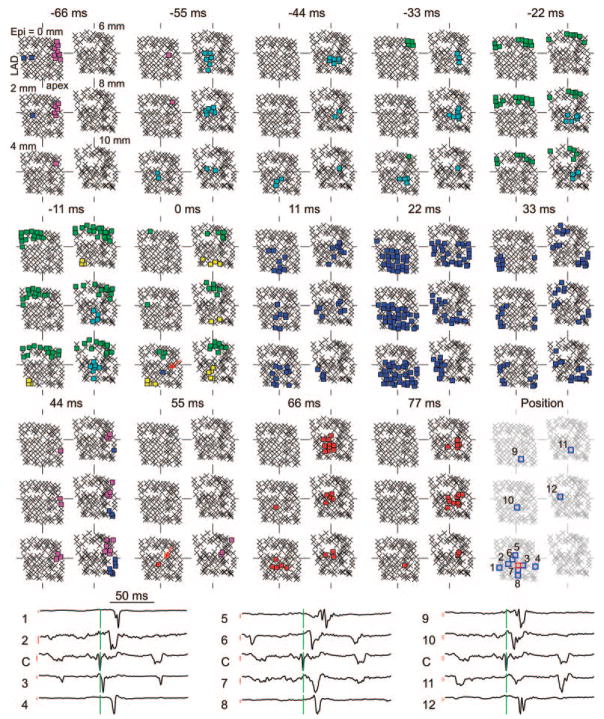
In the six 10-minute VF episodes, the program identified a total of 135 534 wavefronts, of which 12 997 (9.6%) arose from foci, 15 774 (11.6%) arose from collision, 25 328 (18.7%) arose from fractionation, and 81 453 (60.1%) entered from the boundary. A representative example of focal wavefronts is shown in Figure 5. In the 0-ms frame, the wavefront in blue did not originate through wavefront collision or fractionation nor did it propagate into the mapped region from outside it. Therefore, this wavefront was considered to arise from a focus. In the 11-, 22-, 33-, and 44-ms frames, it propagated to other portions of the mapped region. In the 55-ms frame, another focus (red wavefront) appeared within the central potion of the mapped region. Unlike the blue focal wavefront, the red one blocked, probably because of the short time interval between the 2 foci. This focal pattern was also confirmed by the electric recordings at and around the focus initiation area (Figure 5, fourth row). The blue focal wavefront originated at the center electrode (Figure 5, third row, fifth column, red square) and then spread to other electrodes away from it.
Figure 5.
Recordings demonstrating successive intramural foci. The electrodes are displayed in 6 planes parallel to the epicardial surface that are 2 mm apart. The plane labeled “Epi=0 mm” is composed of the most epicardial electrodes on all needles. The color squares represent the electrodes at which dV/dt was less than −0.5 V/sec sometime during each 11-ms interval. Each color represents a different wavefront. Crosses represent electrodes not activated during the 11-ms interval. The focal initiations of wavefronts are indicated with red arrows in the 0- and 55-ms frames. The dV/dt traces of some electrodes at and around the site of the first focus are shown in the fourth row. The locations of these needles are indicated in the third row, fifth column. The electrode marked in red square is labeled “C” in the fourth row, which is the initiation electrode of the first focal wavefront. The green lines in the fourth row correspond to 0 ms. The red lines in the fourth row are the scale bars for the dV/dt curves. The height of the scale bar corresponds to 0.5 V/sec. The top of the scale bar corresponds to the baseline where dV/dt=0 V/sec.
Incidence of Intramural Reentry and Foci
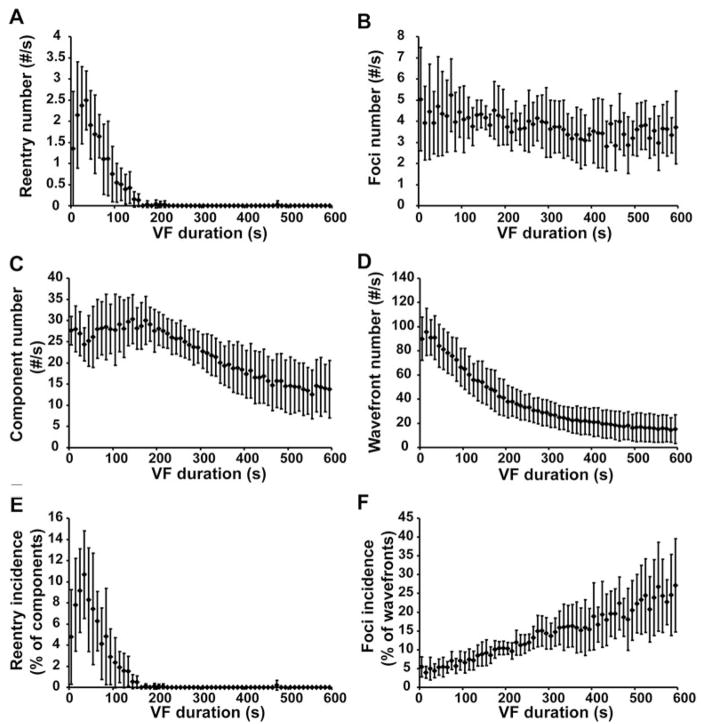
The incidence of reentry and foci were different at different stages of VF (Figure 6). During the first 10 seconds of VF, the average incidence of 3D reentry was 4.8±4.5% of the components. As VF continued, the incidence increased until it reached a maximum value of 10.7±4.1% of components at 30 to 40 seconds of VF. Reentry incidence then decreased as VF continued until, after 3 minutes, almost no reentry was detected in the mapped region. In comparison, the incidence of foci was 5.5±2.9% of wavefronts during the first 10 seconds of VF and increased as VF continued. After 10 minutes of VF, 27.1±13.9% of the wavefronts arose from foci (0 to 10 seconds versus 590 to 600 seconds, n=6, paired t test, P=0.03).
Figure 6.
Incidence of reentry and foci at 10-second intervals during VF. A, C, and E, The number of occurrences of reentry per second (A), the number of components per second (C), and the reentry incidence (the number of occurrences of reentry divided by the number of components) (E). B, D, and F, The number of foci per second (B), the number of wavefronts per second (D), and the foci incidence (the number of foci divided by the number of wavefronts) (F). The mean values and the standard deviations from all 6 animals are displayed.
Distribution of Intramural Reentry and Foci
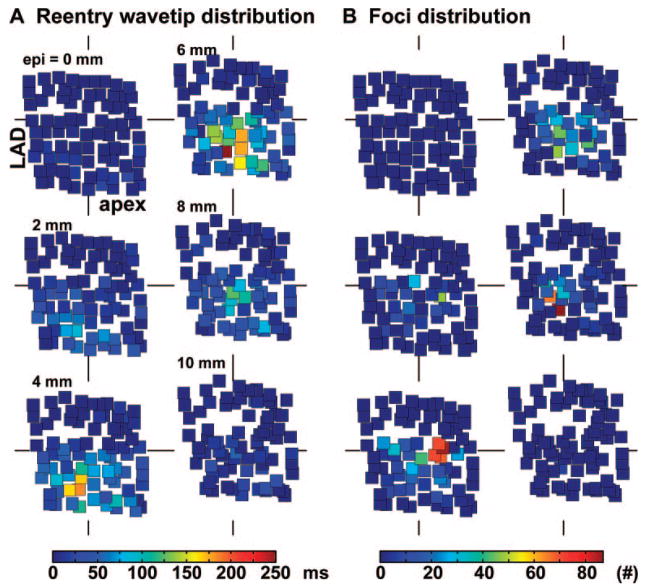
To determine whether reentry or foci occurred repeatedly at specific locations, we plotted the 3D distributions of the reentry wavetips and the sites of foci for each heart. A representative example is shown in Figure 7. The distributions of reentry wavetips/the sites of foci differed significantly (P<0.05) from a uniform random distribution in all 6 pigs. The reentry wavetips and foci tended to cluster in different regions in each heart. Also, the cluster regions of reentry wavetips/foci were not consistent from heart to heart.
Figure 7.
Spatial distributions of reentry wavetips and sites of focal origins of wavefronts during 10 minutes of VF in 1 animal. The electrodes are divided into 6 planes as in Figure 5. Filled squares represent electrodes. In A, the color of the square indicates how long the electrode was on a reentry wavetip during the 10-minute period. In B, the color of the square represents the incidence of foci arising at that electrode. The corresponding color bars are shown at the bottom of A and B.
Discussion
The major findings of our study are as follows. (1) Intramural reentrant circuits are present early during VF. After 3 minutes, intramural reentrant circuits are rarely detected. (2) Intramural foci are also present during early VF but with a low incidence. The incidence of intramural foci increases throughout the first 10 minutes of VF. (3) The sites of foci and of reentry wavetips cluster in specific regions of the working myocardium.
Although analysis of the effect of closely spaced plunge needles on the epicardial CV and the activation rates and wavefront propagation direction on the mapping array boundary indicated that insertion of the needles slightly changed the dynamics of cardiac electric activity, it is unlikely that these changes caused the temporal changes of the dynamics of reentry and foci in this study. Two-dimensional reentrant circuits are not detected on the LV epicardium during later VF,25 which is a necessary condition for our observation that the incidence of intramural reentry decreased almost to 0 after 3 minutes of VF. The size of the reentry core did not change significantly as VF continued. Therefore, it is unlikely that the decrease of reentry incidence with VF duration was an artifact resulting from the reentry core enlarging as VF continued, so that it was less frequently entirely contained within the mapped region. Our study also provided evidence against the possibility that the foci could have resulted from tissue damage caused by the needles. Only 2 focal ectopic beats originated within the mapping region during a total of 515 seconds of sinus rhythm before the induction of VF.
Whereas functional or anatomic reentry is frequently observed in guinea pig and rabbit hearts during early VF,5–8 electric and optical mapping in dogs, pigs, and humans indicates that less than ≈8% of wavefronts on the epicardium exhibit reentry during this period.9–12 Intramural reentry has been suggested to be a possible site of a “mother rotor”11,26 responsible for VF maintenance.11,13 Although we did observe intramural reentry as shown in Figure 3, its incidence in the mapped region was not high during early VF, and, after 3 minutes of VF, the incidence of intramural reentry decreased almost to 0. These findings do not support the possibility that the mapped region, the anterior papillary muscle insertion, serves as a “mother rotor” during VF maintenance11,26 in swine hearts. However, because we only recorded the electric activity from a small portion of the heart, the possibility that a mother rotor persists in the unmapped region and plays a significant role in VF maintenance cannot be excluded. Our wavefront analysis indicated that many wavefronts propagated into the mapping region from surrounding tissue during 10 minutes of VF.
To the best of our knowledge, no experimental study has previously examined the incidence of intramural foci during VF because no study has previously recorded activation sequences in 3D with electrodes sufficiently close to track the complex wavefront pathways of VF.27 Although focal patterns of activation have been observed on the epicardial or endocardial surface,12,18 modeling studies28,29 have suggested that this activation pattern represents breakthrough to the epicardium or endocardium originating from intramural reentry or Purkinje–myocardium junctions. Our study used expanded electric mapping techniques that allowed direct examination for intramural foci. In this study, the incidence of intramural foci increases as VF continues, suggesting its increasingly important role in VF maintenance as VF continues. For several reasons, it is possible that these foci arise from the Purkinje fibers, by triggered activity, abnormal automaticity, or reentry. (1) Purkinje fibers of pigs extend from the subendocardium almost to the epicardium.30 (2) Purkinje fibers are more tolerant to the global ischemia during long-duration VF than is the working myocardium.31 (3) Although the refractory period of Purkinje fibers is longer than that of working myocardium at normal heart rates, it is as short as or shorter than that of working myocardium at the rapid activation rates of VF.32 (4) Triggered activity has been shown to occur in the Purkinje fibers during high extracellular potassium concentration and acidosis,33,34 as can occur during long duration VF. (5) Enhanced automaticity has been observed in Purkinje fibers of ischemic hearts.35,36 (6) Microreentry has been suggested to be a possible driving force of focal arrhythmia.37 In addition, a modeling study suggested Purkinje–muscle reentry as a possible mechanism for polymorphic ventricular arrhythmia.28 Focal activity may also arise from the Purkinje–myocardial junctions through triggered activity under certain conditions.38 Focal activity may also arise from the working myocardium through the mechanisms of early or delayed afterdepolarizations.1
Transmural mapping from a row of plunge needles in the lateral free wall of pig LV revealed that intramural reentry during early VF is very rare, with an incidence of ≈0.3% of the components.39 However, the incidence of intramural reentry in our study is 7.2% of the components for the same stage of VF. Two issues may account for this difference in intramural reentry incidence. (1) We mapped activation near the insertion of the anterior papillary muscle, which is thought to be an anchoring site for spiral waves.7 (2) The intramural reentry cores are complex 3D structures (Figures 2 and 3), so that complete reentrant circuits are only infrequently present in a single plane perpendicular to the epicardium. In our mapped region, the 2D optimal plane of the reentry core was neither parallel with nor perpendicular to the epicardium, which implied that the complete reentrant circuits will be less frequently observed in a 2D plane parallel with or perpendicular to the epicardium than in 3D mapping. In an optical mapping study, Valderrabano et al mapped the cut edge of a porcine LV wedge preparation and found that 23% of the intramural activations were part of a reentrant pathway during early VF,8 which is much higher than in our study (8.1% of the components). The different experimental preparations may contribute to this difference. Modeling studies40 have shown that the filament of the 3D scroll wave tends to attach to an external boundary, such as the cut edge of a ventricle wedge, which may increase the incidence of reentry observed on the boundary.
The limitations of our study are as follows. (1) The mapped region was ≈3.9 cm3, which was ≈4% of the LV free wall volume. Therefore reentry incidence probably was underestimated because some intramural reentrant circuits could have been only partially located in the mapped region. (2) The spatial resolution of our mapping was ≈2 mm. Although this resolution allows quantitative wavefront analysis, microreentry could not be detected. (3) It could not be determined whether the intramural foci are initiated through focal sources such as afterdepolarization and triggered activity from the Purkinje system or through reentry circuits partially or totally within the Purkinje fibers. The sparse distribution of the Purkinje fibers in the working myocardium makes it difficult to record activation pathways within them.41
Supplementary Material
Acknowledgments
This work was supported by NIH Research grants HL-28429, HL-66256, and HL-85370.
Footnotes
Disclosures
None.
References
- 1.Zipes DP, Jalife J, editors. Cardiac Electrophysiology: From Cell to Bedside. IV. Philadelphia, Pa: WB Saunders Co; 2004. [Google Scholar]
- 2.Winfree AT. Mechanisms of cardiac fibrillation. Science. 1995;270:1224–1225. [Google Scholar]
- 3.Panfilov AV, Hogeweg P. Mechanisms of cardiac fibrillation. Science. 1995;270:1223–1224. [PubMed] [Google Scholar]
- 4.Gray RA, Jalife J, Panfilov AV, Baxter WT, Cabo C, Davidenko JM, Pertsov AM. Mechanisms of cardiac fibrillation. Science. 1995;270:1222–1223. [PubMed] [Google Scholar]
- 5.Jalife J, Gray R. Drifting vortices of electrical waves underlie ventricular fibrillation in the rabbit heart. Acta Physiol Scand. 1996;157:123–131. doi: 10.1046/j.1365-201X.1996.505249000.x. [DOI] [PubMed] [Google Scholar]
- 6.Samie FH, Berenfeld O, Anumonwo J, Mironov SF, Udassi S, Beaumont J, Taffet S, Pertsov AM, Jalife J. Rectification of the background potassium current: a determinant of rotor dynamics in ventricular fibrillation. Circ Res. 2001;89:1216–1223. doi: 10.1161/hh2401.100818. [DOI] [PubMed] [Google Scholar]
- 7.Kim YH, Xie F, Yashima M, Wu TJ, Valderrabano M, Lee MH, Ohara T, Voroshilovsky O, Doshi RN, Fishbein MC, Qu Z, Garfinkel A, Weiss JN, Karagueuzian HS, Chen PS. Role of papillary muscle in the generation and maintenance of reentry during ventricular tachycardia and fibrillation in isolated swine right ventricle. Circulation. 1999;100:1450–1459. doi: 10.1161/01.cir.100.13.1450. [DOI] [PubMed] [Google Scholar]
- 8.Valderrabano M, Lee MH, Ohara T, Lai AC, Fishbein MC, Lin SF, Karagueuzian HS, Chen PS. Dynamics of intramural and transmural reentry during ventricular fibrillation in isolated swine ventricles. Circ Res. 2001;88:839–848. doi: 10.1161/hh0801.089259. [DOI] [PubMed] [Google Scholar]
- 9.Chen PS, Wolf PD, Dixon EG, Danieley ND, Frazier DW, Smith WM, Ideker RE. Mechanism of ventricular vulnerability to single premature stimuli in open-chest dogs. Circ Res. 1988;62:1191–1209. doi: 10.1161/01.res.62.6.1191. [DOI] [PubMed] [Google Scholar]
- 10.Rogers JM, Huang J, Smith WM, Ideker RE. Incidence, evolution, and spatial distribution of functional reentry during ventricular fibrillation in pigs. Circ Res. 1999;84:945–954. doi: 10.1161/01.res.84.8.945. [DOI] [PubMed] [Google Scholar]
- 11.Zaitsev AV, Berenfeld O, Mironov SF, Jalife J, Pertsov AM. Distribution of excitation frequencies on the epicardial and endocardial surfaces of fibrillating ventricular wall of the sheep heart. Circ Res. 2000;86:408–417. doi: 10.1161/01.res.86.4.408. [DOI] [PubMed] [Google Scholar]
- 12.Nanthakumar K, Huang J, Rogers JM, Johnson PL, Newton JC, Walcott GP, Justice RK, Rollins DL, Smith WM, Ideker RE. Regional differences in ventricular fibrillation in the open-chest porcine left ventricle. Circ Res. 2002;91:733–740. doi: 10.1161/01.res.0000038945.66661.21. [DOI] [PubMed] [Google Scholar]
- 13.Berenfeld O, Pertsov AM. Dynamics of intramural scroll waves in three-dimensional continuous myocardium with rotational anisotropy. J Theor Biol. 1999;199:383–394. doi: 10.1006/jtbi.1999.0965. [DOI] [PubMed] [Google Scholar]
- 14.Valenzuela TD, Roe DJ, Cretin S, Spaite DW, Larsen MP. Estimating effectiveness of cardiac arrest interventions: a logistic regression survival model. Circulation. 1997;96:3308–3313. doi: 10.1161/01.cir.96.10.3308. [DOI] [PubMed] [Google Scholar]
- 15.Valenzuela TD, Roe DJ, Nichol G, Clark LL, Spaite DW, Hardman RG. Outcomes of rapid defibrillation by security officers after cardiac arrest in casinos. N Engl J Med. 2000;343:1206–1209. doi: 10.1056/NEJM200010263431701. [DOI] [PubMed] [Google Scholar]
- 16.Rogers JM, Usui M, KenKnight BH, Ideker RE, Smith WM. A quantitative framework for analyzing epicardial activation patterns during ventricular fibrillation. Ann Biomed Eng. 1997;25:749–760. doi: 10.1007/BF02684159. [DOI] [PubMed] [Google Scholar]
- 17.Rogers JM, Usui M, KenKnight BH, Ideker RE, Smith WM. Recurrent wavefront morphologies: a method for quantifying the complexity of epicardial activation patterns. Ann Biomed Eng. 1997;25:761–768. doi: 10.1007/BF02684160. [DOI] [PubMed] [Google Scholar]
- 18.Huang J, Walcott GP, Killingsworth CR, Melnick SB, Rogers JM, Ideker RE. Quantification of activation patterns during ventricular fibrillation in open-chest porcine left ventricle and septum. Heart Rhythm. 2005;2:720–728. doi: 10.1016/j.hrthm.2005.03.025. [DOI] [PubMed] [Google Scholar]
- 19.Rogers JM, Melnick SB, Huang J. Fiberglass needle electrodes for transmural cardiac mapping. IEEE Trans Biomed Eng. 2002;49:1639–1641. doi: 10.1109/TBME.2002.805483. [DOI] [PubMed] [Google Scholar]
- 20.Chattipakorn N, Fotuhi PC, Chattipakorn SC, Ideker RE. Three-dimensional mapping of earliest activation after near-threshold ventricular defibrillation shocks. J Cardiovasc Electrophysiol. 2003;14:65–69. doi: 10.1046/j.1540-8167.2003.02397.x. [DOI] [PubMed] [Google Scholar]
- 21.Barnette AR, Bayly PV, Zhang S, Walcott GP, Ideker RE, Smith WM. Estimation of 3-D conduction velocity vector fields from cardiac mapping data. IEEE Trans Biomed Eng. 2000;47:1027–1035. doi: 10.1109/10.855929. [DOI] [PubMed] [Google Scholar]
- 22.Davidenko JM, Salomonsz R, Pertsov AM, Baxter WT, Jalife J. Effects of pacing on stationary reentrant activity. Theoretical and experimental study. Circ Res. 1995;77:1166–1179. doi: 10.1161/01.res.77.6.1166. [DOI] [PubMed] [Google Scholar]
- 23.Salama G, Kanai A, Efimov IR. Subthreshold stimulation of Purkinje fibers interrupts ventricular tachycardia in intact hearts. Experimental study with voltage-sensitive dyes and imaging techniques. Circ Res. 1994;74:604–619. doi: 10.1161/01.res.74.4.604. [DOI] [PubMed] [Google Scholar]
- 24.Fasano G, Franceschini A. A multidimensional version of the Kolmogorov-Smirnov test. Mon Not R Astron Soc. 1987;225:155–170. [Google Scholar]
- 25.Huang J, Rogers JM, Killingsworth CR, Singh KP, Smith WM, Ideker RE. Evolution of activation patterns during long-duration ventricular fibrillation in dogs. Am J Physiol Heart Circ Physiol. 2004;286:H1193–H1200. doi: 10.1152/ajpheart.00773.2003. [DOI] [PubMed] [Google Scholar]
- 26.Samie FH, Mironov S, Mandapati R, Vaidya D, Berenfeld O, Udassi S, Zaitsev AV, Pertsov A, Jalife J. A gradient of excitation frequencies in the ventricles of the isolated Langendorff-perfused guinea pig during ventricular fibrillation. Circ. 1999;100:I–874. [Google Scholar]
- 27.Bayly PV, Johnson EE, Idriss SF, Ideker RE, Smith WM. Efficient electrode spacing for examining spatial organization during ventricular fibrillation. IEEE Trans Biomed Eng. 1993;40:1060–1066. doi: 10.1109/10.247805. [DOI] [PubMed] [Google Scholar]
- 28.Berenfeld O, Jalife J. Purkinje-muscle reentry as a mechanism of polymorphic ventricular arrhythmias in a 3-dimensional model of the ventricles. Circ Res. 1998;82:1063–1077. doi: 10.1161/01.res.82.10.1063. [DOI] [PubMed] [Google Scholar]
- 29.Ashihara T, Namba T, Ikeda T, Ito M, Kinoshita M, Nakazawa K. Breakthrough waves during ventricular fibrillation depend on the degree of rotational anisotropy and the boundary conditions: a simulation study. J Cardiovasc Electrophysiol. 2001;12:312–322. doi: 10.1046/j.1540-8167.2001.00312.x. [DOI] [PubMed] [Google Scholar]
- 30.Holland RP, Brooks H. The QRS complex during myocardial ischemia. An experimental analysis in the porcine heart. J Clin Invest. 1976;57:541–550. doi: 10.1172/JCI108309. [DOI] [PMC free article] [PubMed] [Google Scholar]
- 31.Taylor IM, Shaikh NA, Downar E. Ultrastructural changes of ischemic injury due to coronary artery occlusion in the porcine heart. J Mol Cell Cardiol. 1984;16:79–94. doi: 10.1016/s0022-2828(84)80716-6. [DOI] [PubMed] [Google Scholar]
- 32.Carmeliet E, Vereecke J. Electrogenesis of the action potential and automaticity. In: Berne RM, editor. Handbook of Physiology: Section 2: The Cardiovascular System. Baltimore, Md: Williams & Wilkins Co; 1979. pp. 269–334. [Google Scholar]
- 33.Pogwizd SM, Onufer JR, Kramer JB, Sobel BE, Corr PB. Induction of delayed afterdepolarizations and triggered activity in canine Purkinje fibers by lysophosphoglycerides. Circ Res. 1986;59:416–426. doi: 10.1161/01.res.59.4.416. [DOI] [PubMed] [Google Scholar]
- 34.Vleugels A, Vereecke J, Carmeliet E. Ionic currents during hypoxia in voltage-clamped cat ventricular muscle. Circ Res. 1980;47:501–508. doi: 10.1161/01.res.47.4.501. [DOI] [PubMed] [Google Scholar]
- 35.Lazzara R, el-Sherif N, Scherlag BJ. Electrophysiological properties of canine Purkinje cells in one-day-old myocardial infarction. Circ Res. 1973;33:722–734. doi: 10.1161/01.res.33.6.722. [DOI] [PubMed] [Google Scholar]
- 36.Friedman PL, Stewart JR, Fenoglio JJ, Jr, Wit AL. Survival of subendocardial Purkinje fibers after extensive myocardial infarction in dogs. Circ Res. 1973;33:597–611. doi: 10.1161/01.res.33.5.597. [DOI] [PubMed] [Google Scholar]
- 37.Chen SA, Chiang CE, Yang CJ, Cheng CC, Wu TJ, Wang SP, Chiang BN, Chang MS. Sustained atrial tachycardia in adult patients. Electrophysiological characteristics, pharmacological response, possible mechanisms, and effects of radiofrequency ablation. Circulation. 1994;90:1262–1278. doi: 10.1161/01.cir.90.3.1262. [DOI] [PubMed] [Google Scholar]
- 38.Li ZY, Wang YH, Maldonado C, Kupersmith J. Role of junctional zone cells between Purkinje fibres and ventricular muscle in arrhythmogenesis. Cardiovasc Res. 1994;28:1277–1284. doi: 10.1093/cvr/28.8.1277. [DOI] [PubMed] [Google Scholar]
- 39.Rogers JM, Huang J, Melnick SB, Ideker RE. Sustained reentry in the left ventricle of fibrillating pig hearts. Circ Res. 2003;92:539–545. doi: 10.1161/01.RES.0000061569.23879.20. [DOI] [PubMed] [Google Scholar]
- 40.Pertsov AM, Wellner M, Vinson M, Jalife J. Topological constraint on scroll wave pinning. Phys Rev Lett. 2000;84:2738–2741. doi: 10.1103/PhysRevLett.84.2738. [DOI] [PubMed] [Google Scholar]
- 41.Tabereaux PB, Walcott GP, Rogers JM, Kim J, Dosdall DJ, Robertson PG, Killingsworth CR, Smith WM, Ideker RE. Activation patterns of Purkinje fibers during long-duration ventricular fibrillation in an isolated canine heart model. Circulation. 2007;116:1113–1119. doi: 10.1161/CIRCULATIONAHA.107.699264. [DOI] [PubMed] [Google Scholar]
Associated Data
This section collects any data citations, data availability statements, or supplementary materials included in this article.


