Abstract
Triarylmethyl radicals, TAMs, are useful soluble paramagnetic probes for EPR spectroscopic and imaging applications because of their extraordinary stability in living tissues, narrow line width, high analytical resolution at micromolar concentrations and enhanced sensitivity to molecular oxygen. Recently we proposed the concept of dual function pH and oxygen TAM probes based on the incorporation of ionizable groups into the TAM structure (J. Am. Chem. Soc. 2007, 129 (23), 7240–7241). In this paper we report the synthesis of TAM derivatives containing amino groups. The synthesized TAMs combine stability with oxygen and pH sensitivity, in the range of pH from 6.8 to 9.0. To decrease the number of spectral components and improve probe solubility at physiological pH, asymmetric TAM derivatives containing both carboxyl and amino functions were synthesized. The presence of nitrogen and hydrogen atoms in direct proximity to protonatable amino groups resulted in strong pH-induced changes to the corresponding hyperfine splittings, Δhfs ≈ (300–1000) mG, comparable to the values of hfs themselves. Large pH-dependent line shifts of individual spectral components, with narrow linewidths of (160–280) mG, allow for easy discrimination between the pH effect and the observed oxygen-dependent line broadening of about (6 ± 0.5) mG per % oxygen. The synthesized TAM derivatives represent the first dual function pH and oxygen paramagnetic probes with reasonably valuable properties for biomedical research.
Introduction
Certain pathological conditions such as an interruption of normal blood supply or biochemical shock result in a compromise of local oxygen delivery and the body’s ability to regulate pH. Various diseases (cancer, myocardial infarction, stroke, and pulmonary toxicity) are closely related to abnormal tissue oxygen concentrations and acidosis. In vivo measurement and mapping of molecular oxygen and pH are important for understanding their roles and, to eventually, develop a clinical diagnostic to individuate patient treatments. NMR- and low-field EPR-based techniques are the most appropriate approaches for noninvasive in vivo oxygen and pH assessment attributable to their reasonable magnetic field depth of penetration in animals and humans. Clinically relevant noninvasive in vivo pH measurements using 31P NMR and inorganic phosphate, Pi, still suffer from lack of resolution because Pi concentrations vary with metabolism and ischemia, the Pi chemical shift is dependent on ionic strength,1 and the method does not indicate extracellular acidosis, e.g., in malignant tumors.2 Exogenous pH probes are being designed for NMR spectroscopy to improve detection of tissue acidity.3 NMR techniques for [O2] measurement also rely on exogenous probes, e.g. 19F NMR/MRI using perfluorocarbon (PFC) emulsions4,5 and fluorinated nitroimidazoles,6 and have their own limitations due to the dependence of spin—lattice relaxation rates of fluorinated probes on other physiological or histological parameters.5
Electron paramagnetic resonance (EPR) spectroscopy has been shown to be an effective method for measuring free radicals in biological systems and has a much higher intrinsic sensitivity to exogenous probe concentration when compared to NMR. Among soluble paramagnetic probes, nitroxyl radicals, NRs, and trityl or triarylmethyl radicals, TAMs, have the highest potential for functional EPR applications. The use of NRs as oxygen probes pioneered EPR oximetry.7–9 pH-sensitive NRs were applied to real time pH monitoring both in vitro and in vivo.10–12 However, NRs use for in vivo EPR oxygen and pH measurements have been hampered by their fast bioreduction to EPR-silent products. Recently TAM radicals have been developed as image-enhancing agents13,14 and significantly expanded the potential for using oxygen-sensitive free radicals in EPR, EPR imaging, and related techniques such as dynamic nuclear polarization and Overhauser enhanced magnetic resonance imaging, OMRI.15 The extraordinary stability of TAM radicals in living tissues, with a half-life in human blood of a few hours to more than 24 h depending on the particular structure of the compound,14 makes them particularly attractive for in vivo oxygen mapping. Reactivity of some derivatives of TAM radicals to superoxide anion16,17 has also been reported and might be explored for biological applications.
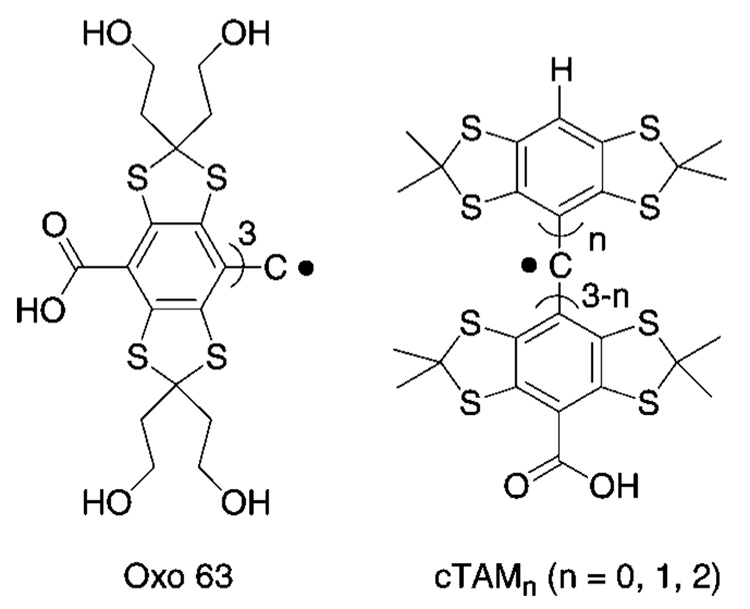
Recently we described a concept of enhancing functionality of the TAM radicals by introducing ionizable groups into the TAM structure to cause pH sensitivity of their magnetic resonance parameters18 similar to the previously reported phenomenon for pH-sensitive NR.10 We demonstrated the potential value of this approach for carboxyl group-containing TAMs (see Scheme 1). The corresponding TAM derivatives have the advantage of combining EPR spectral sensitivity to pH and oxygen with high stability in living tissues. However, Oxo63 and cTAMs derivatives (Scheme 1), while supporting the concept,18 hardly can be used in practical systems because of the limited range of pH sensitivity, around pKa ≈ 2.6, of the carboxyl group, low values of spectroscopic change upon pH variation, and insufficient aqueous solubility of cTAMs in neutral form when the carboxyl group is protonated. General synthesis of TAMs, including large-scale production was recently described.19,20 However, derivatization of TAMs to optimize spectral properties, aqueous solubility, oxygen and pH sensitivities, is a tremendously difficult task. Here we report synthesis and characterization of amino group-containing TAM derivatives as a first attempt at a practical dual function pH and oxygen probes for EPR spectroscopy.
Scheme 1.
Chemical structures of Carboxyl Group-Containing TAM Derivatives, Oxo63 and cTAMsa18
a The X-band EPR spectra of Oxo63 and cTAM0 demonstrate a single spectral line with a pH-sensitive shift in acidic solutions (e.g., around pKa ≈ 2.6 of the carboxyl group for Oxo63) but lose their pH sensitivity at low frequency L-band EPR. cTAM1 and cTAM2 demonstrate frequency independent hyperfine splitting (aH) sensitivity to pH, but they have poor aqueous solubility in neutral form at low pH when COOH groups are protonated.
Experimental Methods
Synthesis
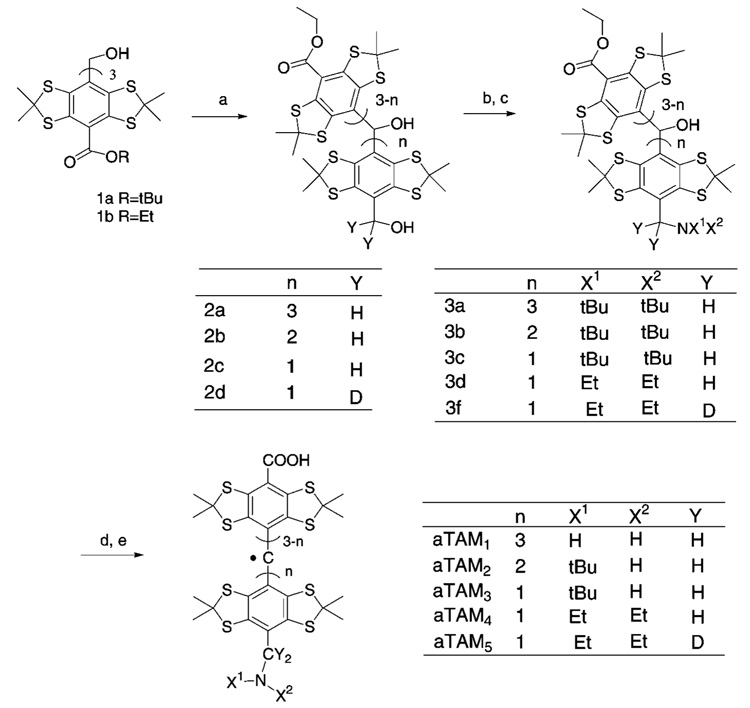
The general route for the synthesis of amino-containing TAM derivatives is shown in the Scheme 2. The detailed experimental procedure and spectral data are given in Supporting Information.
Scheme 2.
Synthesis of Dual pH and Oxygen Spin Probesa
a (a) LiAlH4, THF; (b) MsCl, TEA, THF; (c) NHX1X2; (d) KOH/ 1,4-dioxane (not used when n = 3); (e) CF3COOH.
General Procedure for the Synthesis of Compounds 3a–f
The appropriate trityl alcohol (0.03 mmol) was dissolved in 7 mL of THF. Mesyl chloride (0.05 mL, 0.6 mmol), followed by triethylamine (0.09 mL, 0.6 mmol), was added, and the solution was stirred for 60 min. Excess tert-butylamine (1 mL) (or diethylamine, 1 mL) was added all at once, and the reaction was stirred overnight. The reaction mixture was quenched with 10 mL of water and extracted with 2 × 20 mL of ethyl acetate. The organic phase was dried on sodium sulfate, filtered, and evaporated to afford the crude product. The pure product was isolated by flash chromatography on silica-gel eluting with hexanes—ethyl acetate.
General Procedure for the Synthesis of Radicals aTAM1—aTAM5
The synthetic route to symmetrical probe, aTAM1 (see Results), served as a model for optimization of the general procedure for the synthesis of aTAM2–5 derivatives from primary alcohols. The appropriate compound 3b–f (0.015 mmol) was dissolved in 5 mL of 1,4-dioxane. One milliliter of 12 M aqueous KOH was added, and the resulting solution was refluxed for 8 h. The reaction was neutralized with 1 mL of TFA and partitioned between 5 mL of water and 10 mL of chloroform. The aqueous phase was extracted again with 2 × 5 mL of chloroform. The combined organic phases were evaporated and dried under vacuum. This product was treated with 5 mL of TFA overnight in order to generate the radical. Upon completion of the reaction, TFA was evaporated. The residue was dissolved in 10 mL of chloroform and coevaporated with a small amount of silica-gel. The solid residue was added on top of a column. The title compounds were isolated in 50–65% yield by flash chromatography on silica-gel using chloroform—methanol in 5:1 ratio.
EPR Characterization of aTAM1–5
EPR measurements were performed on X-band EMX EPR spectrometer (Bruker, Germany). Temperature and gas composition during EPR measurements were controlled by a temperature and gas controller (Noxygen, Germany). The spectra of the radicals aTAM1–5 were measured in water—ethanol mixture and/or in aqueous solutions. To evaluate aTAM stability against reduction, EPR spectra of 100 µM aqueous solutions of aTAM3–5, pH 7.0, were monitored in the presence of 10 mM ascorbic acid for 2 h. EPR spectra simulation was performed using P.E.S.T. WINSIM program (NIEHS).
Results
Synthesis of Trityl Radicals Containing Amino Groups
Recently we succeeded in the large-scale synthesis of the “Finland” trityl radical, cTAM0.20 This allowed us to manipulate the functional groups of cTAM0 according to Scheme 2 to synthesize dual function pH and oxygen spin probes, aTAM1—aTAM5. The synthetic route to symmetrical probe, aTAM1, was elaborated first and served as a model for optimization of the general procedure for the synthesis of amino-substituted TAM derivatives from primary alcohols. The alcohol 2a was synthesized with excellent yield, 90%, via reduction of the tert-butyl ester TAM 1a with excess lithium aluminum hydride. Mesylation of the compound 2a followed by SN2 addition of excess of tert-butylamine afforded compound 3a in very good yield, 70%. The tert-butylamino group of compound 3a was cleaved, and radical aTAM1 was synthesized in one pot and with 99% yield by treatment with neat trifluoroacetic acid (TFA). The selective reduction of one of the carboxylic groups in compound 1b was achieved by treatment with a 1 M solution of lithium aluminum hydride in THF. The ethyl ester TAM 1b proved much more reactive in this case than the tert-butyl ester TAM 1a. The title compound 2c was obtained with 45% yield after purification by flash chromatography on silica-gel. During the same step, compound 2b was obtained with 15% yield. Compounds aTAM2,3,4 were produced using the same basic four-step procedure. Mesylation of the appropriate alcohol followed by SN2 addition using the appropriate amine afforded the aTAM precursors 3b, 3c, and 3d. Hydrolysis of the ester groups, by refluxing in a mixture of 2 M aqueous NaOH and 1,4-dioxane, followed by treatment with neat TFA at room temperature, afforded radicals aTAM2,3,4 with very good yield from 45% to 65%. To our surprise, treatment with neat TFA of compounds 3b,c did not cleave the tert-butylamino groups to afford the primary amine radicals, as in the case of compound 3a. Apparently there is an effect associated with the presence of carboxylic groups in the aTAM structure that prohibits this reaction from happening. Nevertheless, the treatment with TFA resulted in generation of the amino-substituted aTAM2,3 which lack one of the protons of the amino group. The complete substitution of the protons of the amino group was achieved in the radical aTAM4. The deuterated analogue of aTAM4, aTAM5, was synthesized in a similar manner using 1 M LiAlD4 in THF. Note that treatment with TFA has proven to be a general method for the formal one-electron reduction of all types of trityl alcohols to TAM radicals that we synthesized.
EPR Spectra of aTAMs with a Different Number of Amino Groups
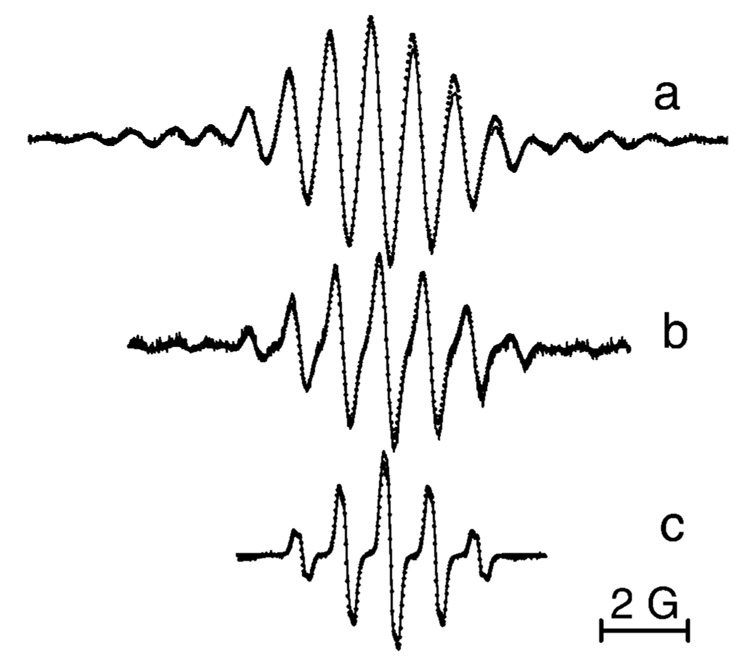
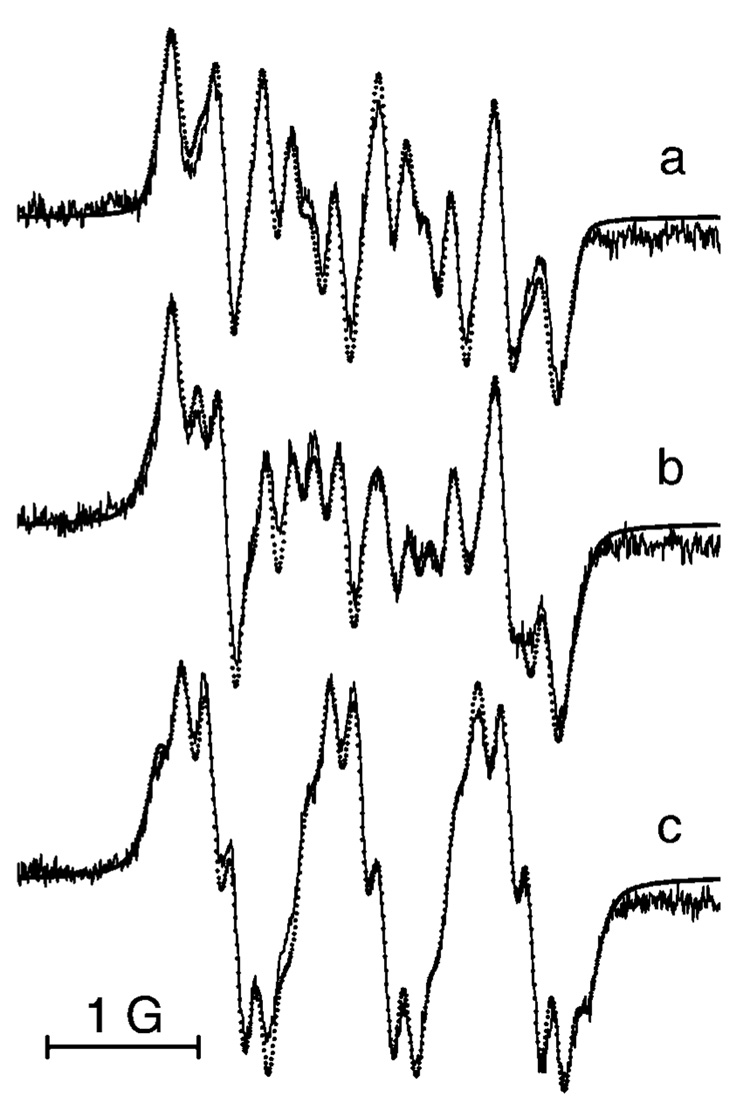
Scheme 2 represents the structures of synthesized TAM derivatives, aTAM1–aTAM5, containing different numbers of amino and carboxyl groups. The symmetrical derivative, aTAM1, has poor aqueous solubility in neutral form at alkaline pH when amino groups are nonprotonated similar to the poor solubility of the neutral form of cTAMn (see Scheme 1). Figure 1 demonstrates the EPR spectra of aTAM1, aTAM2, and aTAM3 with three, two, and one amino groups, respectively, in aqueous solutions at pH 5.0, when amino groups are protonated. The simulation of the EPR spectra allows for excellent agreement with experimental spectra using the values of hyperfine splittings (hfs) for hydrogen and nitrogen nuclei of the CH2NH2 groups shown in the Figure 1 caption. The decrease of amino groups from three to one in aTAM1, aTAM2, and aTAM3 resulted in a significant decrease in the number of spectral lines and about 1 order of magnitude increase in the signal-to-noise ratio (see Figure 1). However, the simplest spectrum (aTAM3 with single CH2NH2 group) is still rather complicated. Note that an apparent quintet structure of the aTAM3 EPR spectrum (1:2:3:2:1) arises from the close values of hfs for nitrogen and methylene hydrogen nuclei, aN ≈ aH(CH2) ≈ 1 G. Each component of the quintet shows additional triplet structure (1:2:1) from two equivalent protons of a NH2 +t-Bu group, aH = 0.13 G. This triplet structure disappears in D2O, supporting the assignment (data not shown). The potential for applications as EPR probes is higher for compounds aTAM3—aTAM5, with a single CH2NH2 group and two COOH groups, because of higher spectral intensity and better aqueous solubility, being charged, or having zwitterionic character in a wide range of pH.
Figure 1.
EPR spectra of aqueous solutions of (a) 300 µM aTAM1, (b) 150 µM aTAM2, and (c) 30 µM aTAM3, pH 5.0, under nitrogen atmosphere and at 37 °C. Spectral parameters were as follows: microwave power, 0.63 mW; time constant, 20.48 ms; conversion time, 160 ms (a, b) and 80.00 ms (c); sweep time, 327.68 s (a, b) and 81.92 s (c); modulation amplitude, 0.1 G; sweep width 20 G (a, b) and 8 G (c); number of points, 2048 (a, b) and 1024 (c). Dotted lines represent the simulated spectra with the values of peak-to-peak line widths, ΔHL = 97 mG and ΔHG = 94 mG, and following hfs constants: (a) aN = 0.96 G, aH1(CH2) = 0.97 G, aH2(CH2) = 1.02 G, aH3–H5(NH3+) = 0.13 G, and a(13C) = 6.79 G; (b) aN = 0.98 G, aH1(CH2) = 0.99 G, aH2(CH2) = 1.04 G, aH3–H4(NH2+t-Bu) = 0.13 G, and (13C) = 7.2 G; (c) aN = 1.02 G, aH1(CH2) = 0.97 G, aH2(CH2) = 1.04 G and aH3–H4(NH2+t-Bu) = 0.13 G.
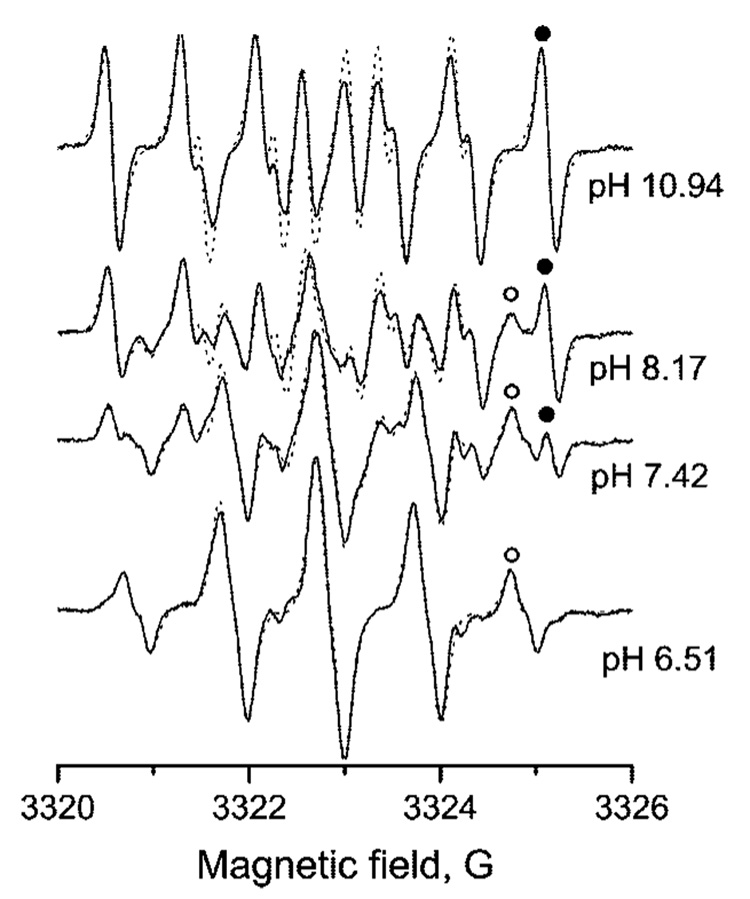
To further simplify EPR spectra of aTAMs, we synthesized aTAM4 with an ethyl-substituted amino group, and its analogue, aTAM5, with the protons of a CH2 group substituted with deuterons. Figure 2 and Figure 3 represent EPR spectra of aTAM4 and aTAM5, respectively, at different pH. The calculated spectra show good agreement with experimental spectra and unambiguously confirm the assignment of the hfs constants. Introduction of ethyl groups eliminated hfs from the protons of the NH2 group except doublet splitting from the attached proton in the protonated form. Within the limits of experimental accuracy the ratios of hfs constants of methylene protons of aTAM4 to hfs constants of deuterons of aTAM5 are equal to the ratio of the proton to deuteron gyromagnetic ratios, 6.5. Isotopic substitution of protons for deuterons in the TAM5 did not result in the desired spectral simplification because of the contribution of partially unresolved hyperfine splittings of deuterons into disturbance and broadening of the spectral components.
Figure 2.
EPR spectra of 50 µM aTAM4 at different pH in 1.5 mM Na-pyrophosphate buffer under nitrogen atmosphere, 37 °C. Spectral parameters: microwave power, 0.63 mW; time constant, 20.48 ms; conversion time, 80.0 ms; sweep time, 81.92 s; frequency, 9.3 GHz; modulation amplitude, 0.1 G; sweep width, 8 G; number of points, 1024. Dotted lines represent the calculated EPR spectra with peak-to-peak line widths, ΔHL = 96 mG, ΔHG = 97 mG, and following hfs constants: aN = 0.78 G, aH1(CH2) = 0.95 and aH2(CH2) = 2.05 G for deprotonated form and aN = 1.01 G, aH1(CH2) = 0.97 G, aH2(CH2) = 1.05 G, and aH(NH+Et2) = 0.15 G for protonated form of the radical. At intermediate pH, EPR spectra were calculated as a superposition of two forms of aTAM4, protonated and deprotonated, having a relative shift of 20 mG of one to the other because of the g-factor difference. The fitting of calculated spectra to experimental spectra yielded the following ratios of deprotonated and protonated forms: 1.558 (pH 8.17), 0.433 (pH 7.42), and 0.057 (pH 6.51) corresponding to pKa = 7.9 ± 0.1. The high field spectral component of protonated and deprotonated components are marked by the symbols (○) and (•), correspondingly.
Figure 3.
EPR spectra of 10 µM aTAM5 radical in 1.5 mM Na-pyrophosphate buffer under nitrogen atmosphere, 37 °C at pH values 9.40 (a), 8.20 (b), and 6.00 (c). Spectral parameters: microwave power, 0.63 mW; time constant, 163.84 ms; conversion time, 240.0 ms; sweep time, 245.76 s; modulation amplitude, 0.1 G; sweep width, 5 G; number of points, 1024. Dotted lines represent the calculated spectra with peak-to peak line widths, ΔHL = 96 mG, ΔHG = 95 mG, and following hfs constants: (a) aN = 0.78 G, aD1(CD2) = 0.15 G, aD2(CD2) = 0.30 G; (c) aN = 0.99 G, aD1(CD2) = 0.15 G, aD2(CD2) = 0.17 G, aH(NH+Et2) = 0.15 G. Calculated spectrum b is a superposition of calculated spectra a (68%) and c (32%) yielding corresponding pKa = 7.9 for the protonation of the amino group.
No synthesized aTAMs changed the integral intensity of their EPR spectra during 2 h of incubation in the presence of 100-fold excess ascorbate (see Experimental Methods) supporting the well-known extremely high stability of TAM radicals in reducing environments.14
EPR Spectral Sensitivity of aTAM4 to pH
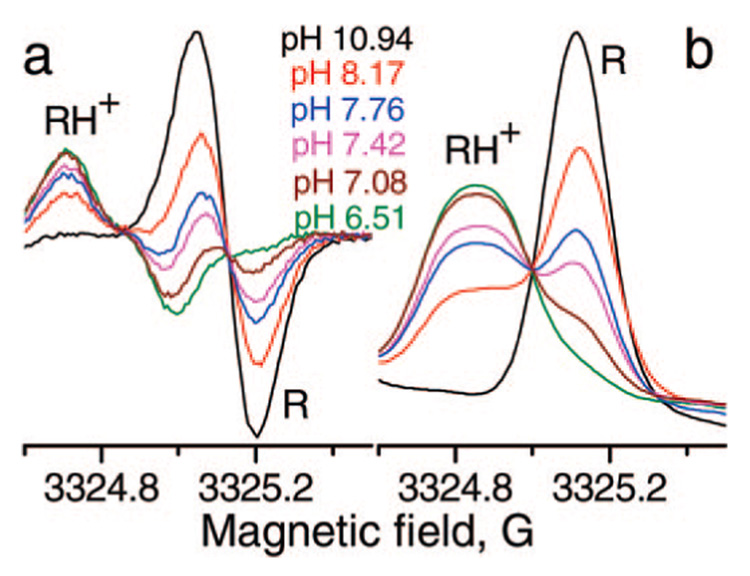
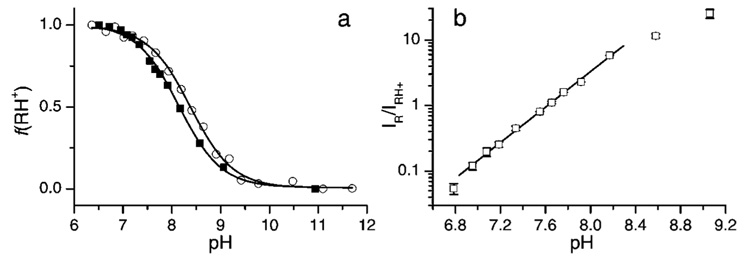
The narrow individual spectral lines of aTAM4 allows for easy analysis of pH-sensitive spectral changes (Figure 2 and Figure 4). The superposition of two forms of the aTAM4 radical at pH around pKa is particularly obvious for the outermost spectral components as shown in Figure 4. The high field fractions of the integrated EPR spectra of aTAM4 measured at various pHs demonstrate isosbestic point characteristics for chemical equilibrium between two forms of the radical. pH dependence of the fraction of the aTAM4-protonated form shown in Figure 5a represents a typical titration curve with pKa = 8.0 ± 0.1 at 37 °C. The ratio of the spectral amplitudes of the high field components (Figure 4a) is a convenient experimental parameter for aqueous acidity measurements using aTAM4 as a pH probe. Normally a spectroscopic pH probe is sufficiently sensitive to acidity changes in pH range of about two pH units centered at the probe pKa, (pKa − 1) <pH < (pKa + 1), when the fraction of each form contributes no less than 10% from the total probe concentration. However, the range of pH sensitivity of aTAM4 is slightly shifted toward lower pH because of the significantly broader line of the protonated radical (see Figure 4a) resulting from additional hfs from the attached proton. The latter makes aTAM4 a convenient probe for pH measurement in physiologically relevant pH range of 6.8 to 8.8 (Figure 5b).
Figure 4.
High-field components of the EPR spectra of 50 µM aTAM4 radical in 1.5 mM pyrophosphate buffer at various pH values, 37 °C (a). Integrated spectra (b) demonstrate isosbestic point characteristics for the chemical equilibrium between protonated and unprotonated aTAM4 radicals (see Scheme 2).
Figure 5.
(a) The pH dependence of fraction of aTAM4 radical protonated form, fRH+, obtained from EPR spectra measured at 23 °C (○) and 37 °C (□) as shown in Figure 2 and Figure 4. Lines represent the best fits of titration equation to the experimental data yielding pKa values 8.4 ± 0.05 (23 °C) and 8.0 ± 0.1 (37 °C). (b) The pH dependence of spectral amplitude ratios of the high-field components of deprotonated (R) and protonated (RH+) forms of aTAM4 radical (see Figure 4a) in logarithmic scale. Lines represent the linear regression, log(IR/IRH+) = apH − b, yielding a = 1.35 ± 0.02 and b = 10.3 ± 0.2.
Spectral Sensitivity of aTAM4 to Oxygen
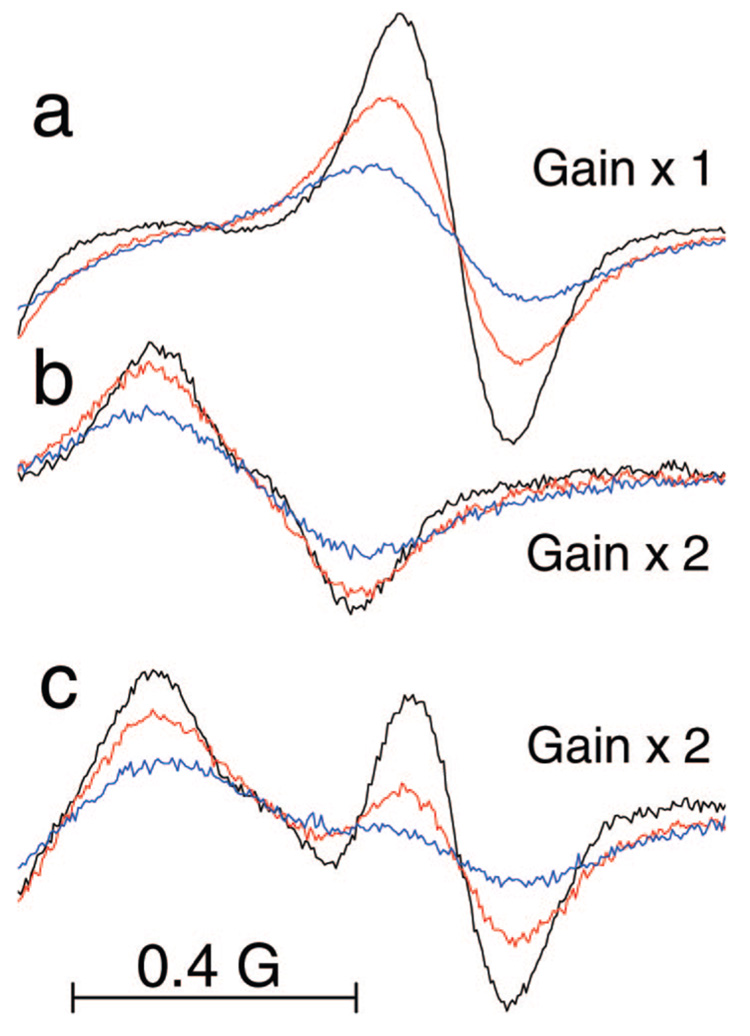
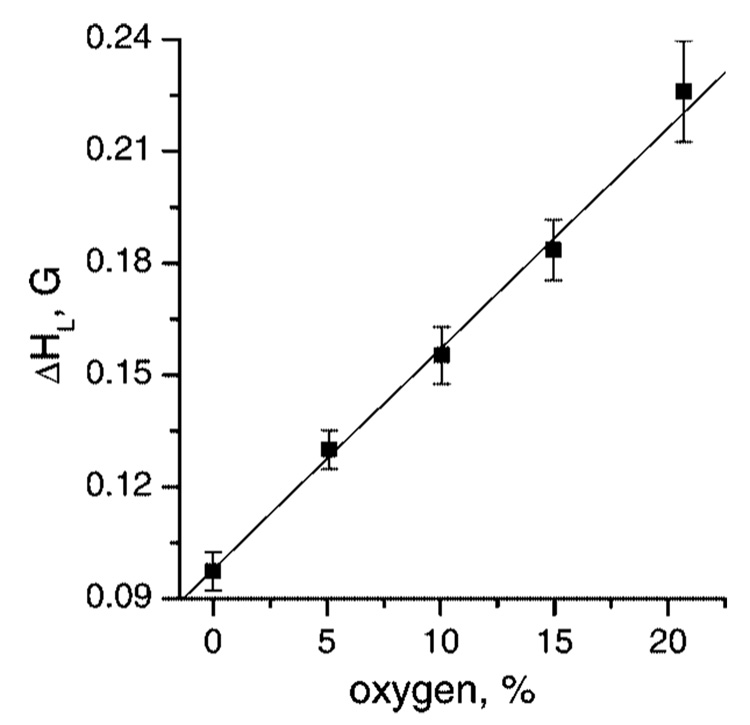
Heisenberg spin exchange between aTAM radicals and molecular oxygen, which is a stable diradical, results in EPR line exchange broadening, which is proportional to oxygen concentration.14,21 Figure 6 demonstrates the high-field components of the EPR spectra of aTAM4 measured at different pH and oxygen concentrations. In the absence of oxygen the high-field component of nonprotonated aTAM4 measured at pH 9.9 and shown in Figure 6a, has narrow peak-to-peak line width, ΔHpp = 160 mG, with comparable contribution of Gauss (ΔHG = 100 mG) and Lorentz (ΔHL = 96 mG) profiles.22 The protonated form measured at pH 5.8 and shown in Figure 6b, has larger peak-to-peak line width of the high-field component, ΔHpp = 280 mG, due to partially unresolved splitting at attached proton, aH(NH+Et2) = 0.15 G, but otherwise similar contribution of Lorentz and Gauss profiles. An increase in oxygen concentration resulted in linear increase of the Lorentz line width, ΔHL, shown in Figure 7, with the slope of (6 ± 0.5) mG per % oxygen while contribution of Gauss remains unchanged. At intermediate pH in the range of 6.8 to 8.8 both protonated, RH+, and nonprotonated, R, forms of aTAMs contribute to the EPR spectra as shown in Figure 6c for aTAM4 at pH 7.8. Increase in oxygen concentration results in line broadening while the ratio of integral intensities of RH+ and R forms does not change. Fitting calculated spectra to the experimental spectra yields the parameters, ΔHL and fraction of protonated form, fRH+ (see Figure 6c). Knowledge of the ΔHL and fRH+ calibration to oxygen concentration (Figure 7) and pH (Figure 5a), respectively, provide the method for extracting both [O2] and pH from the EPR spectra of aTAM4.
Figure 6.
High-field components of the EPR spectra of aTAM4 measured in 1.5 mM pyrophosphate buffer, pH 9.9 (a), pH 5.8 (b), and pH 7.8 (c), at various oxygen partial pressures: 0% (black), 10% (red), 20.7% (blue). Spectral parameters: microwave power, 0.63 mW; time constant, 40.96 ms; conversion time, 160 ms; sweep time, 327.68 s; modulation amplitude, 0.1 G; sweep width, 8 G; number of points, 2048. Experimentally measured peak-to-peak line widths are ΔHpp = 160 mG (a) and ΔHpp = 280 mG (b). Fitting the calculated spectra to the experimental spectra a and b at 0% oxygen using hfs given in the caption to Figure 2 and describing individual line shape by convolution of Lorentz and Gauss profiles22 yields the following peak-to-peak line widths: (a) ΔHL = 96 mG, ΔHG = 100 mG, and (b) ΔHL = 97 mG, ΔHG = 94 mG. Note that the values of the obtained parameters for the nonprotonated radical (a) are in agreement with the previously reported equation for convolution of Lorentz and Gauss profiles ().22 This is not valid for the protonated form of the radical (b) due to the fact that ΔHpp represents peak-to-peak line width of partially unresolved doublet aroused from additional proton hfs, aH(NH+Et2) = 0.15 G (Figure 2). Fitting the calculated spectra of R and RH+ forms to the experimental spectra a and b, respectively, measured at various concentration of oxygen yield the values of ΔHL shown in Figure 7. Fitting the calculated spectra to the experimental spectra c measured at intermediate pH and various concentrations of oxygen yields the values of peak-to-peak line width, ΔHL, and fraction of protonated form, fRH+, allowing simultaneous [O2] and pH determination using corresponding calibration curves (Figure 7 and Figure 5a, respectively), namely: (black) ΔHL = 105 mG (1.3%), fRH+ = 0.58 (pH 7.85); (red) ΔHL = 166 mG (11.3%), fRH+ = 0.57 (pH 7.88); (blue) ΔHL = 227 mG (21.5%), fRH+ = 0.62 (pH 7.8). The latter examples demonstrate an accuracy in pH (±0.1) and oxygen (±2%) determination using aTAM4 probe in the range of pH around its pKa.
Figure 7.
The dependence of Lorentz peak-to peak line width, ΔHL, on oxygen concentration obtained by fitting the calculated spectra of aTAM4 to the experimental spectra measured at pH 9.9 and pH 5.8 as shown in Figure 6. Within the limits of experimental accuracy the values of ΔHL of individual lines of R (pH 9.9) and RH+ (pH 5.8) forms were not distinguished. Slope is (6.0 ± 0.5) mG per % oxygen.
Discussion
Synthesis of stable organic radicals,23,24 NRs, with unpaired electrons localized at a sterically protected NO fragment (), revolutionized the numerous applications of EPR. Half a century of continuous progress in NR synthesis has resulted in the design of specific probes and labels for spin labeling,25 site-directed spin labeling,26 EPR oximetry,9,27 pH,12 thiols,28,29 and NO measurements,30–32 including in vivo functional EPR/EPRI applications.11,33–35 However, the biological and biomedical applications of the NRs are limited due to their bioreduction in EPR-silent diamagnetic products. TAMs represent a totally different basic structure of stable organic radicals with approximately 60% of the unpaired electrons localized at a sterically protected central carbon atom and 40% of spin density delocalized at three attached aryl groups.36 Interestingly, the first stable triphenylmethyl radical was synthesized more than century ago.37 Nevertheless, only recently the compounds with sterically protected trivalent carbon regained the attention as a basic structural fragment for the synthesis of stable organic radicals.13 Beyond the patented materials13 the chemistry of TAMs as spin probes is in an early stage of development19,20,38 compared with the well-developed synthetic chemistry of NRs.39 As a consequence, up to the present time TAMs have a narrow area of application, almost exclusively as oxygen-sensitive probes. Recently we described a concept of dual function pH and oxygen probes based on the TAM radicals containing ionizable groups.18 Carboxyl group-containing derivatives, Oxo63 and cTAMs (see Scheme 1), demonstrated pH-sensitive EPR spectra in acidic aqueous solution (pKa(COOH) ≈ 2.6 for Oxo63). The low pKa value of the TAM derivatives with carboxyl groups does not allow them to be applied in the physiologically relevant pH range, around pH 7.0. Other ionizable groups, protonatable or deprotonatable, must be considered for obtaining TAM derivatives with higher pKa values. Table 1 summarizes pKa values of aliphatic (Et-X) and aromatic (Ph-X) compounds containing the simplest ionizable groups and measured or estimated pKa values of the corresponding TAM radicals (Scheme 3).
Table 1.
pKa Values of the Various Functional Groups, X, Attached to Ethyl, pKa(EtX), Phenyl, pKa(PhX), and TAM, pKa(TAM-X), Measured at Room Temperature
| groups | C(O)OH | CH2NH2 | CH2SH | NH2 | SH | OH | OP(O)(OH)2 |
|---|---|---|---|---|---|---|---|
| pKa (EtX) | 4.88 | 10.58 | 10.61 | 10.64 | 12.0 | 15.9 | 1.6; 6.62 |
| pKa (PhX) | 4.17 | 9.37 | 9.43 | 4.58 | 6.5 | 9.94 | 1; 5.88 |
| pKa(TAM-X) | 2.618 | 8.4a | ≈8b | ≤3b | ≤5b | ≤8b | ≤5b |
This work.
Estimated values.
Scheme 3.
The Two Basic Structures of TAM-X Radicals with an Ionizable Group, Xa
a For X = COOH they represent less hydrophilic “Finland” TAM (left) and more hydrophilic Oxo63 (right).
Similar differences between values of pKa(EtX) and pKa(PhX) for C(O)OH, CH2NH2, and CH2SH groups, being equal to 0.7, 1.18, and 1.21, correspondingly, are in agreement with the same distance between the protonatable atom and the site of attachment of all the groups. Therefore, we may predict a similar further decrease of their pKa values when these groups are introduced in the para-position of the phenyl ring of the TAM radical. This is supported by similar differences between values of pKa(PhX) and pKa(TAM-X) for X = COOH and X = CH2NH2 groups, being equal to 1.5618 and 1.0 (this work). Estimated pKa(TAM-CH2SH) ≈ 8 is close to physiological range. Note that significantly lower pKa values of the radicals compared with their diamagnetic analogs have been previously described for pH-sensitive nitroxides and are explained by the electron-accepting character of the radical center.40 The pKa values of ionizable groups directly attached to the Et, Ph, or TAM depend even more significantly on the nature of attached compound. The pKa values of NH2, SH, and OH functions are decreased by 6.06, 3.5, and 5.96 units when transferred from aliphatic structure, EtX, to aromatic, PhX (see Table 1). The expected further decrease of pKa values of these groups in the TAM structure allows for the prediction of lowering the pKa(TAM-OH) below 8.0 with probable proximity to physiological range. Similar consideration allows for exclusion of the TAM-X(X = NH2, SH, OP(O)(OH)2) from the candidates for physiologically relevant pH probes.
In this paper we reported the synthesis and characterization of amino group-containing TAM-CH2NH2 derivatives or aTAMs, which represent the first practically useful dual function pH and oxygen paramagnetic probes for biological studies. In particular, the aTAM4 probe demonstrates spectral sensitivity to pH in the range of 6.8 to 8.8 at 37 °C (Figure 4 and Figure 5) while retaining high sensitivity to oxygen (Figure 6 and Figure 7). At intermediate pH close to pKa the EPR spectra of aTAM4 is described by superposition of its protonated and nonprotonated forms which is characteristic for slow frequency exchange at EPR time scale. This is in agreement with previously obtained numerical requirements, 3 < pKa < 11,40 for slow frequency exchange between spectral lines positioned at about 1 G distance from each other and representing EPR resonances from RH+ and R forms in aqueous solution (for diffusion-controlled protonation). pH variation affects the ratio of spectral intensities of RH+ and R forms (Figure 4). Therefore, an extraction of pH values from the EPR spectra of aTAM4 is based on a ratiometric approach and is independent of probe concentration. Changes in oxygen concentration do not influence [RH+]/[R] ratio but result in line broadening (Figure 6), linearly dependent on oxygen concentration (6 mG/ per % [O2], Figure 7). The independent character of pH and [O2] effects on the EPR spectra of aTAM4 provides dual functionality to this probe, allowing an extraction of both parameters from a single spectrum (see Figure 6c). Note that both symmetrical and asymmetrical aTAM derivatives demonstrated excellent stability in aqueous solutions in the presence of 100-fold excess of reducing agent, ascorbate.
TAM radicals, such as Oxo63, were found to be useful probes for EPR oximetry because of both the high sensitivity to oxygen-induced line broadening (≈5.3 mG per % [O2]14) and the presence of single spectral line. Appearance of the spectral pattern for dual function probes, e.g., for aTAM4, decreases their value for oxygen measurements, particularly for oxygen mapping. To simplify the spectral pattern of aTAMs, we synthesized asymmetrical structures with a single CH2NH2 group in aTAM3–5 derivatives which resulted in about 1 order of magnitude increase in SNR (see Figure 1). Some further spectral simplification was achieved by substitution of protons of the amino group by ethyl groups in derivative aTAM4 (Figure 2). Isotopic substitution of methylene protons for deuterons in aTAM5 did not result in spectral improvement because of still-detectable values of hfs constants of deuterons (Figure 3). Among the synthesized compounds, aTAM4 has the simplest EPR spectral properties, allowing for its application as a dual function probe.
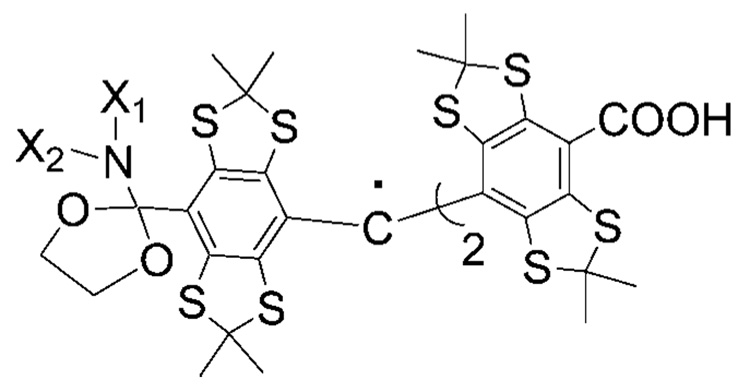
Further simplification of spectral properties of dual function TAM probes is desired. One of the approaches is based on modification of already proven useful aTAMs, e.g., introducing the acetal moiety in place of the methylene group in aTAM4 (Scheme 4). This will eliminate hfs from two nonequivalent methylene protons resulting in a triplet spectral pattern for the nonprotonated form. Isotopic substitution of nitrogen 14N for 15N further decreases the number of lines from triplet to doublet. Another approach is to introduce other ionizable groups in the TAM structure, e.g., CH2SH or OH functions (see Table 1). The derivative with the CH2SH function may have similar pKa values but less EPR spectral lines because of the absence of the amino nitrogen. The TAM-OH derivative might be of particular interest because of an expected single line in deprotonated form and appearance of doublet splitting after protonation of the OH group (in the case of asymmetric TAM-OH with two carboxylic groups).
Scheme 4.
Hypothetical Structure of aTAM with an Acetal Moietya
a The corresponding amide should be readily available from starting compound 1a (Scheme 2) and can be used as precursor of the acetal derivative.
Limited aqueous solubility of “Finland” cTAM makes difficult its in vivo use. Recently we reported that cTAM has an aggregation tendency at pH values below 4.0 initiated by protonation of carboxyl group.20 Apparently, an increase of carboxyl group pKa in compartments with low dielectric constants,18 e.g. biomembranes, will aggravate aggregation problems of cTAM and related toxicity. Introduction of both amino and carboxyl groups in asymmetrical derivatives, aTAM2–5, makes them more soluble in a broader range of pH because of their ionic or zwitterionic character. However, the development of TAM derivatives based on more hydrophilic structures, such as Oxo63 (see Scheme 3), may be important for elaboration of nontoxic dual function probes.
In summary, the synthesized TAM derivatives represent first practically valuable structures of dual function pH and oxygen paramagnetic probes for biomedical research.
Acknowledgment
This work was partly supported by NIH grants KO1 EB03519, R21 CA132068, R21 HL091423-01, RO1 EB00890, and RO1 EB 004900.
Footnotes
Supporting Information Available:
Full experimental details for the synthesis of the radicals aTAM1–5 and their precursors, spectral data and typical NMR, EPR, and MS spectra; details of sample preparation and EPR spectra analysis. The material is available free of charge via the Internet at http://pubs.acs.org.
References
- 1.Gillies RJ, Alger JR, den Hollander JA, Shulman RG. In: Intracellular pH: Its measurement, regulation and utilization in cellular functions. Nuccitelli R, Deamer DW, editors. New York: Alan R. Liss; 1982. pp. 79–104. [Google Scholar]
- 2.Gillies RJ, Raghunand N, Garcia-Martin ML, Gatenby RA. IEEE Eng. Med. Biol. Mag. 2004;23:57–64. doi: 10.1109/memb.2004.1360409. [DOI] [PubMed] [Google Scholar]
- 3.Pietri S, Martel S, Culcasi M, Delmas-Beauvieux MC, Canioni P, Gallis JL. J. Biol. Chem. 2001;276:1750–1758. doi: 10.1074/jbc.M008023200. [DOI] [PubMed] [Google Scholar]
- 4.Clark LC, Jr, Ackerman JL, Thomas SR, Millard RW, Hoffman RE, Pratt RG, Ragle-Cole H, Kinsey RA, Janakiraman R. AdV. Exp. Med. Biol. 1984;180:835–845. doi: 10.1007/978-1-4684-4895-5_81. [DOI] [PubMed] [Google Scholar]
- 5.Mason RP, Rodbumrung W, Antich PP. NMR Biomed. 1996;9:125–134. doi: 10.1002/(SICI)1099-1492(199605)9:3<125::AID-NBM405>3.0.CO;2-F. [DOI] [PubMed] [Google Scholar]
- 6.Aboagye EO, Kelson AB, Tracy M, Workman P. Anti-Cancer Drug Des. 1998;13:703–730. [PubMed] [Google Scholar]
- 7.Backer JM, Budker VG, Eremenko SI, Molin YN. Biochim. Biophys. Acta. 1977;460:152–156. doi: 10.1016/0005-2728(77)90161-x. [DOI] [PubMed] [Google Scholar]
- 8.Glockner JF, Norby SW, Swartz HM. Magn. Reson. Med. 1993;29:12–18. doi: 10.1002/mrm.1910290105. [DOI] [PubMed] [Google Scholar]
- 9.Halpern HJ, Yu C, Peric M, Barth E, Grdina DJ, Teicher BA. Proc. Natl. Acad. Sci. U.S.A. 1994;91:13047–13051. doi: 10.1073/pnas.91.26.13047. [DOI] [PMC free article] [PubMed] [Google Scholar]
- 10.Khramtsov VV, Grigor’ev IA, Foster MA, Lurie DJ, Nicholson I. Cell Mol. Biol. 2000;46:1361–1374. [PubMed] [Google Scholar]
- 11.Potapenko DI, Foster MA, Lurie DJ, Kirilyuk IA, Hutchison JM, Grigor’ev IA, Bagryanskaya EG, Khramtsov VV. J. Magn. Reson. 2006;182:1–11. doi: 10.1016/j.jmr.2006.06.002. [DOI] [PubMed] [Google Scholar]
- 12.Khramtsov VV. Curr. Org. Chem. 2005;9:909–923. [Google Scholar]
- 13.Anderson S, Golman K, Rise F, Wikström H, Wistrand L-G. 530,140. US Patent. 1996
- 14.Ardenkjaer-Larsen JH, Laursen I, Leunbach I, Ehnholm G, Wistrand LG, Petersson JS, Golman K. J. Magn. Reson. 1998;133:1–12. doi: 10.1006/jmre.1998.1438. [DOI] [PubMed] [Google Scholar]
- 15.Krishna MC, English S, Yamada K, Yoo J, Murugesan R, Devasahayam N, Cook JA, Golman K, Ardenkjaer-Larsen JH, Subramanian S, Mitchell JB. Proc. Natl. Acad. Sci. U.S.A. 2002;99(4):2216–2221. doi: 10.1073/pnas.042671399. [DOI] [PMC free article] [PubMed] [Google Scholar]
- 16.Kutala VK, Parinandi NL, Zweier JL, Kuppusamy P. Arch. Biochem. Biophys. 2004;424:81–88. doi: 10.1016/j.abb.2004.01.020. [DOI] [PubMed] [Google Scholar]
- 17.Kutala VK, Villamena FA, Ilangovan G, Maspoch D, Roques N, Veciana J, Rovira C, Kuppusamy P. J. Phys. Chem.B. 2008;112:158–167. doi: 10.1021/jp076656x. [DOI] [PubMed] [Google Scholar]
- 18.Bobko AA, Dhimitruka I, Zweier JL, Khramtsov VV. J. Am. Chem. Soc. 2007;129:7240–7241. doi: 10.1021/ja071515u. [DOI] [PubMed] [Google Scholar]
- 19.Reddy TJ, Iwama T, Halpern HJ, Rawal VH. J. Org. Chem. 2002;67:4635–4639. doi: 10.1021/jo011068f. [DOI] [PubMed] [Google Scholar]
- 20.Dhimitruka I, Velayutham M, Bobko AA, Khramtsov VV, Villamena FA, Hadad CM, Zweier JL. Bioorg. Med. Chem. Lett. 2007;17:6801–6805. doi: 10.1016/j.bmcl.2007.10.030. [DOI] [PMC free article] [PubMed] [Google Scholar]
- 21.Matsumoto K, English S, Yoo J, Yamada K, Devasahayam N, Cook JA, Mitchell JB, Subramanian S, Krishna MC. Magn. Reson. Med. 2004;52:885–892. doi: 10.1002/mrm.20222. [DOI] [PubMed] [Google Scholar]
- 22.Dobryakov SN, Lebedev YS. Sov. Phys. Dokl. 1969;13:873–875. [Google Scholar]
- 23.Lebedev OA, Kayanovskii SN. Tr. Khim. Khim. Technol. 1959;8:649–652. [Google Scholar]
- 24.Neiman MB, Rozantzev EG, Mamedova YG. Nature. 1962;196:472–474. [Google Scholar]
- 25.Berliner LJ, editor. Spin Labeling. The Next Millennium. New York: Plenum Press; 1998. p. 423. [Google Scholar]
- 26.Hubbell WL, Cafiso DS, Altenbach C. Nat. Struct. Biol. 2000;7:735–739. doi: 10.1038/78956. [DOI] [PubMed] [Google Scholar]
- 27.Swartz HM. Antioxid. Redox Signaling. 2004;6:677–686. doi: 10.1089/152308604773934440. [DOI] [PubMed] [Google Scholar]
- 28.Khramtsov VV, Yelinova VI, Weiner LM, Berezina TA, Martin VV, Volodarsky LB. Anal. Biochem. 1989;182:58–63. doi: 10.1016/0003-2697(89)90718-5. [DOI] [PubMed] [Google Scholar]
- 29.Swartz HM, Khan N, Khramtsov VV. Antioxid. Redox Signaling. 2007;9:1757–1771. doi: 10.1089/ars.2007.1718. [DOI] [PMC free article] [PubMed] [Google Scholar]
- 30.Akaike T, Yoshida M, Miyamoto Y, Sato K, Kohno M, Sasamoto K, Miyazaki K, Ueda S, Maeda H. Biochemistry. 1993;32:827–832. doi: 10.1021/bi00054a013. [DOI] [PubMed] [Google Scholar]
- 31.Joseph J, Kalyanaraman B, Hyde JS. Biochem. Biophys. Res. Commun. 1993;192:926–934. doi: 10.1006/bbrc.1993.1504. [DOI] [PubMed] [Google Scholar]
- 32.Woldman Y, Khramtsov VV, Grigor’ev IA, Kiriljuk IA, Utepbergenov DI. Biochem. Biophys. Res. Commun. 1994;202:195–203. doi: 10.1006/bbrc.1994.1912. [DOI] [PubMed] [Google Scholar]
- 33.He G, Samouilov A, Kuppusamy P, Zweier JL. Mol. Cell Biochem. 2002;234–235:359–367. [PubMed] [Google Scholar]
- 34.Kuppusamy P, Li H, Ilangovan G, Cardounel AJ, Zweier JL, Yamada K, Krishna MC, Mitchell JB. Cancer Res. 2002;62:307–312. [PubMed] [Google Scholar]
- 35.Roshchupkina GI, Bobko AA, Bratasz A, Reznikov VA, Kuppusamy P, Khramtsov VV. Free Radical Biol. Med. 2008;45:312–320. doi: 10.1016/j.freeradbiomed.2008.04.019. [DOI] [PMC free article] [PubMed] [Google Scholar]
- 36.Xia S, Villamena FA, Hadad CM, Kuppusamy P, Li Y, Zhu H, Zweier JL. J. Org. Chem. 2006;71:7268–7279. doi: 10.1021/jo0610560. [DOI] [PMC free article] [PubMed] [Google Scholar]
- 37.Gomberg M. J. Am. Chem. Soc. 1900;22:757–771. [Google Scholar]
- 38.Liu Y, Villamena FA, Sun J, Xu Y, Dhimitruka I, Zweier JL. J. Org. Chem. 2008;73:1490–1497. doi: 10.1021/jo7022747. [DOI] [PubMed] [Google Scholar]
- 39.Volodarsky LB, Reznikov VA, Ovcharenko VI. Synthetic chemistry of stable nitroxides. Boca Raton, FL: CRC Press; 1994. p. 225. [Google Scholar]
- 40.Khramtsov VV, Volodarsky LB. In: Spin labeling. The Next Millennium. Berliner LJ, editor. Vol. 14. New York: Plenum Press; 1998. pp. 109–180. [Google Scholar]


