

Abstract
It is generally believed that unfolded or denatured proteins show random coil statistics and hence their radius of gyration simply scales with solvent quality (or denaturant concentration). Indeed, nearly all proteins studied thus far have been shown to undergo a gradual and continuous expansion with increasing denaturant concentration. Here, we use fluorescence correlation spectroscopy (FCS) to show that while protein A, a multidomain and predominantly helical protein, expands gradually and continuously with increasing concentration of guanidine hydrochloride (GdnHCl), the F(ab′)2 fragment of goat anti-rabbit antibody IgG, a multi-subunit all β-sheet protein, however, does not show such continuous expansion behavior. Instead, it first expands and then contracts with increasing GdnHCl concentration. Even more striking is the fact that the hydrodynamic radius of the most expanded F(ab′)2 ensemble, observed at 3-4 M GdnHCl, is ca. 3.6 times that of the native protein. Further FCS measurements involving urea and NaCl show that the unusually expanded F(ab′)2 conformations might be due to electrostatic repulsions. Taken together, these results suggest that specific interactions need to be considered while assessing the conformational and statistical properties of unfolded proteins, particularly under conditions of low solvent quality.
Keywords: FCS, Flory’s random coil model, IgG, protein folding, unfolded state
Despite its obvious importance in understanding how proteins fold, the unfolded or denatured state of proteins remains relatively unexplored.1,2 Recent years have thus seen an increasing number of studies focused on the conformational properties of proteins in their unfolded state.3-24 Of particular interest are those which assess the molecular dimensions as well as conformational dynamics of proteins under various denaturing conditions using ensemble11-20 or single-molecule techniques.25-32 All these studies, while involving a wide variety of peptides and proteins that span a large range of chain lengths (8-549 aa), generally support the notion that unfolded proteins behave as self-avoiding random-coils which undergo a continuous expansion with increasing denaturant concentration, following Flory’s power-law relationship (i.e., RG = R0Nν; where RG is the radius of gyration, R0 is a constant determined by the persistence length of the polymer, N is the number of residues, and ν is a scaling exponent that depends on the quality of the solvent).11-18 In addition, several single-molecule fluorescence resonance energy transfer studies26,29,32 have shown that conformational transitions within an unfolded protein ensemble could occur on a range of timescales, signifying the underlying hierarchical nature of the unfolded potential well. While these previous studies provided valuable insights into the statistical properties of unfolded polypeptide chains, they mainly focused on relatively small and mostly single-domain proteins.12,14 To verify whether the denatured states of large multi-domain proteins also exhibit similar behaviors upon chemical denaturation, here we investigate the GdnHCl induced unfolding of the F(ab′)2 fragment of goat anti-rabbit immunoglobulin G (IgG) and also an IgG binding protein, protein A, using fluorescence correlation spectroscopy (FCS). FCS is based on correlating fluctuations in emission intensity arising from fluorescent molecules diffusing in and out of a small confocal volume, thus providing a convenient means to measure the diffusion time and hence the molecular size of the diffusing species.33,34 The F(ab′)2 fragment (100 kDa), obtained by proteolytic cleavage of the intact goat anti-rabbit IgG, is composed of two identical Fab subunits (or arms), each consisting of four β-sheet domains.35,36 Two disulfide bridges bring the two Fab arms together to form a unique Y-shaped structure (Figure 1a). Because of its distinctive structural characteristics and the prevalence of antibodies, the folding of F(ab′)2 as well as its constituent domains has been the subject of many studies.35-42 Protein A (55.5 kDa), on the other hand, is a component of the cell wall of Staphylococcal aureus and is known to bind to the FC fragment of IgG.43 While it also consists of multiple domains, protein A differs from F(ab′)2 mostly in that it lacks disulfides and is predominantly helical.
Figure 1.
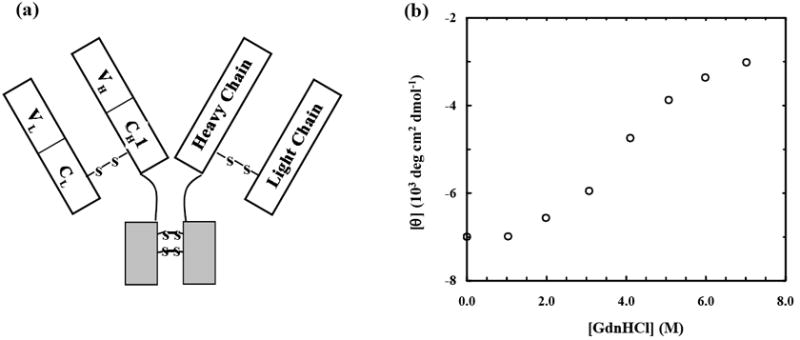
(a) Schematic representation of the F(ab′)2 fragment of goat IgG, showing the Y-shaped spatial disposition of the light (L) chain and part of the heavy (H) chain, linked together via a disulfide bridge. Each chain, as shown, is composed of a constant (CH1 & CL) and a variable (VH&L) domain, with each domain having about 110 amino acids. (b) Mean residue ellipticity of Alexa-F(ab′)2 (0.8 μM) at 218 nm as a function of GdnHCl concentration (in pH 7 PBS buffer containing 100 mM NaCl). The CD data were collected on an AVIV 62DS spectrometer (Lakewood, NJ) using a 1mm quartz cell at 25 °C.
The Alexa 555 labeled IgG F(ab′)2 protein (henceforth referred to as Alexa-F(ab′)2) studied here was purchased from Molecular Probes (Carlsbad, CA) and used without further purification. Far-UV circular dichroism (CD) spectrum of the dye-labeled F(ab′)2 is identical to that of unlabeled F(ab′)2 (data not shown), indicating that labeling does not change the integrity of the protein. Further CD studies indicate that high concentrations of GdnHCl induce Alexa-F(ab′)2 to unfold (Figure 1b). Consistent with this picture, representative FCS measurements44 show that the diffusion time of the protein molecules is distinctly lengthened in the presence of GdnHCl (Figure 2a), a phenomenon characteristic of molecular expansion upon unfolding. More importantly, these FCS data show that the diffusion time of Alexa-F(ab′)2 exhibits a distinct non-monotonic dependence on the concentration of GdnHCl, a feature that has rarely been observed for other proteins. Moreover, repeated measurements reveal that the individual autocorrelation traces obtained under a given denaturant concentration can significantly deviate from each other, indicative of a protein ensemble of varying molecular dimensions.
Figure 2.
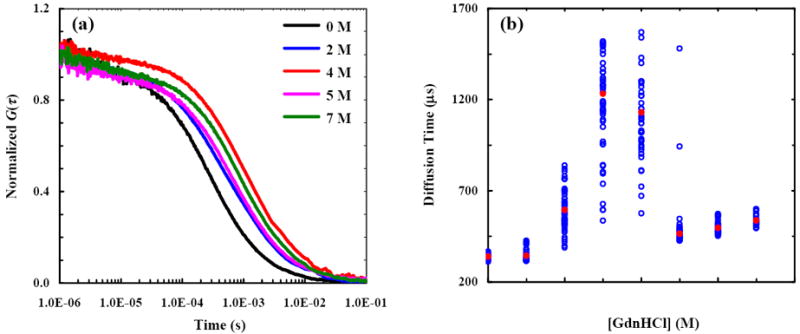
(a) Representative autocorrelation traces of Alexa-F(ab′)2 measured at different GdnHCl concentrations, as indicated. Fitting these FCS data to eq. 1 yields the following diffusion times: τD = 337 μs for 0 M GdnHCl, τD = 595 μs for 2 M GdnHCl, τD1 = 544 μs and τD2 = 1300 μs for 4 M GdnHCl, τD = 462 μs for 5 M GdnHCl, and τD = 527 μs for 7 M GdnHCl. These results show that the characteristic diffusion time of F(ab′)2 is nonlinearly dependent on [GdnHCl]. (b) The corrected44 diffusion times (blue open circles) of Alexa-F(ab′)2 obtained at different GdnHCl concentrations. Also shown (red circles) are the respective averages.
In order to provide a more quantitative picture regarding how the molecular diffusion of the IgG F(ab′)2 fragment changes as a function of [GdnHCl], a minimum of 30 autocorrelation traces were collected under each denaturation condition and subsequently analyzed according to the following equation,34
| (1) |
where represents the characteristic diffusion time of species i, ω refers to the axial to lateral dimension ratio of the confocal volume element, N represents the number of fluorescent molecules in the confocal volume, τtriplet is the triplet lifetime of the fluorophore and T represents the corresponding triplet amplitude. For Alexa-F(ab′)2 in 100 mM PBS buffer at pH 7, all the autocorrelation traces can be well described by eq. 1 with n = 1 and a τD of 340 ± 30 μs. Similarly, for [GdnHCl] = 1, 2, 5, 6 and 7 M, the respective autocorrelation traces can also be adequately modeled by eq. 1 with n = 1. However, in order to fit those autocorrelation traces obtained in 3 or 4 M GdnHCl solution, two diffusion components (i.e., n = 2 in eq. 1) have to be invoked. In this regard, it is worth pointing out that FCS is commonly considered a single-molecule technique based on the fact that most of the recorded fluorescence bursts primarily arise from individual molecules traversing the confocal volume element. However, a typical FCS measurement involves the collection of an appreciable number of such bursts arising from many probe molecules diffusing in and out of the excitation volume. Hence, the resultant autocorrelation trace is in fact a weighted average of the diffusion profiles of all the individual molecules contributing to the aforementioned fluctuations in fluorescence.25 While in principle one should be able to extract the characteristic diffusion time of each and every molecule contributing to the autocorrelation trace, both simulation and experimental studies have shown that in order to differentiate between two species using this technique, their diffusion times have to differ by at least a factor of 1.6.47 In other words, for a group of molecules whose diffusion times are not significantly different, a FCS measurement would result in an autocorrelation trace that can be well described by eq. 1 with n =1 and yield a τD corresponding to the weighted average of the diffusion times of all the contributing molecules. On the other hand, for a group of molecules that exhibit marked difference in their diffusion times, two or more diffusion components will be required to reliably fit the experimentally measured autocorrelation traces, depending on the number of diffusion events (or the total observation time) as well as the separations in their respective diffusion timescales.25
For the reasons discussed above, it is thus clear that a single FCS experiment might fail to reveal the diffusion heterogeneity intrinsic to an unfolded protein ensemble. However, such heterogeneity may be unmasked through a series of repeated FCS measurements, as demonstrated in the current case (see below), provided that the underlying reconfiguration times among different conformations are slower than their respective transit times through the confocal volume. This is because, despite the fact that many molecules contribute to each individual FCS trace, the actual number is nevertheless very small compared to the total number of fluorescent molecules in the sample solution. Thus, a set of individual FCS measurements would yield τD values that statistically fluctuate around a mean value, determined by the intrinsic size distribution of the protein ensemble under investigation.
As shown (Figure 2b), the characteristic diffusion times of Alexa-F(ab′)2 not only show a complex dependence on [GdnHCl] but also vary quite considerably among individual measurements.44 In particular, three key observations merit elaboration. First, at an intermediate GdnHCl concentration (i.e., 2 - 5 M) the diffusion of Alexa-F(ab′)2 is characterized by a range of τD values with a standard deviation much larger than that arising from the uncertainties commonly associated with FCS experiments.48 For example, the data obtained at 2 M GdnHCl yield a mean diffusion time of 600 μs with a deviation of ~200 μs around the mean. The latter is significantly greater than that (i.e., 30 μs) observed for the protein under native conditions. In addition, for [GdnHCl] = 3 or 4 M, the recovered diffusion times spread over an even larger time window. Hence, as discussed above, these results indicate that under such conditions the Alexa-F(ab′)2 molecules sample a large set of conformations that are distinguishable by their respective diffusion characteristics. Furthermore, these results imply that the interconversion rates among different conformations are slow enough such that the hydrodynamic radius of most molecules remains unchanged while traversing the confocal volume,25 thus allowing the recovery of distinctly different diffusion times. Consistent with this picture, it has been shown that Fab unfolds very slowly.36,40,41 In addition, these results are in accord with the fact that each Fab arm contains 23 proline residues, the isomerization of which would definitely slow down the interconversion rates among different denatured conformations. Second, increasing the GdnHCl concentration from 0 to 4 M leads to a significant increase in the average diffusion time of the protein, from 340 μs to ~1.2 ms. This indicates that, on average, the molecular dimension of F(ab′)2 in 4 M GdnHCl solution is significantly larger than that of the native F(ab′)2. Considering the fact that a large number of proteins have now been shown to expand only modestly upon denturation,14,17,18 this result is quite surprising and unexpected. The final and perhaps the most intriguing observation is that a further increase in [GdnHCl] from 4 to 6 or 7 M results in a considerable compaction of the protein molecules, as judged by the significant decrease in the average diffusion times under these conditions.
Taken together, these results indicate that the GdnHCl-induced denaturation of this large, multi-domain, and multi-subunit protein, as monitored by the change in diffusion times (τD) and hence the associated hydrodynamic radii (discussed below) as a function of [GdnHCl], is markedly different from the commonly observed continuous expansion behavior.26,27,30 To further probe into this aspect, and for the purpose of comparison, we have performed similar FCS measurements on protein A, a 508 residue protein composed of five helical domains. Both CD (data not shown) and FCS measurements (Figure 3) corroborate each other in that protein A progressively unfolds with increasing denaturant concentration. However, in marked contrast to what has been observed for F(ab′)2, the molecular dimension of this IgG binding protein shows a continuous and also very modest expansion upon chemical denaturation, as suggested by Flory’s random-coil model.49
Figure 3.
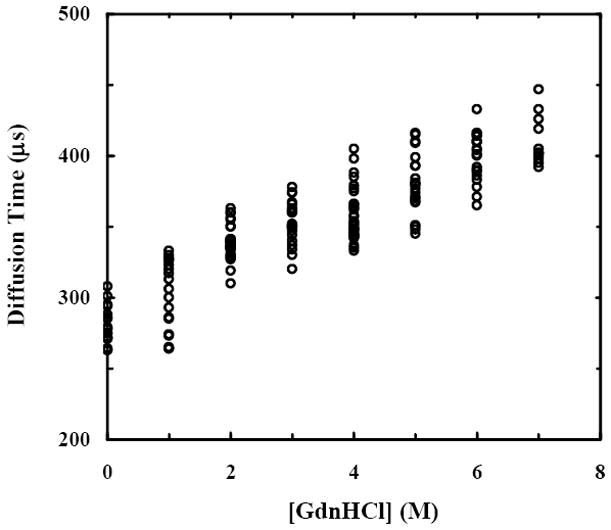
The corrected44 diffusion times of protein A obtained at different GdnHCl concentrations.
The hydrodynamic radius (Rh) of a spherical diffusing species is related to τD through the following equation,24,25
| (2) |
where r0 is the lateral dimension of the confocal volume element (~0.26 μm in the current case), η represents the viscosity of the solution, kB is the Boltzmann’s constant and T is the absolute temperature. Using eq. 2 and the measured τD of 340 ± 30 μs, the hydrodynamic radius of F(ab′)2 in its folded state was calculated to be 44 ± 4 Å. This value is very similar to that (44.8 Å) determined by other techniques for the same fragment of IgG in buffer,50,51 further validating the current method. Similarly, using the average τD value obtained in 7 M GdnHCl solution we have estimated the hydrodynamic radius of the denatured F(ab′)2 to be ca. 70 Å. This result appears to be consistent with the notion that the hydrodynamic radius of the highly denatured ensemble of proteins follows Flory’s scaling law,11-18 Rh = 2.21 N0.57, which predicts a Rh of 113 Å for the highly denatured F(ab′)2 molecules. The apparent difference is likely due to the fact that there are 12 disulfides in F(ab′)2, which can certainly exert conformational constraints.
On the other hand, based on the same premise (presence of disulfide bonds), the observation of the very slow moving species at [GdnHCl] = 3 and 4 M is indeed quite unexpected. For example, the average τD is ca. 1.2 ms under these conditions, which gives rise to a Rh value of ca. 161 Å according to eq. 2, corresponding to ~3.6 times that of the folded conformation. Since protein aggregation can also yield diffusing species with a prolonged diffusion time, special precautions and measures have been taken to prevent formation of such aggregates. Firstly, the cover slips used for the FCS measurements were surface passivated with either BSA (Pierce Chemicals, Rokcford, IL) or PEG-silane (Gelest Inc., Morrisville, PA) to minimize the tendency of adhesion and surface-induced aggregation of the protein molecules under investigation. Secondly, the nanomolar Alexa-F(ab′)2 samples used in the FCS experiments were prepared by directly diluting the stock protein solution (10 μM) from Molecular Probes by the desired denaturant solution so as to minimize aggregate formation under denaturing conditions. In addition, all the fluorescence burst profiles were carefully scrutinized and were found to have very similar brightness, suggesting that they arise from monomeric Alexa-F(ab′)2 molecules as aggregates would appear brighter due to the increased number of fluorophores per diffusing species.52 However, to provide more direct evidence that the protein molecules under current experimental conditions are predominantly monomeric, we have examined the reversibility of the GdnHCl-induced denaturation of Alexa-F(ab′)2. As shown (Figure 4a), the distribution of the diffusion times of Alexa-F(ab′)2 is reversible upon dilution of the denaturant after unfolding (e.g., from 4 M to 1 M). Since protein aggregation is usually irreversible, these results thus strongly suggest that the slow moving species observed at intermediate GdnHCl concentrations do not correspond to aggregates of the labeled F(ab′)2 fragments. In addition, fast protein liquid chromatography (FPLC) measurements53 provide further evidence showing that even at the concentration of 1.5 μM Alexa-F(ab′)2 exists as monomer in 4 M GdnHCl.
Figure 4.
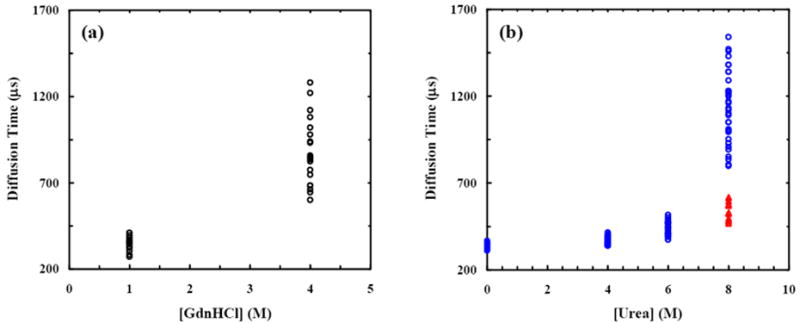
(a) The corrected44 diffusion times of Alexa-F(ab′)2 obtained at 4 and 1 M GdnHCl solutions, respectively. The 1 M GdnHCl sample was prepared by dilution of the 4 M GdnHCl protein sample used to generate the data presented here. These results indicate that the denaturation is reversible under the current experimental conditions. (b) The corrected44 diffusion times of Alexa-F(ab′)2 obtained in urea (blue) and 2 M NaCl urea (red) solutions.
Tentatively, we hypothesize that electrostatic repulsion is the dominant factor leading to the formation of such a highly expanded F(ab′)2 ensemble at intermediate denaturant concentration. To provide experimental evidence supporting this hypothesis, we have further studied the urea-induced denaturation of Alexa-F(ab′)2 using FCS. Urea, another commonly used denaturant in protein unfolding studies, differs from GdnHCl mostly in that the latter is a salt and hence can not only disrupt hydrophobic interactions but also greatly affect electrostatic forces.54 As shown (Figure 4b), in 8 M urea solution the distribution of the diffusion times of Alexa-F(ab′)2 is quite similar to that observed in 4 M GdnHCl solution, showing the presence of an ensemble of highly expanded species. However, addition of 2 M NaCl to the 8 M urea sample leads to a significant reduction in the average diffusion times, indicative of compaction in molecular dimensions. Thus, these results suggest that electrostatic interactions play an important role in defining the final molecular dimensions of the denatured F(ab′)2 molecules. In other words, the complex dependence of the diffusion time (and hence the hydrodynamic radius) of F(ab′)2 as a function of [GdnHCl] results from two opposing effects: i) significant swelling of the protein due to unusual electrostatic repulsions upon unfolding, which dominates at relatively low denaturant concentrations, and ii) electrostatic shielding provided by the GdnHCl salt, which becomes more pronounced at high denaturant concentrations. Hence, with increasing [GdnHCl], F(ab′)2 first expands due to unfolding and then undergoes a transition leading to the formation of a more compact conformational ensemble owing to the increased screening that diminishes the charge repulsions. Consistent with this picture, F(ab′)2 carries a net charge of +20 at neutral pH, which are evenly distributed among the 4 chains. In particular, the VL (VH) domain carries a net charge of +6 (+3). Because the VH and VL domains are in close proximity, these net charges may play an important role in determining the size of the unfolded state of F(ab′)2. Additionally, the disulfides in F(ab′)2 may also play a subtle but important role in generating the more extended conformational ensemble because they eliminate a large number of feasible conformations.
While the Flory’s model treats unfolded proteins as polymers consisting of uncorrelated monomers, such a mean-field treatment nevertheless yields a scaling law (i.e., RG = R0Nν), arising from the repulsive excluded volume (EV) effects, that fits a large number of experimental data.12,14 Thus, the observation here of an overly expanded F(ab′)2 ensemble is indeed surprising. However, it is consistent with the notion that electrostatic interactions can influence the radius of gyration of proteins. For instance, it has been shown that several intrinsically unfolded proteins (e.g., γ-synuclein and prothymosin-α) in water have dimensions far beyond that predicted based on random-coil statistics12,14 (in one case by as much as two fold) due to their unusually high density of charges. Also in a related study,55 Thirumalai and coworkers have shown that certain ribosomal proteins show considerably increased RG values than predicted by Flory’s scaling law, due to the long, positively charged, unstructured chains in the tail region of the protein. Moreover, charge-charge interactions have been shown to play a distinct role in the unfolded states of proteins,56 such as barstar,57 cytochrome c,58,59 staphylococcal nuclease,58,60 and ribonuclease Sa.61 Furthermore, force-quench refolding simulations of the I27 immunoglobulin domain of the muscle protein titin indicate ~6 times reduction in radius of gyration when the molecule refolds from its unfolded (stretched) state,62 suggesting that it is possible to generate an expanded and thus slowly diffusing species.
In summary, using FCS we have examined the size distribution of two multi-domain proteins, protein A and the F(ab′)2 fragment of IgG as a function of GdnHCl concentration. F(ab′)2 is a predominantly β-sheet protein, whereas protein A is composed of mostly α-helices. Our results show that while GdnHCl induces protein A to expand in a gradual manner, consistent with the so-called continuous expansion model, the effect of GdnHCl on the molecular dimension of F(ab′)2 is much more complicated. In particular, at intermediate denaturant concentrations, the F(ab′)2 molecules adopt a highly expanded form with a molecular dimension exceeding the value predicted by Flory’s model. On the other hand, at high denaturant concentrations, the unfolded protein ensemble undergoes a significant compaction. Further denaturation experiments carried out with urea in the presence of high concentrations of salt appear to indicate that electrostatic repulsive interactions play an important role in giving rise to the unusual expansion of the F(ab′)2 fragment of IgG upon unfolding. Thus, these results together suggest that the nature and extent of specific interactions in a particular protein might lead to significant deviation from the commonly encountered continuous and gradual expansion model of protein unfolding.
Acknowledgments
We gratefully acknowledge financial support from the National Institutes of Health (GM-065978 and RR-01348) and the National Science Foundation (DMR05-20020). JMG is a trainee of the NIH Structural Biology Training Program at Penn. We also thank Dr. Dmochowski’s group for assistance with the FPLC measurement.
Abbreviation used
- FCS
Fluorescence correlation spectroscopy
- IgG
Immunoglobulin G
- GdnHCl
Guanidine hydrochloride
- CD
Circular dichroism
Footnotes
Publisher's Disclaimer: This is a PDF file of an unedited manuscript that has been accepted for publication. As a service to our customers we are providing this early version of the manuscript. The manuscript will undergo copyediting, typesetting, and review of the resulting proof before it is published in its final citable form. Please note that during the production process errors may be discovered which could affect the content, and all legal disclaimers that apply to the journal pertain.
References
- 1.Dill KA, Shortle D. Denatured states of proteins. Annu Rev Biochem. 1991;60:795–825. doi: 10.1146/annurev.bi.60.070191.004051. [DOI] [PubMed] [Google Scholar]
- 2.Smith LJ, Fiebig KM, Schwalbe H, Dobson CM. The concept of a random coil. Residual structure in peptides and unfolded proteins. Fold Des. 1996;1:R95–R106. doi: 10.1016/S1359-0278(96)00046-6. [DOI] [PubMed] [Google Scholar]
- 3.Wong KB, Clarke J, Bond CJ, Neira JL, Freund SMV, Fersht AR, Daggett V. Towards a complete description of the structural and dynamic properties of the denatured state of barnase and the role of residual structure in folding. J Mol Biol. 2000;296:1257–1282. doi: 10.1006/jmbi.2000.3523. [DOI] [PubMed] [Google Scholar]
- 4.Dyson JH, Wright PE. Insights into the structure and dynamics of unfolded proteins from nuclear magnetic resonance. Adv Protein Chem. 2002;62:311–340. doi: 10.1016/s0065-3233(02)62012-1. [DOI] [PubMed] [Google Scholar]
- 5.Zagrovic B, Snow CD, Khaliq S, Shirts MR, Pande VS. Native-like mean structure in the unfolded ensemble of small proteins. J Mol Biol. 2002;323:153–164. doi: 10.1016/s0022-2836(02)00888-4. [DOI] [PubMed] [Google Scholar]
- 6.Tang YF, Rigotti DJ, Fairman R, Raleigh DP. Peptide models provide evidence for significant structure in the denatured state of a rapidly folding protein: The villin headpiece subdomain. Biochemistry. 2004;43:3264–3272. doi: 10.1021/bi035652p. [DOI] [PubMed] [Google Scholar]
- 7.Tucker MJ, Oyola R, Gai F. Conformational distribution of a 14-residue peptide in solution: A fluorescence resonance energy transfer study. J Phys Chem B. 2005;109:4788–4795. doi: 10.1021/jp044347q. [DOI] [PubMed] [Google Scholar]
- 8.Bernado P, Blanchard L, Timmins P, Marion D, Ruigrok RWH, Blackledge M. A structural model for unfolded proteins from residual dipolar couplings and small-angle x-ray scattering. Proc Natl Acad Sci USA. 2005;102:17002–17007. doi: 10.1073/pnas.0506202102. [DOI] [PMC free article] [PubMed] [Google Scholar]
- 9.Bilsel O, Matthews CR. Molecular dimensions and their distributions in early folding intermediates. Curr Opin Struct Biol. 2006;16:86–93. doi: 10.1016/j.sbi.2006.01.007. [DOI] [PubMed] [Google Scholar]
- 10.Mittag T, Forman-Kay JD. Atomic-level characterization of disordered protein ensembles. Curr Opin Struct Biol. 2007;17:3–14. doi: 10.1016/j.sbi.2007.01.009. [DOI] [PubMed] [Google Scholar]
- 11.Wilkins DK, Grimshaw SB, Receveur V, Dobson CM, Jones JA, Smith LJ. Hydrodynamic radii of native and denatured proteins measured by pulse field gradient NMR techniques. Biochemistry. 1999;38:16424–16431. doi: 10.1021/bi991765q. [DOI] [PubMed] [Google Scholar]
- 12.Millet IS, Doniach S, Plaxco KW. Toward a taxonomy of the denatured state: Small angle scattering studies of unfolded proteins. Adv Protein Chem. 2002;62:241–262. doi: 10.1016/s0065-3233(02)62009-1. [DOI] [PubMed] [Google Scholar]
- 13.Choy W-Y, Mulder FAA, Crowhurst KA, Muhandiram DR, Millett IS, Doniach S, Forman-Kay JD, Kay LE. Distribution of molecular size within an unfolded state ensemble using small-angle X-ray scattering and pulse field gradient NMR techniques. J Mol Biol. 2002;316:101–112. doi: 10.1006/jmbi.2001.5328. [DOI] [PubMed] [Google Scholar]
- 14.Kohn JE, Millett IS, Jacob J, Zagrovic B, Dillon TM, Cingel N, Dothager RS, Seifert S, Thiyagarajan P, Sosnick TR, Hasan MZ, Pande VS, Ruczinski I, Doniach S, Plaxco KW. Random-coil behavior and the dimensions of chemically unfolded proteins. Proc Natl Acad Sci USA. 2004;101:12491–12496. doi: 10.1073/pnas.0403643101. [DOI] [PMC free article] [PubMed] [Google Scholar]
- 15.Fitzkee NC, Rose GD. Reassessing random-coil statistics in unfolded proteins. Proc Natl Acad Sci USA. 2004;101:12497–12502. doi: 10.1073/pnas.0404236101. [DOI] [PMC free article] [PubMed] [Google Scholar]
- 16.Jha AK, Colubri A, Freed KF, Sosnick TR. Statistical coil model of the unfolded state: Resolving the reconciliation problem. Proc Natl Acad Sci USA. 2005;102:13099–13104. doi: 10.1073/pnas.0506078102. [DOI] [PMC free article] [PubMed] [Google Scholar]
- 17.Jacob J, Dothager RS, Thiyagarajan P, Sosnick TR. Fully reduced ribonuclease A does not expand at high denaturant concentration or temperature. J Mol Biol. 2007;367:609–615. doi: 10.1016/j.jmb.2007.01.012. [DOI] [PubMed] [Google Scholar]
- 18.Wang Z, Plaxco KW, Makarov DE. Influence of local and residual structures on the scaling behavior and dimensions of unfolded proteins. Biopolymers. 2007;86:321–328. doi: 10.1002/bip.20747. [DOI] [PubMed] [Google Scholar]
- 19.Lipfert J, Doniach S. Small-angle X-ray scattering from RNA, proteins, and protein complexes. Annu Rev Biophys Biomol Struct. 2007;36:307–327. doi: 10.1146/annurev.biophys.36.040306.132655. [DOI] [PubMed] [Google Scholar]
- 20.Zhou HX. Dimensions of denatured protein chains from hydrodynamic data. J Phys Chem B. 2002;106:5769–5775. [Google Scholar]
- 21.Goldenberg DP. Computational simulation of the statistical properties of unfolded proteins. J Mol Biol. 2003;326:1615–1633. doi: 10.1016/s0022-2836(03)00033-0. [DOI] [PubMed] [Google Scholar]
- 22.Dima RI, Thirumalai D. Asymmetry in the shapes of folded and denatured states of proteins. J Phys Chem B. 2004;108:6564–6570. [Google Scholar]
- 23.Ding F, Jha RK, Dokholyan NV. Scaling behavior and structure of denatured proteins. Structure. 2005;13:1047–1054. doi: 10.1016/j.str.2005.04.009. [DOI] [PubMed] [Google Scholar]
- 24.Tran HT, Pappu RV. Toward an accurate theoretical framework for describing ensembles for proteins under strongly denaturing conditions. Biophys J. 2006;91:1868–1886. doi: 10.1529/biophysj.106.086264. [DOI] [PMC free article] [PubMed] [Google Scholar]
- 25.Frieden C, Chattopadhyay K, Elson EL. What fluorescence correlation spectroscopy can tell us about unfolded proteins. Adv Protein Chem. 2002;62:91–110. doi: 10.1016/s0065-3233(02)62006-6. [DOI] [PubMed] [Google Scholar]
- 26.Kuzmenkina EV, Heyes CD, Nienhaus GU. Single-molecule Förster resonance energy transfer study of protein dynamics under denaturing conditions. Proc Natl Acad Sci USA. 2005;102:15471–15476. doi: 10.1073/pnas.0507728102. [DOI] [PMC free article] [PubMed] [Google Scholar]
- 27.Chattopadhyay K, Saffarian S, Elson EL, Frieden C. Measuring unfolding of proteins in the presence of denaturant using fluorescence correlation spectroscopy. Biophys J. 2005;88:1413–1422. doi: 10.1529/biophysj.104.053199. [DOI] [PMC free article] [PubMed] [Google Scholar]
- 28.McCarney ER, Werner JH, Bernstein SL, Ruczinski I, Makarov DE, Goodwin PM, Plaxco KW. Site-specific dimensions across a highly denatured protein; a single molecule study. J Mol Biol. 2005;352:672–682. doi: 10.1016/j.jmb.2005.07.015. [DOI] [PubMed] [Google Scholar]
- 29.Slaughter BD, Unruh JR, Price ES, Huynh JL, Urbauer RJB, Johnson CK. Sampling unfolding intermediates in calmodulin by single-molecule spectroscopy. J Am Chem Soc. 2005;127:12107–12114. doi: 10.1021/ja0526315. [DOI] [PubMed] [Google Scholar]
- 30.Sherman E, Haran G. Coil-globule transition in the denatured state of a small protein. Proc Natl Acad Sci USA. 2006;103:11539–11543. doi: 10.1073/pnas.0601395103. [DOI] [PMC free article] [PubMed] [Google Scholar]
- 31.Chen HM, Rhoades E, Butler JS, Loh SN, Webb WW. Dynamics of equilibrium structural fluctuations of apomyoglobin measured by fluorescence correlation spectroscopy. Proc Natl Acad Sci USA. 2007;104:10459–10464. doi: 10.1073/pnas.0704073104. [DOI] [PMC free article] [PubMed] [Google Scholar]
- 32.Merchant KA, Best RB, Louis JM, Gopich IV, Eaton WA. Characterizing the unfolded states of proteins using single-molecule FRET spectroscopy and molecular simulations. Proc Natl Acad Sci USA. 2007;104:1528–1533. doi: 10.1073/pnas.0607097104. [DOI] [PMC free article] [PubMed] [Google Scholar]
- 33.Magde D, Elson EL, Webb WW. Fluorescence correlation spectroscopy 2. Experimental realization. Biopolymers. 1974;13:29–61. doi: 10.1002/bip.1974.360130103. [DOI] [PubMed] [Google Scholar]
- 34.Haustein E, Schwille P. Fluorescence correlations spectroscopy: novel variations of an established technique. Annu Rev Biophys Biomol Struct. 2007;36:151–169. doi: 10.1146/annurev.biophys.36.040306.132612. [DOI] [PubMed] [Google Scholar]
- 35.Lilie H, Buchner J. Domain interactions stabilize the alternatively folded state of an antibody Fab fragment. FEBS Letters. 1995;362:43–46. doi: 10.1016/0014-5793(95)00203-l. [DOI] [PubMed] [Google Scholar]
- 36.Lilie H. Folding of the Fab fragment within the intact antibody. FEBS Letters. 1997;417:239–242. doi: 10.1016/s0014-5793(97)01293-3. [DOI] [PubMed] [Google Scholar]
- 37.Goto Y, Hamaguchi K. Unfolding and refolding of the constant fragment of the immunoglobulin light chain. J Mol Biol. 1982;156:891–910. doi: 10.1016/0022-2836(82)90146-2. [DOI] [PubMed] [Google Scholar]
- 38.Goto Y, Hamaguchi K. Unfolding and refolding of the constant fragment of the immunoglobulin light chain - kinetic role of the intrachain disulfide bond. J Mol Biol. 1982;156:911–926. doi: 10.1016/0022-2836(82)90147-4. [DOI] [PubMed] [Google Scholar]
- 39.Bork P, Holm L, Sander C. The immunoglobulin fold - structural classification, sequence patterns and common core. J Mol Biol. 1994;242:309–320. doi: 10.1006/jmbi.1994.1582. [DOI] [PubMed] [Google Scholar]
- 40.Lilie H, Rudolph R, Buchner J. Association of antibody chains at different stages of folding: prolyl isomerization occurs after formation of quarternary structure. J Mol Biol. 1995;248:190–201. doi: 10.1006/jmbi.1995.0211. [DOI] [PubMed] [Google Scholar]
- 41.Rothlisberger D, Honegger A, Pluckthun A. Domain interactions in the Fab fragment: A comparative evaluation of the single-chain Fv and Fab format engineered with variable domains of different stability. J Mol Biol. 2005;347:773–789. doi: 10.1016/j.jmb.2005.01.053. [DOI] [PubMed] [Google Scholar]
- 42.Feige MJ, Hagn F, Esser J, Kessler H, Buchner J. Influence of the internal disulfide bridge on the folding pathway of the C-L antibody domain. J Mol Biol. 2007;365:1232–1244. doi: 10.1016/j.jmb.2006.10.049. [DOI] [PubMed] [Google Scholar]
- 43.Moks T, Abrahamsen L, Nilsson B, Hellman U, Sjoquist J, Uhlen M. Staphylococcal protein A consists of five IgG-binding domains. Eur J Biochem. 1986;156:637–643. doi: 10.1111/j.1432-1033.1986.tb09625.x. [DOI] [PubMed] [Google Scholar]
- 44.The FCS measurements were carried out using a confocal microscope (Nikon Eclipse TE 300) setup equipped with an oil immersion objective (N.A. = 1.3) and a 50 μm confocal pinhole.45,46 Excitation of the Alexa 555 labeled protein samples (3-5 nM) was accomplished by the 514 nm line of an Ar+ ion laser (~100 μW before entering the microscope), and the resultant fluorescence was equally split by a nonpolarizing beamsplitter (Newport, CA) and detected by two avalanche photodiodes (Perkin Elmer, NJ) using an integration time of 1 μs. Correlating the fluorescence signals in the cross-correlation mode was accomplished by a Flex 03-LQ-01 correlator card (Correlator.com, NJ) for a duration of 150 s. It is known that high concentration of GdnHCl and urea increases the confocal volume (due to refractive index mismatch) and also the viscosity of the solution, both lengthening the apparent diffusion time. Thus, all the τD’s obtained from FCS measurements involving denaturants were ‘corrected’ to yield the reported values following common practice (see ref 25, 30), namely, by calibrating the aforementioned effects using the diffusion time of a standard (R6G in the current case) measured under the same solution conditions.
- 45.Purkayastha P, Klemke JW, Lavender S, Oyola R, Cooperman BS, Gai F. alpha(1)-Antitrypsin polymerization: A fluorescence correlation spectroscopic study. Biochemistry. 2006;44:2642–2649. doi: 10.1021/bi048662e. [DOI] [PubMed] [Google Scholar]
- 46.Chowdhury P, Wang W, Lavender S, Bunagan MR, Klemke JW, Tang J, Saven JG, Cooperman BS, Gai F. Fluorescence correlation spectroscopic study of serpin depolymerization by computationally designed peptides. J Mol Biol. 2007;369:462–473. doi: 10.1016/j.jmb.2007.03.042. [DOI] [PMC free article] [PubMed] [Google Scholar]
- 47.Meseth U, Wohland T, Rigler R, Vogel H. Resolution of fluorescence correlation measurements. Biophys J. 1999;76:1619–1631. doi: 10.1016/S0006-3495(99)77321-2. [DOI] [PMC free article] [PubMed] [Google Scholar]
- 48.Wohland T, Rigler R, Vogel H. The standard deviation in fluorescence correlation spectroscopy. Biophys J. 2001;80:2987–2999. doi: 10.1016/S0006-3495(01)76264-9. [DOI] [PMC free article] [PubMed] [Google Scholar]
- 49.Flory PJ. The configuration of real polymer chains. J Chem Phys. 1949;17:303–310. [Google Scholar]
- 50.Starr TE, Thompson NL. Local diffusion and concentration of IgG near planar membranes: Measurement by total internal reflection with fluorescence correlation spectroscopy. J Phys Chem B. 2002;106:2365–2371. [Google Scholar]
- 51.Armstrong JK, Wenby RB, Meiselman HJ, Fisher TC. The hydrodynamic radii of macromolecules and their effect on red blood cell aggregation. Biophys J. 2004;87:4259–4270. doi: 10.1529/biophysj.104.047746. [DOI] [PMC free article] [PubMed] [Google Scholar]
- 52.Crick SL, Jayaraman M, Frieden C, Wetzel R, Pappu RV. Fluorescence correlation spectroscopy shows that monomeric polyglutamine molecules form collapsed structures in aqueous solutions. Proc Natl Acad Sci USA. 2006;103:16764–16769. doi: 10.1073/pnas.0608175103. [DOI] [PMC free article] [PubMed] [Google Scholar]
- 53.FPLC measurements were carried out on an Akta FPLC system (GE Healthcare). The column was calibrated by using high molecular weight standards as described in the manufacturer’s protocol. 1.5 μM Alexa-F(ab′)2 in 4 M GdnHCl at pH 7 was incubated overnight. This sample was then passed through a Superdex S200 column under the same denaturing condition (i.e., in the presence of 4 M GdnHCl). The elution trace, monitored at 280 nm, showed a single peak at 10.3 mL, which corresponds to the molecular weight of monomeric Alexa-F(ab′)2 based on the calibration.
- 54.Makhatadze GI, Privalov PL. Protein interactions with urea and guanidium chloride – a calorimetric study. J Mol Biol. 1992;226:491–505. doi: 10.1016/0022-2836(92)90963-k. [DOI] [PubMed] [Google Scholar]
- 55.Changbong H, Dima RI, Thirumalai D. Size, shape, and flexibility of RNA structures. J Chem Phys. 2006;125:194905, 1–10. doi: 10.1063/1.2364190. [DOI] [PubMed] [Google Scholar]
- 56.Zhou HX. A Gaussian-chain model for treating residual charge-charge interactions in the unfolded state of proteins. Proc Natl Acad Sci USA. 2002;99:3569–3574. doi: 10.1073/pnas.052030599. [DOI] [PMC free article] [PubMed] [Google Scholar]
- 57.Hofmann H, Golbik RP, Ott M, Hübner CG, Ulbrich-Hofmann R. Coulomb forces control the density of the collapsed unfolded state of barstar. J Mol Biol. 2008;376:597–605. doi: 10.1016/j.jmb.2007.11.083. [DOI] [PubMed] [Google Scholar]
- 58.Kundrotas PK, Karshikoff A. Effects of charge-charge interactions on dimensions of unfolded proteins: A monte carlo study. J Chem Phys. 2003;119:3574–3581. [Google Scholar]
- 59.Segel DJ, Fink AL, Hodgson KO, Doniach S. Protein denaturation: A small-angle X-ray scattering study of the ensemble of unfolded states of cytochrome c. Biochemistry. 1998;37:12443–12451. doi: 10.1021/bi980535t. [DOI] [PubMed] [Google Scholar]
- 60.Panick G, Malessa R, Winter R, Rapp G, Frye KJ, Royer CA. Structural characterization of the pressure-denatured state and unfolding/refolding kinetics of staphylococcal nuclease by synchrotron small-angle X-ray scattering and Fourier-transform infrared spectroscopy. J Mol Biol. 1998;275:389–402. doi: 10.1006/jmbi.1997.1454. [DOI] [PubMed] [Google Scholar]
- 61.Pace CN, Alston RW, Shaw KL. Charge-charge interactions influence the denatured state ensemble and contribute to protein stability. Protein Sci. 2000;9:1395–1398. doi: 10.1110/ps.9.7.1395. [DOI] [PMC free article] [PubMed] [Google Scholar]
- 62.Li MS, Hu CK, Klimov DK, Thirumalai D. Multiple stepwise refolding of immunoglobulin domain I27 upon force quench depends on initial conditions. Proc Natl Acad Sci USA. 2006;103:93–98. doi: 10.1073/pnas.0503758103. [DOI] [PMC free article] [PubMed] [Google Scholar]