Summary
We demonstrate that dynamic secondary ion mass spectrometry (SIMS)-based ion microscopy can provide a means of measuring 13C assimilation into individual bacterial cells grown on 13C-labeled organic compounds in the laboratory and in field soil. We grew pure cultures of Pseudomonas putida NCIB 9816-4 in minimal media with known mixtures of 12C- and 13C-glucose and analyzed individual cells via SIMS imaging. Individual cells yielded signals of masses 12, 13, 24, 25, 26, and 27 as negative secondary ions indicating the presence of 12C−, 13C−, 24(12C2)−, 25(12C13C)−, 26(12C14N)−, and 27(13C14N)− ions, respectively. We verified that ratios of signals taken from the same cells only changed minimally during a ∼4.5-min period of primary O2+ beam sputtering by the dynamic SIMS instrument in microscope detection mode. There was a clear relationship between mass 27 and 26 signals in Psuedomonas putida cells grown in media containing varying proportions of 12C- to 13C-glucose: a standard curve was generated to predict 13C-enrichment in unknown samples. We then used two strains of Pseudomonas putida able to grow on either all or only a part of a mixture of 13C-labeled and unlabeled carbon sources to verify that differential 13C signals measured by SIMS were due to 13C assimilation into cell biomass. Finally, we made three key observations after applying SIMS ion microscopy to soil samples from a field experiment receiving 12C- or 13C-phenol: (i) cells enriched in 13C were heterogeneously distributed among soil populations; (ii) 13C-labeled cells were detected in soil that was dosed a single time with 13C-phenol; and (iii) in soil that received 12 doses of 13C-phenol, 27% of the cells in the total community were more than 90% 13C-labeled.
Introduction
Linking the identity of active microorganisms with their function in situ is a central challenge in environmental microbiology (Madsen, 2005). Techniques such as stable isotope probing (SIP), which combine molecular identification methods with isotopic tracers (Boschker et al., 1998; Buckley et al., 2006; Leigh et al. 2007; Lu and Conrad, 2005; Madsen, 2005, 2006; Manefield et al., 2002; Neufeld et al., 2007; Radajewski et al., 2000; Whiteley et al. 2007), are proving to be effective and insightful means for identifying metabolically active microorganisms (Jeon et al., 2003; Kasai et al., 2006; Liou et al. 2008; Pumphrey and Madsen, 2008). The growing application of such techniques in microbial ecology has increased interest in developing microscopic techniques that both confirm the role of microorganisms that are identified through SIP and measure the amount of isotopic label individual cells have incorporated the into their biomass.
When suitable probes are available, fluorescent in situ hybridization (FISH) is an effective means of microscopic identification of microorganisms (Wagner et al., 2003), and can be combined with techniques using radioactive and stable isotopes to identify metabolically active microorganisms. The localization of radioactive isotopes can be determined through microautoradiography, and when used in combination with FISH, can provide insight into the structure and function of microbial communities (Lee et al., 1999; Ouverney and Fuhrman 1999, Wagner et al., 2006). For the localization and measurement of stable isotopes, Raman microspectroscopy (Huang et al., 2004; Huang et al., 2007) and secondary ion mass spectrometry (SIMS) are potentially powerful methods that have been successfully combined with FISH.
SIMS is a technique that can characterize the isotopic composition of a sample by first bombarding the sample surface with a primary ion beam, and then separating and measuring the resulting secondary ions by mass spectrometry (Chandra, 2005; Chandra and Morrison, 2000; Morrison and Slodzian, 1975). To date researchers have applied various SIMS techniques to pure cultures and environmental samples to measure 13C, 15N, as well as inorganic isotopes in bacteria. Early pioneering studies applying SIMS to microbial systems used a SIMS ion microprobe in combination with fluorescent in-situ hybridization (FISH) to show that methane-consuming Archaea in anoxic marine sediments were naturally 13C-depleted (Orphan et al., 2001; Orphan et al., 2002). A SIMS ion microprobe was also used in combination with autoradiography and FISH to show CH4 and CO2 consumption by methanotrophic microbial mats (Treude et al., 2007). Time of flight SIMS (TOF-SIMS) has been used to measure inorganic carbon and nitrogen assimilation in individual bacterial cells and fungal hyphae (Cliff et al., 2002), and to distinguish Bacillus subtilis spores grown on different media based elemental signatures (Cliff et al., 2005). Lechene et al. (2006) demonstrated the use of nano-scale SIMS (NanoSIMS) to show 15N fixation by Teredinibacter turnerae and not Enterococcus faecalis in pure culture, and NanoSIMS was able to distinguish 15N-enriched Pseudomonas fluorescens that were added to a soil matrix (Herrmann et al., 2007). Application of NanoSIMS to a biofilm dominated by sulfate-reducing bacteria showed the aggregation of extracellular proteins and biogenic zinc sulfide crystals (Moreau et al., 2007). The use of an oligonucleotide probe labeled with iodized cytidine was combined with NanoSIMS to visualize both Escherichia coli grown on different amounts of 13C and 15N, and an archaeal population from a municipal solid waste bioreactor growing on 13C-methanol (Li et al., 2007). Behrens et al. (2008) combined NanoSIMS with element labeling-FISH (EL-FISH), which allowed both fluorescent and SIMS imaging of a consortium consisting of filamentous cyanobacteria and an epibiont. NanoSIMS was also used to characterize cellular development and metabolite exchange in filamentous cyanobacteria (Popa et al., 2007).
SIMS technology has tremendous potential to aid investigations examining the role of bacteria in the biodegradation of organic pollutants. DeRito et al. (2005) used dynamic SIMS ion microscopy to provide qualitative evidence that a soil community exposed to 13C-phenol was enriched in 13C relative to a population that received an equal amount of 12C-phenol. However, in this study the increased 13C signal detected by SIMS was qualitative, and the amount of 13C incorporated into the bacterial biomass was unclear. A related ratio imaging approach applied to dynamic SIMS ion microscopy clearly distinguished 13C-labeled from unlabeled cells in soil samples (Chandra et al., 2008). In the present investigation, we show that it is possible to use dynamic SIMS ion microscopy to measure the degree of isotopic enrichment in single cells from pure cultures grown on mixtures of 12C- and 13C-labeled organic substrates. In addition, using pure-culture experiments to generate a dose-response curve, we estimated the degree of 13C-labeling in bacterial cells from a soil community that received 13C-phenol in a series of field soil experiments.
Results
Effect of continuous ion beam sputtering on the constancy of isotope ratios
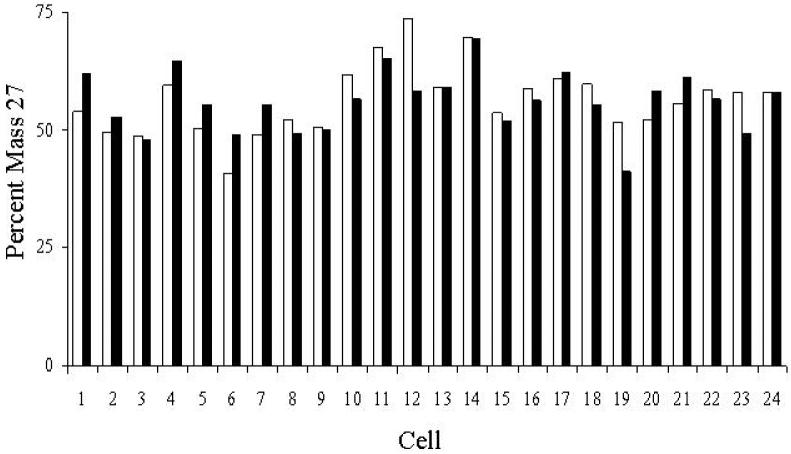
Our standard SIMS protocol for analyzing microbiological samples began with ∼1 min of primary O+2 beam exposure used for fine focusing and signal stabilization. Then, images of masses 12, 13, 24, 25, 26 and 27 as negative secondary ions from each field of view revealed the presence of 12C−, 13C−, 24(12C2)−, 25(13C12C)−, 26(12C14N)−, and 27(13C14N)− in individual bacterial cells. The surface sputtering mechanism utilized by dynamic SIMS is a destructive process and masses are imaged one at a time in our ion microscope instrument; therefore, it is essential to know that mass signals and calculated isotopic ratios from microbiological samples are consistent throughout the time images are recorded. The percent mass 27 relative to mass 26 before and after the 4.5 minute beam exposure was calculated and used to compare the change in signals from Pseudomonas putida NCIB 9816-4 cells grown on 99% 13C-glucose (Fig. 1). The vertical axis in Fig. 1 did not reach 100% because several ions besides 26(12C14N)− contribute to the mass 26 signal (see below). Among the 24 cells randomly examined the average change in the percent mass 27 was 4.4% ± 3.7%, with only two cells showing a change of more than 10%. Additionally, the average percent mass 27 value for the 24 cells showed essentially no change from 56.4% ± 7.3 to 56.0% ± 6.4 after exposure to the primary ion beam. This shows that the SIMS ion microscopy sampling process under our experimental conditions caused minimal change in signal ratios over the time typically needed to record images; thus, dynamic SIMS ion microscopy can provide reliable data for determining isotope ratios in bacterial samples.
Figure 1.
A comparison of the change in mass 27 and mass 26 signal intensities detected by SIMS in P. putida NCIB 9816-4 cells grown on 13C-glucose after exposure to the O2+ beam for 4.5 min. The percent mass 27 for each cell was calculated from signal intensities from an initial measurement of mass 27 and 26 ions (white bars) and signal intensities from a subsequent measurement after 4.5 minutes of exposure to the O2+ beam (black bars). Image analysis was performed using DIP station software.
Measurement of 13C incorporation by pure cultures
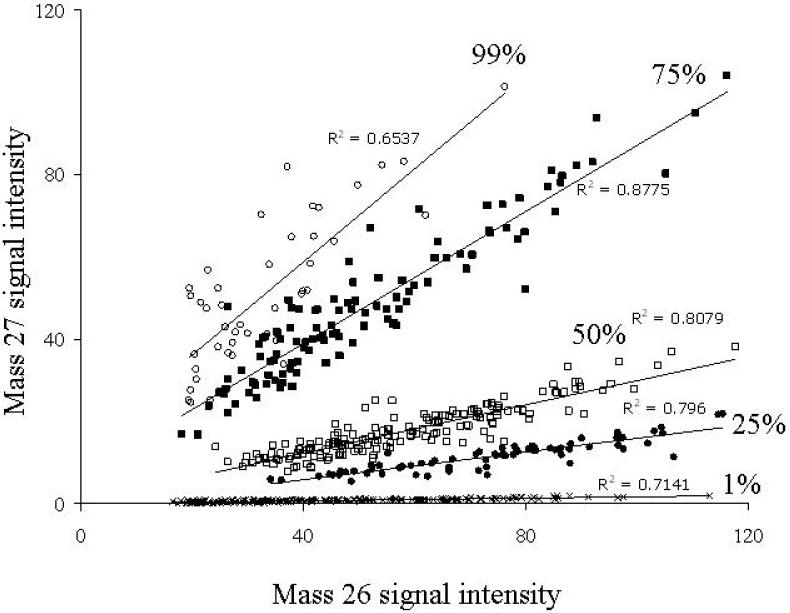
To determine whether dynamic SIMS ion microscopy could distinguish between cells that are unlabeled, partially labeled, or fully labeled with 13C, we grew pure cultures of Pseudomonas putida NCIB 9816-4 in minimal media with known mixtures of 12C- and 13C-glucose. Masses 12, 13, 24, 25, 26, and 27 were measured via SIMS imaging, and the average signal intensity for individual cells was measured both by hand drawing regions of interest (ROIs) within cells using DIP station and by using Metamorph® to automatically select ROIs by intensity and size (Fig. 2). Data generated from images of mass 27 and 26 are shown because these two masses provide optimal resolution among the available secondary ions. The other secondary ions produced similar data to mass 27 and mass 26 for pure cultures, but have been found to be less effective for soil samples (DeRito et al., 2005; Chandra et al., 2008). Plotting the intensity of 13C containing masses against the intensity of 12C containing masses for individual cells revealed increases in slope that corresponded with an increase in 13C-glucose in the growth medium (Fig. 2). Plotting signal intensities from individual cells also showed that though signal intensity can vary greatly between cells with similar 13C-enrichment, the ratios between signal intensities (i.e. mass 27 to mass 26) are consistent.
Figure 2.
A scatter plot showing the relationship between mass 27 and mass 26 signal intensities from individual cells of P. putida NCIB 9816-4 grown on 1 g· L−1 total glucose while varying the proportion of 13C label from 99 to 75, 50, 25, or 1%. Each data point represents an individual bacterial cell whose mass 27 and mass 26 signals were determined using SIMS. Up to 200 determinations were completed for each growth condition. Images were recorded by dynamic SIMS ion microscopy and signal intensities were measured with Metamorph® software.
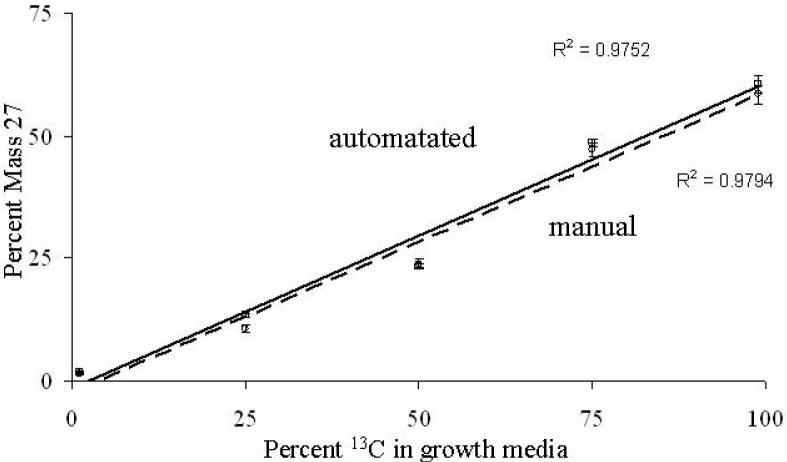
Standard curves were generated by plotting the average percent mass 27 values calculated from the mass 27 and 26 signals from individual cells, which were grown on various proportions of 13C-glucose. For each growth condition, 60 individual bacteria cells were measured manually and up to 200 individual bacteria cells were measured using a procedure with Metamorph® software to automatically select ROIs by intensity and size. Cultures were grown on glucose whose 13C proportions varied from 1%, 25%, 50%, 75%, or 99% 13C-glucose. Both manually measured images and the automated procedure using Metamorph® software produced equivalent standard curves (Fig. 3). The percent mass 27 values shows that as 13C increases in cellular biomass, the (13C2)− secondary ion makes a greater contribution to the mass 26 signal than the (12C14N)− secondary ion. Despite the influence of interfering masses, there is a positive correlation between mass 27 and 26 signals recorded by dynamic SIMS ion microscopy and the ratio of 13C- to 12C-glucose in the growth media (Fig. 3). This relationship can be used to quantitatively estimate 13C enrichment in samples with unknown carbon isotope ratios.
Figure 3.
Standard curves generated from pure cultures of P. putida NCIB 9816-4 grown on 0.1% glucose composed of 99, 75, 50, 25, or 1% 13C-glucose. Plotted points represent the mean percent mass 27 values calculated from the mass 27 and mass 26 signal intensities from individual cells that were measured by automated selection with Metamorph® software (×, solid trendline) or manually with DIP station software (+, dashed trendline). Error bars represent the 95% confidence interval for the mean of each sample. A total of 60 determinations for each growth condition were completed manually, and up to 200 were completed automatically.
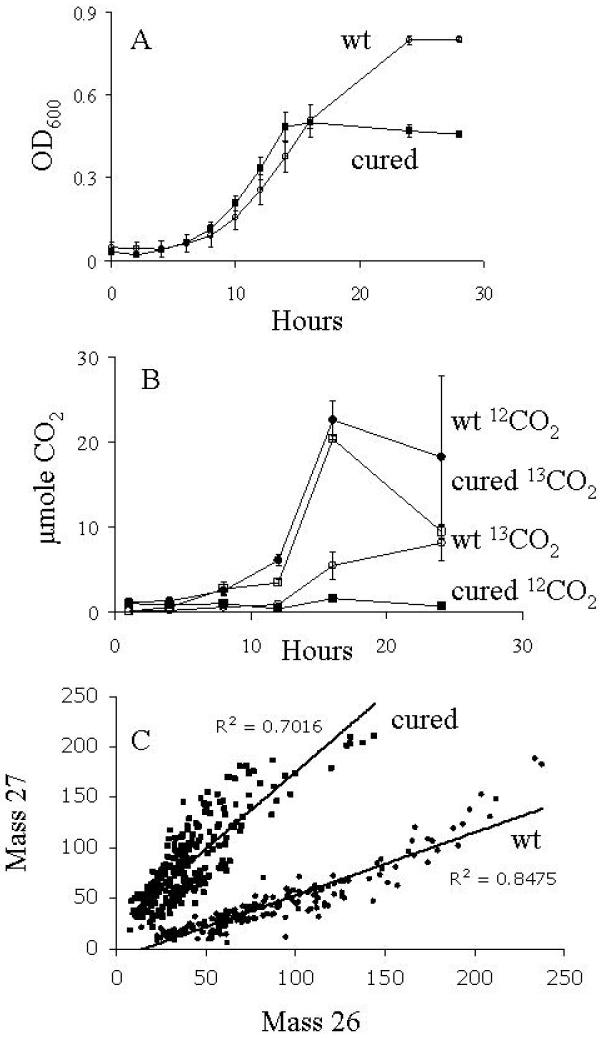
In order to demonstrate that an enriched signal measured by SIMS was due to metabolism and incorporation of the 13C, we conducted experiments with wild-type P. putida NCIB 9816-4 and P. putida NCIB 9816-4.C, which was cured of pDTG1, the plasmid encoding naphthalene-catabolic genes. Both the wild-type and cured strain were grown in minimal media containing a mixture of 13C-glucose and unlabeled (12C) naphthalene crystals and we monitored growth (OD), respiration, and mass 27/mass 26 ratios in individual cells using SIMS (Fig. 4). As expected, the highest OD reading (Fig. 4A) was achieved by the wild-type strain, able to utilize both glucose and naphthalene. The cured strain reached only moderate density (Fig 4A), confirming it was growing on glucose, not naphthalene. The wild-type strain released high amounts of both labeled and unlabeled CO2 (from glucose and naphthalene, respectively; Fig. 4 B), while the cured strain only respired 13CO2, indicating the cured strain only metabolized the 13C-glucose. As expected from the above trends in growth and respiration, the ratios of masses 27/26 in individual cells showed that the wild-type strain exhibited a low proportion of mass 27 in its biomass because its cell carbon was derived from both labeled and unlabeled substrates (Fig. 4C). In contrast, cured cells were fully labeled with 13C (Fig. 4C), which indicates the naphthalene was not incorporated into the cellular biomass and had little to no influence on the SIMS signal. Using the standard curve generated from pure culture standards (Fig. 3), the percent mass 27 values in the wild-type cells suggested mixed isotopic compositions that ranged between 30-70% 13C for individual cells, confirming the wild-type strain metabolized and incorporated both the 13C-glucose and 12C-naphthalene.
Figure 4.
Growth, respiration, and 13C-labeling of strains P. putida NCIB 8616-4 and P. putida NCIB 8616-4 C on a mixture of 13C-glucose and unlabeled naphthalene. (A) Growth in MSB amended with unlabeled naphthalene crystals and 0.1% 13C-glucose. (B) Production of labeled and unlabeled CO2 respired during growth on the substrates shown in (A). (C) Mass 27 and 26 signal intensities for individual wild-type (wt) or cured P. putida NCIB 9816-4 cells after growth on the media in (A). Signal intensities were measured with Metamorph® software.
Measurement of 13C incorporation by phenol-degraders in soil
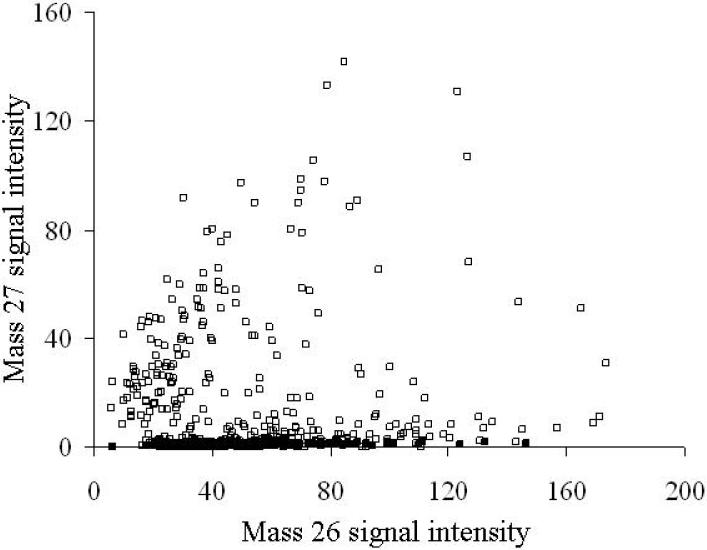
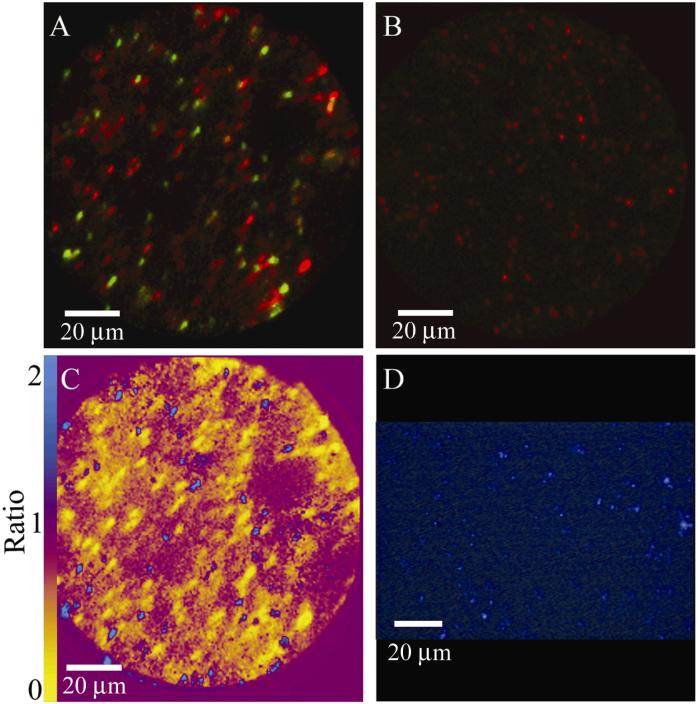
Confident in our methods to measure carbon isotope composition in bacteria, we applied SIMS ion microscopy to soil communities that were exposed to 12C- or 13C-phenol in the field. We plotted the mass 27 and mass 26 signal intensities from soil treatments that received twelve 20-µl doses (200 µg phenol per dose) of either 13C- or unlabeled phenol (Fig. 5). The pattern of labeling clearly shows that many cells in the soil receiving 13C-phenol were enriched in 13C compared to cells from soil receiving only 12C-phenol (Fig. 5). The mass 27 and 26 signal intensities from the 12C-phenol treatment were consistent with intensities shown in Figs. 2 and 3. The mass 27 and 26 signal intensities from the 13C-phenol treatment indicated a much more diverse distribution in terms of 13C content: data in Fig. 5 clearly show cells containing a low (natural abundance) of 13C, as well as cells exhibiting a high degree of 13C enrichment. Overlay images created by combining mass 27 images (green) and mass 26 images (red) confirmed that the soil microbial community exposed to 13C-phenol contained heterogeneous populations, with many cells showing no incorporation of the 13C-label and others showing a range of 13C incorporation (Fig. 6A). It is not possible to distinguish metabolically inactive cells from those that grew on phenol in the 12C-phenol treatment (Fig. 6B). Images created by overlaying the intensity of mass 27 onto mass 26 for individual cells, provided a means of direct, semi-quantitative assessment of 13C incorporation (Fig. 6 C). High mass 27 signals in cells (blue in Fig 6 C) clearly metabolized 13C-phenol; while cells showing low (natural abundance) mass 27 signals in cells (yellow in Fig. 6 C) did not. An image of a comparable soil sample stained with DAPI (Fig. 6D) is provided for comparison with the SIMS images. Absence of any 13C signal in many cells in these images (Fig. 6) reinforce the information from Fig. 4 that signal intensity is a result of 13C assimilation, not caused by physical association between the cell and an added labeled chemical.
Figure 5.
A scatter plot showing the relationship between mass 27 and mass 26 signal intensities of bacterial cells detected by SIMS in soils exposed to 12 doses of 13C-phenol (□) or 12C-phenol (■). The signal intensities of 481 regions of interest (ROIs) from images of soil receiving 12C-phenol and 327 ROIs from images of soil receiving 13C-phenol were measured with Metamorph® software.
Figure 6.
A comparison of mass 27 and mass 26 SIMS images. Mass 27 (green) to mass 26 (red) overlay of field samples dosed with (A) 13C-phenol or (B) 12C-phenol. (C) Mass 27 to 26 ratio image of the same 13C-phenol exposed soil. (D) DAPI image, 40x magnification, of comparable soil sample not exposed to the O2+ beam.
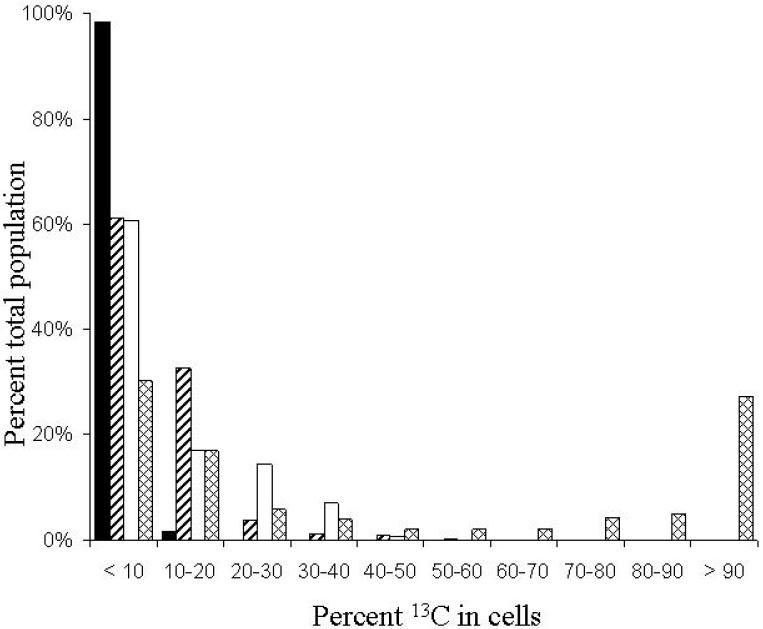
To estimate percent 13C-enrichment in individual cells from the soil community dosed with either labeled or unlabeled phenol, the percent mass 27 was calculated for each ROI measured using Metamorph®, and percent 13C-enrichment was estimated using the standard curve generated from pure cultures (Fig. 3). Cells from the 4 field-dosing treatments were grouped according to percent 13C-enrichment by 10% intervals to show the distribution of 13C in the populations that received 12C- or 13C-phenol (Fig. 7). For the control treatment of soil dosed 12 times with 12C-phenol, 98% (473 of 481) of the cells were found to have less than 10% 13C in their biomass. The distribution of 13C in cells from soil dosed 12 times with 13C-phenol differed markedly from the control treatment: only 30% (99 of 327) of the cells from soil dosed with 13C-phenol were found to be less than 10% 13C-labeled; while 27% of the cells were more than 90% 13C-labeled, suggesting many cells were metabolizing the 13C-phenol exclusively. The remainder of signals from cells in the multiple 13C-phenol treatment were of intermediate intensity (from 20% to 80 % enrichment), which was likely due to a combination of mixotrophy, carbon cross-feeding, and possible heterogeneous distribution of 13C-phenol in the soil matrix.
Figure 7.
Bar graph comparing the distribution of 13C signal intensity in individual bacterial cells responding to four types of phenol treatments in a field-soil experiment. The four treatments were: (i) the soil was dosed 12 times with 12C-phenol (black bars, 481 ROIs measured) over a period of 12 days; (ii) no phenol was added for the first 11 days, only a single dose of 13C-phenol was added prior to sampling at the end of day 12 (diagonal lines, 1150 ROIs measured); (iii) during the same 12-day period, the soil was dosed 11 times with 12C-phenol with a final dose of 13C-phenol (white bars, 242 ROIs measured); and (iv) soil was dosed 12 times with 13C-phenol (cross hatching, 327 ROIs measured). For each treatment, the percent 13C-enrichment of individual cells was estimated using the standard curve (Fig. 3) generated from pure cultures of P. putida NCIB 9816-4 grown on known amounts of 13C-glucose. Cells were categorized by 10% intervals. Ratios were calculated from signal intensities measured with Metamorph® software.
Cells enriched with 13C above background levels were also detected in the two soil treatments that received a single dose of 13C-phenol. From the soil community that only received a single dose of 13C-phenol (no unlabled substrate), 61% (704 of 1150) were less than 10% labeled, while 33% contained between 10 and 20% 13C-label, 4% of the cells contained between 20 and 30% label, and a small number of cells contained between 30 and 60% 13C-label (Fig. 7). Like the treatment with no prior exposure, 60% (147 of 242 cells) of the soil community exposed to unlabeled phenol (11 doses) prior to a single dose of labeled phenol was less than 10% labeled; however, 14% of the population was labeled with 20-30% 13C, and 7% of the cells contained between 30% and 40% 13C-label. No detected cells in either treatment that received a single dose of 13C-phenol were greater than 70% 13C-labeled, though the possibility of >90% labeling of rare cells cannot be dismissed. Although multiple doses of 13C-phenol were necessary for detection the of fully labeled cells, dynamic SIMS ion microscopy was sensitive enough to distinguish between 13C-labeled cells and unlabeled cells in soil after exposure to a single dose of 200 µg 13C-phenol for 24 hours. These cells are likely to be the primary phenol degraders; not cells labeled through carbon cross-feeding.
Discussion
In this study, we demonstrate the use of dynamic SIMS ion microscopy to measure 13C-incorporation into individual bacteria grown in two settings: laboratory media and field soil. It was first necessary to show that although the primary ion beam used in SIMS erodes the sample surface, we could obtain reliable and consistent images of bacteria (Fig. 1). Overall, we found that signal change during SIMS analysis processing was minimal over exposure times typically needed to collect images. However, occasionally signals from a small number of cells would disappear or appear during image acquisition, presumably due to changes to the sample surface caused by the primary ion beam and exposure of new cells hidden beneath the sampling plane. To increase the likelihood of reliable signals it is advisable to optimize and limit exposure times, sequentially record images of corresponding ions (i.e. mass 26 then mass 27), and collect data from a large sample size.
For dynamic SIMS ion microscopy assays to allow inferences about metabolic function, it was necessary to link substrate assimilation to 13C signal detection. For this purpose, we chose two strains of Pseudomonas putida, one with and one without a naphthalene catabolic plasmid. Absence of the plasmid prevented cells from incorporating carbon from naphthalene when cells were exposed to a mixture of 13C-glucose and unlabeled naphthalene. The data (Fig. 4) clearly showed that 13C signal intensity (measured by SIMS) was proportionate to the degree of 13C-substrate respiration and growth. It was possible to measure 13C incorporation in bacteria by imaging masses 12, 13, 24, 25, 26, and 27 representing contributions from 12(12C−), 13(13C−), 24(12C2)−, 25(13C12C)−, 26(12C14N)−, and 27(13C14N)− secondary ions, respectively (Figs. 2-3).
One goal of this study was to estimate the percent 13C contained in bacterial cells. To do this, a standard curve was generated using pure cultures grown on known amounts of 13C. Previous studies have presented isotopic enrichment by calculating percent atom enrichment directly from isotopes measured by SIMS (Cliff et al., 2002; Li et al., 2007), or by calculating atom percent excess (APE) (Behrens et al., 2008; Popa et al., 2007). APE is useful for demonstrating isotopic enrichment relative to a control sample or samples measured at the beginning of a time series, but it is not necessarily indicative of the percent 13C atom in a sample. In addition, unlike NanoSIMS and TOF-SIMS techniques, the IMS-3f SIMS ion microscope used in this study does not provide the mass resolution needed to distinguish 12C and 13C negative secondary ions from potentially interfering species, which makes quantifying isotopic enrichment directly from measured ions less effective. However, using pure cultures grown on known amounts of 13C, we were able to show that the relationship between mass 26 and mass 27 signal intensities strongly correlated with 13C enrichment in cells (Figs. 2-4).
When we measured the distribution of 13C in a soil microbial community that had respired 13C-phenol in situ, dynamic SIMS ion microscopy allowed us to quantify 13C incorporated into individual cells (Figs. 5-7). Using the calibration and image-processing procedures developed here and applied to our prior field soil experiments (DeRito et al., 2005), we found that when soil was dosed 12 times with 13C-phenol, 27% of the soil microbial populations assimilated at least 90% of their cell carbon from the added 13C-phenol. The majority of cells however, were partially 13C-labeled. Because the phenol was applied to soil, it is likely that the availability of phenol was not even and that gradients were present. Thus, some cells may have metabolized phenol exclusively, but did not acquire enough phenol to become fully labeled. It is also likely that mixotrophs in the population were metabolizing 13C-phenol as well as other non-labeled substrates. Carbon cross-feeding may also lead to partial 13C-labeling as bacteria metabolize by-products and other cellular components from the primary phenol degraders. We note that a substantial portion of the soil community treated with 13C-phenol never delivered a 13C-signal above background (approximately 60% from soil treated with one dose of 13C-phenol and 30% from soil treated with 12 doses 13C-phenol). These are likely dormant cells or ones that utilize substrates other that phenol, or simply ones whose growth rate on phenol is relatively slow. Understanding the physiology and ecological role of soil populations found to be inactive by SIMS microscopy is a major research frontier.
In order for dynamic SIMS ion microscopy to be maximally insightful as a tool in microbial ecology, researchers should be able to use SIMS in combination with techniques that identify individually labeled cells that are isotopically enriched. We are exploring feasibility of using oligonucleotide probes in combination with dynamic SIMS ion microscopy. Additionally, different methods of sample preparation are being explored, such as cryogenic sample preparation, which may help improve quantitative interpretations by preserving the soluble pool of labeled molecules during the sample preparation.
Experimental Procedures
Bacterial strains and growth conditions
Standards of 13C-labeled bacteria grown in known ratios of 13C- and 12C-glucose were prepared by growing the naphthalene-degrading bacterium Pseudomonas putida NCIB 9816-4 (Serdar and Gibson 1989) overnight in mineral salts broth (MSB) (Stanier et al., 1966) amended with 1 g· L−1 total glucose while varying the proportion of 13C in the pool (Sigma 13C-glucose; 99 % purity). Initial proportions of the 13C label varied from 1% (natural abundance) to 25, 50, 75, or 99% 13C-glucose. To show that metabolism of 13C-glucose caused proportionate labeling of cells, P. putida NCIB 9816-4 and P. putida NCIB 9816-4.C (Stuart-Keil et al., 1998), a strain cured of the plasmid encoding naphthalene-catabolic genes, were grown in 6 ml MSB amended with 0.1% (w/v) 13C-glucose (6mg) and 10 mg 12C-naphthalene (unlabeled) crystals in tubes sealed with a Teflon®-lined septa. Bacterial growth and metabolism of the substrates were monitored by optical density and headspace analysis of respired CO2 by GC/MS, respectively. Pure culture samples were fixed for SIMS microscopy by adding 100 µl of bacterial culture to 300 µl of 4% formaldehyde.
GC/MS analysis of CO2
Procedures used were those of DeRito et al. (2005). A Hewlett-Packard HP5890 gas chromatograph (Wilmington, DE) equipped with an HP5971A mass-selective detector was used for CO2 analyses. With high-purity helium as the carrier gas, a Hewlett-Packard Pora Plot Q column (25 m by 0.32 mm, 10 µm film thickness) was used to separate CO2 from other gaseous components. The detector was operated at an electron energy of 70 eV and a detector voltage of 2,000 V. The ion source pressure was maintained at 1.33×10⁻³ Pa. A splitless injection was used, and the GC oven was isothermal at 60°C. Single-ion monitoring allowed simultaneous quantification of both 12CO2 (m/z = 44) and 13CO2 (m/z = 45). The concentration of CO2 was quantified using calibration curves prepared using external standards (Scott Specialty Gases, Plumsteadville, PA).
Soil field treatments
Soil samples produced in experiments by DeRito et al. (2005) were analyzed in this study. Briefly, a soil plot (Collamer silt loam) at the Cornell University Agricultural Experiment Station, Ithaca, NY was level and free of vegetation. A table was placed over the plot (0.8 m high) to protect the experiment from rain and direct exposure to sunlight. Three soil treatments received 12 daily doses of phenol, with each 20 µl dose containing 200 µg of phenol. The first treatment received only 12C-phenol and the second treatment received only 13C-phenol. The third treatment received 11 daily doses of 12C-phenol and a single dose of 13C-phenol on the twelfth day. A fourth treatment was not dosed with phenol for the first 11 days, but received a single dose of 13C-phenol on the twelfth day. Twenty-four hours following the final dose, one-tenth of a gram of surface soil was aseptically collected from the field treatments, fixed in 4% formaldehyde (1 ml), and stored in screw-cap glass vials.
SIMS imaging
Procedures used were those of Chandra et al. (2008). A small drop (∼2 µl) from the formaldehyde-fixed samples was smeared on the polished surface of sterile silicon wafer pieces (Silicon Quest International, Santa Clara, CA, about 1 cm2 surface area). The samples were air dried and heat-fixed to the silicon substrate by passing rapidly (∼2 sec) over a flame prior to SIMS analysis. A CAMECA IMS-3f SIMS ion microscope was used in the study. A 5.5 keV mass filtered primary ion beam of O2+ (about 100-200 nA beam current with a spot size of 60 µm) was raster scanned over a 250 µm2 or 500 µm2 region, depending on the need of a particular analysis, for imaging studies. A 60 µm contrast aperture and 150 µm transfer optics were employed in the imaging mode for the detection of negative secondary ion signals. SIMS images of masses 12, 13, 24, 25, 26, and 27, primarily representing contributions from 12C−, 13C−, 24(12C2)−, 25(13C12C)−, 26(12C14N)−, and 27(13C14N)−, respectively, were recorded for designated times on the Photometrics CCD camera capable of 14 bits per pixel image digitization. It should be noted that under these instrumental conditions of mass resolution of the ion microscope imaging mode, mass interfering species like 13(12CH)−, 26(13C2)−, 25(12C2H)−, 27(13C2H)−, and 27(13C14N)− cannot be separated from the species of interest like 25(12C13C)−, 26(12C14N)−, and 27(13C14N)−. However, the enhancement of signals reflected in ion microscopy images of masses 13, 25 and 27 from 13C-labeled phenol treated cells compared to controls does provide meaningful imaging of 13C incorporation in individual bacterial cells.
Image analysis
Computer image processing was performed with DIP Station (Haydon Image Processing Group). To measure the mean signal intensities for corresponding masses (i.e. 27 and 26), the images of corresponding masses from the same field of view were overlayed and registered. A region of interest (ROI) was drawn within an individual bacteria cell on one image, copied onto the same cell in the corresponding image, and the mean pixel intensities for the corresponding ROIs between the two images were measured. The relationship between masses 27 and 26 was calculated as percent mass 27 of the combined mass 26 and mass 27 signals using the following equation:
Ratio imaging provided a direct comparison of the enhancement of 13C signals in individual bacterial cells due to the treatment with 13C-labeled phenol in direct comparison to the unlabeled phenol treatment. For ratio imaging, the corresponding SIMS bacterial images were calibrated to a single contrast scale; then the 13C signal was divided by the 12C signal using the NIH's ImageJ software. The result is an image in which the value of each pixel is the ratio of one mass image to the other. A color gradient map was then applied to each ratio image in Adobe Photoshop, where 2:1=cyan, 1:1=magenta, and 0=yellow. This color scale allows clear distinction between the highest ratios (cyan, where 27(13C14N)− is greater than 26(12C14N)−), the 1:1 ratios (magenta), and the fractional ratios (yellow, where 13C isotopes are scarce or not present). The resulting image distinguishes which bacteria are assimilating the 13C-labeled compound and which are not. Overlay images were created using Metamorph® software.
Automated image processing
Analysis of secondary ion signal intensities of SIMS images was performed with Metamorph Software (Molecular Devices). A 1:1 correspondence was established between the DIP Station and Metamorph analyses of the pure culture standard images by first generating a mass 27 and mass 26 composite image for each field of view analyzed using ImageJ (NIH). ROIs were determined by generating a segmented image with minimum and maximum region widths and heights of 2 and 10 pixels respectively at specific graylevels above a background intensity specific to each composite image. ROIs identified in composite images were transferred to corresponding mass 27 and mass 26 images to quantify average ROI pixel intensities. Field soil SIMS images and images from the pure culture experiments involving P. putida NCIB 9816-4 (wild-type) and P. putida NCIB 9816-4.C (cured of pDTG1) were analyzed in the same manner as the automated analysis of the pure culture 13C-glucose standards.
Acknowledgements
This research was supported by NIEHS grants 1-R21-ES012834 and 5-T32-ES00752-28 (to E.L.M.). Partial funding of Cornell SIMS Laboratory by Cornell Core Facilities (to S.C.) is also acknowledged.
References
- Behrens S, Lösekann T, Pett-Ridge J, Weber PK, Ng WO, Stevenson BS, Hutcheon ID, Relman DA, Spormann AM. Linking microbial phylogeny to metabolic activity at the single-cell level by using enhanced element labeling-catalyzed reporter deposition fluorescence in situ hybridization (EL-FISH) and NanoSIMS. Appl Environ Microbiol. 2008;74:3143–3150. doi: 10.1128/AEM.00191-08. [DOI] [PMC free article] [PubMed] [Google Scholar]
- Boschker HTS, Nold SC, Wellsbury P, Bos D, de Graaf W, Pel R, Parkes RJ, Cappenburg TE. Direct linking of microbial populations to specific biogeochemical processes by 13C-labelling of biomarkers. Nature. 1998;392:801–804. [Google Scholar]
- Buckley DH, Huangyutitham V, Hsu S-F, Nelson TA. Stable isotope probing achieved by disentangling the effects of genome G+C content and isotope enrichment on DNA density. Appl Environ Microbiol. 2006;73:3189–3295. doi: 10.1128/AEM.02609-06. [DOI] [PMC free article] [PubMed] [Google Scholar]
- Chandra S. Quantitative imaging of subcellular calcium stores in mammalian LLC-PK1 epithelial cells undergoing mitosis by SIMS ion microscopy. Eur. J. Cell Biol. 2005;84:783–797. doi: 10.1016/j.ejcb.2005.05.002. [DOI] [PubMed] [Google Scholar]
- Chandra S, Pumphrey G, Abraham JM, Madsen E.L. Madsen. Dynamic SIMS ion microscopy imaging of individual bacterial cells for studies of isotopically labeled molecules. Appl Surf Sci. 2008 (In press) [Google Scholar]
- Chandra S, Smith DR, Morrison GH. Subcellular imaging by dynamic SIMS ion microscopy. Anal Chem. 2000;72:104A–114A. doi: 10.1021/ac002716i. [DOI] [PubMed] [Google Scholar]
- Cliff JB, Gaspar DJ, Bottomley PJ, Myrold DD. Exploration of inorganic C and N assimilation by soil microbes with time-of-flight secondary ion mass spectrometry. Appl Environ Microbiol. 2002;68:4067–4073. doi: 10.1128/AEM.68.8.4067-4073.2002. [DOI] [PMC free article] [PubMed] [Google Scholar]
- Cliff JB, Jarman KH, Valentine NB, Golledge SL, Gaspar DJ, Wunschel DS, Wahl KL. Differentiation of spores of Bacillus subtilis grown in different media by elemental characterization using time-of-flight secondary ion mass spectrometry. Appl Environ Microbiol. 2005;71:6524–6530. doi: 10.1128/AEM.71.11.6524-6530.2005. [DOI] [PMC free article] [PubMed] [Google Scholar]
- DeRito CM, Pumphrey GM, Madsen EL. Use of field-based stable isotope probing to identify adapted populations and track carbon flow through a phenol-degrading soil microbial community. Appl Environ Microbiol. 2005;78:58–65. doi: 10.1128/AEM.71.12.7858-7865.2005. [DOI] [PMC free article] [PubMed] [Google Scholar]
- Herrmann AM, Clode PL, Fletcher IR, Nunan N, Stockdale EA, O'Donnell AG, Murphy DV. A novel method for the study of the biophysical interface in soils using nano-scale secondary ion mass spectrometry. Rapid Commun Mass Spectrom. 2007;21:29–34. doi: 10.1002/rcm.2811. [DOI] [PubMed] [Google Scholar]
- Huang WE, Griffiths RI, Thompson IP, Bailey MJ, Whiteley AS. Raman microscopic analysis of single microbial cells. Anal Chem. 2004;76:4452–4458. doi: 10.1021/ac049753k. [DOI] [PubMed] [Google Scholar]
- Huang WE, Stoecker K, Griffiths R, Newbold L, Daims H, Whiteley AS, Wagner M. Raman-FISH: combining stable-isotope Raman spectroscopy and fluorescence in situ hybridization for the single cell analysis of identity and function. Environ Microbiol. 2007;8:1878–1889. doi: 10.1111/j.1462-2920.2007.01352.x. [DOI] [PubMed] [Google Scholar]
- Jeon CO, Park W, Padmanabhan P, DeRito C, Snape JR, Madsen EL. Discovery of a bacterium, with distinctive dioxygenase, that is responsible for in situ biodegradation in contaminated sediment. Proc Natl Acad Sci USA. 2003;100:13591–13596. doi: 10.1073/pnas.1735529100. [DOI] [PMC free article] [PubMed] [Google Scholar]
- Kasai Y, Takahata Y, Manefield M, Watanabe K. RNA-based stable isotope probing and isolation of anaerobic benzene-degrading bacteria from gasoline-contaminated groundwater. Appl Environ Microbiol. 2006;72:3586–3592. doi: 10.1128/AEM.72.5.3586-3592.2006. [DOI] [PMC free article] [PubMed] [Google Scholar]
- Lechene C, Hillion F, McMahon G, Benson D, Kleinfield AM, Kampf JP, Distel D, Luyten Y, Bonventre J, Hentschel D, Park KM, Ito S, Schwartz M, Benichou G, Slodzian G. High-resolution quantitative imaging of mammalian and bacterial cells using stable isotope mass spectrometry. J Biol. 2006;5:20–49. doi: 10.1186/jbiol42. [DOI] [PMC free article] [PubMed] [Google Scholar]
- Lee N, Nielsen PH, Andreasen KH, Juretschko SJ, Nielsen L, Schleifer K-H, Wagner M. Combination of fluorescent in situ hybridization and microautoradiography—a new tool for structure-function analyses in microbial ecology. Appl Environ Microbiol. 1999;65:1289–1297. doi: 10.1128/aem.65.3.1289-1297.1999. [DOI] [PMC free article] [PubMed] [Google Scholar]
- Leigh MB, Pellizari V, Uhlík O, Sutka R, Rodrigues J, Ostrom NE, Zhou J, Tiedje JM. Biphenyl-utilizing bacteria and their functional genes in a pine root zone contaminated with polychlorinated biphenyls (PCBs) ISME Journal. 2007;1:134–148. doi: 10.1038/ismej.2007.26. [DOI] [PubMed] [Google Scholar]
- Li T, Wu TD, Mazéas L, Toffin L, Guerquin-Kern JL, Leblon G, Bouchez T. Simultaneous analysis of microbial identity and function using NanoSIMS. Environ Microbiol. 2008;10:580–588. doi: 10.1111/j.1462-2920.2007.01478.x. [DOI] [PMC free article] [PubMed] [Google Scholar]
- Liou JS-C, DeRito CM, Madsen EL. Field-based and laboratory stable isotope probing surveys of the identities of both aerobic and anaerobic benzene-metabolizing microorganisms in freshwater sediment. Environ. Microbiol. 2008;10:1964–1977. doi: 10.1111/j.1462-2920.2008.01612.x. [DOI] [PubMed] [Google Scholar]
- Lu Y, Conrad R. In situ stable isotope probing of methanogenic archaea in the rice rhizosphere. Science. 2005;309 doi: 10.1126/science.1113435. [DOI] [PubMed] [Google Scholar]
- Madsen EL. Identifying microorganisms responsible for ecologically significant biogeochemical processes. Nature Reviews Microbiology. 2005;3:439–446. doi: 10.1038/nrmicro1151. [DOI] [PubMed] [Google Scholar]
- Madsen EL. The use of stable isotope probing techniques in bioreactor and field studies on bioremediation. Curr Opin Biotechnol. 2006;17:92–97. doi: 10.1016/j.copbio.2005.12.004. [DOI] [PubMed] [Google Scholar]
- Manefield M, Whitely AS, Griffiths RI, Bailey MJ. RNA stable isotope probing, a novel means of linking community function to phylogeny. Appl Environ Microbiol. 2002;68:5367–5373. doi: 10.1128/AEM.68.11.5367-5373.2002. [DOI] [PMC free article] [PubMed] [Google Scholar]
- Moreau JW, Weber PK, Martin MC, Gilbert B, Hutcheon DI, Banfield JF. Extracellular proteins limit the dispersal of biogenic nanoparticles. Science. 2007;316:1600–1603. doi: 10.1126/science.1141064. [DOI] [PubMed] [Google Scholar]
- Morrison GH, Slodzian G. Ion microscopy. Anal. Chem. 1975;47:932A–943A. [Google Scholar]
- Neufeld JD, Vohra J, Dumont MG, Lueders T, Manefield M, Friedrich MW, Murrell JC. DNA stable-isotope probing. Nature Protocols. 2007;2:860–866. doi: 10.1038/nprot.2007.109. [DOI] [PubMed] [Google Scholar]
- Orphan VJ, House, CH, Hinrichs KU, McKeegan KD, DeLong EF. Methane-consuming archaea revealed by directly coupled isotopic and phylogenetic analysis. Science. 2001;293:484–487. doi: 10.1126/science.1061338. [DOI] [PubMed] [Google Scholar]
- Orphan VJ, House CH, Hinrichs KU, McKeegan KD, DeLong EF. Multiple archaeal groups mediate methane oxidation in anoxic cold seep sediments. Proc Natl Acad Sci U S A. 2002;99:7663–7668. doi: 10.1073/pnas.072210299. [DOI] [PMC free article] [PubMed] [Google Scholar]
- Ouverney CC, Fuhrman JA. Combined microautoradiography-16s rRNA probe technique for determination of radioisotope uptake by specific microbial cell types in situ. Appl Environ Microbiol. 1999;65:1746–1752. doi: 10.1128/aem.65.4.1746-1752.1999. [DOI] [PMC free article] [PubMed] [Google Scholar]
- Peteranderl R, Lechene C. Measure of carbon and nitrogen stable isotope ratios in cultured cells. J Am Soc Mass Spectrom. 2004;15:478–485. doi: 10.1016/j.jasms.2003.11.019. [DOI] [PubMed] [Google Scholar]
- Popa R, Weber PK, Pett-Ridge J, Finzi JA, Fallon SJ, Hutcheon ID, Nealson KH, Capone DG. Carbon and nitrogen fixation and metabolite exchange in and between individual cells of Anabaena oscillarioides. ISME J. 2007;1:354–360. doi: 10.1038/ismej.2007.44. [DOI] [PubMed] [Google Scholar]
- Pumphrey GM, Madsen EL. Field-based stable isotope probing reveals the identities of benzoic acid-metabolizing microorganisms and their in situ growth in agricultural soil. Appl Environ Microbiol. 2008;78:4111–4118. doi: 10.1128/AEM.00464-08. [DOI] [PMC free article] [PubMed] [Google Scholar]
- Radajewski S, Ineson P, Parekh NH, Murrell JC. Stable-isotope probing as a tool in microbial ecology. Nature. 2000;403:646–649. doi: 10.1038/35001054. [DOI] [PubMed] [Google Scholar]
- Serdar CM, Gibson DT. Isolation and characterization of altered plasmids in mutant strains of Pseudomonas putida NCIB 9816. Biochem Biophys Res Commun. 1989;164:764–771. doi: 10.1016/0006-291x(89)91525-8. [DOI] [PubMed] [Google Scholar]
- Stanier RY, Palleroni NJ, Doudoroff M. The aerobic pseudomonads: a taxonomic study. J Gen Microbiol. 1966;43:159–271. doi: 10.1099/00221287-43-2-159. [DOI] [PubMed] [Google Scholar]
- Stuart-Keil KG, Hohnstock AM, Drees KP, Herrick JB, Madsen EL. Plasmids responsible for horizontal transfer of naphthalene catabolism genes between bacteria at a coal tar-contaminated site are homologous to pDTG1 from Pseudomonas putida NCIB 9816-4. Appl Environ Microbiol. 1998;64:3633–3640. doi: 10.1128/aem.64.10.3633-3640.1998. [DOI] [PMC free article] [PubMed] [Google Scholar]
- Treude T, Orphan V, Knittel K, Gieseke A, House CH, Boetius A. Consumption of methane and CO2 by methanotrophic microbial mats from gas seeps of the anoxic Black Sea. Appl Environ Microbiol. 2007;73:2271–2283. doi: 10.1128/AEM.02685-06. [DOI] [PMC free article] [PubMed] [Google Scholar]
- Wagner M, Horn M, Daims H. Fluorescence in situ hybridization for the identification and characterisation of prokaryotes. Curr Opin Microbiol. 2003;6:302–309. doi: 10.1016/s1369-5274(03)00054-7. [DOI] [PubMed] [Google Scholar]
- Wagner M, Nielsen PH, Loy A, Nielsen JL, Daims H. Linking microbial community structure with function: fluorescence in situ hybridization-microautoradiography and isotope arrays. Curr Opin Biotechnol. 2006;17:83–91. doi: 10.1016/j.copbio.2005.12.006. [DOI] [PubMed] [Google Scholar]
- Whiteley AS, Thomson B, Lueders T, Manefield M. RNA stable isotope probing. Nature Protocols. 2007;2:838–844. doi: 10.1038/nprot.2007.115. [DOI] [PubMed] [Google Scholar]


