Abstract
We describe the use of Atomic Force Microscopy (AFM) to investigate the nanomechanical properties of Annulus Fibrosus (AF) - the outer fibrous layer of an Intervertebral Disc (IVD) encapsulating the inner jelly-like mass known as the nucleus pulposus (NP). Disk disease, degenerated discs, slipped discs, and herniated discs are common terms often linked to back pain and are caused due to degeneration of IVD. Due to the variations in the structure and biochemical composition of the IVD, studies of macromechanical properties in the motion segment or AF may lack all significant nanomechanical responses or behaviors. Existing studies do not report the micro or nano level of mechanics of IVD components and whether the nanomechanics of this tissue mimic its macromechanical behavior is not known. Our studies used AFM to investigate the regional micromechanical properties of the AF that have been otherwise difficult due to small sample size of the tissue. Five different zones including peripheral and central were tested mechanically as well as biochemically. Qualitative biochemical staining and quantitative values of nanomechanical properties of different zones are compared and discussed in detail. The results of nanomechanical investigations described in this study not only reveal its mimic at macroscopic level, they represent an important step towards establishing a framework for testing and comparing tissue engineered IVD replacements with native tissues.
Keywords: Atomic Force Microscopy, Annulus Fibrosus, Biomechanics, Spine, Hertz Model, Tissue Engineering, Modeling
Introduction
AFM offers a host of techniques including imaging of surface topography and recording of the amount of force felt by the cantilever as the probe tip approaches and contacts a sample surface and then pulls away. The reports on force measurement by AFM have continuously been flooding the literature that covers the long range attractive to repulsive forces between the probe tip and the sample surface, elucidating local interaction and mechanical properties, such as changes due to cytoskeletal changes (Wu HW 1998; Youreck G et al., 2007), elasticity (Rotsch C et al., 1997; Domke J. and Radmacher M, 1998), and even thickness of adsorbed molecular layers or bond rupture lengths (Wojcikiewicz EP et al., 2006; Eibl RH et al., 2005). Typically a Force curve records the deflection of the free end of the AFM cantilever as the fixed end of the cantilever is brought vertically towards and then away from the sample surface. The force acting on the sample is based on the principles of Hooke’s Law [F=kx, F: force, k: spring constant, x: displacement] where a cantilever acts as a mechanical spring.
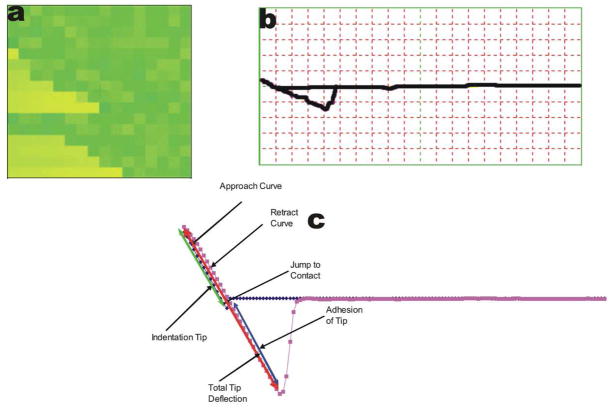
Another powerful feature of AFM measurement is Force volume imaging that can be used to investigate material, adhesive, electrical, magnetic and chemical properties of samples by recording an array of force curves over an entire area. A topographic image is also recorded with minimal damage to the surface. The information in the force volume can be decoupled from topographic data to offer new insight into material and surface properties. Sample force volume image and force plots are shown in Figure 1a–c.
Figure 1.
(a) shows a sample force-volume image obtained from the AFM software. Each pixilated square within the F-V image represents one force-distance curve. (b) A representative force plot from the chosen area used for analysis. (C) Sample force plot from AFM converted to excel file for analysis, this shows a hard sample with adhesion of the tip to the surface.
There are evidences of successful use of AFM in literature pertaining to topography imaging, force measurement and local micromechanical properties determination in orthopedics and related field of bone tissue engineering. It has been successfully used to image surface topography (Reilly et al 2001; Xu et al 2003), and mechanical properties of bone (Hengesburger et al 2002), dentin (Kinney et al 2003), appendicular skeleton articular cartilage (Jurvelin et al 1996) and mandibular cartilage (Patel et al 2003). AFM technology has also been used in studying hydrogels and composite gel systems (Ambrosio et al 1998; Gabrielii and Gatenholm 1997).
Thus far the mechanical properties of the intervertebral disc (IVD) have not been investigated using AFM technology. According to the American Academy of Orthopedic Surgeons, more than one million Americans were hospitalized due to back related injuries and more than 20 million saw their doctor because of backaches, in 2003. Of these reported cases more than 4 million were due to IVD injuries with the highest percent of injuries occurring between the ages of 19 and 70. The exact cause of low-back pain and degeneration of the spine is not fully understood. However, it is known and well established that the IVD plays a major role in sustaining the health of the spine and maintaining a healthy posture (Ashton-Miler and Schultz, 1997). Also, the IVD plays a fundamental role in the weight bearing capabilities of the entire skeleton. Degeneration or damage to the disc can lead to severe back pain and other debilitating disorders. Furthermore, in more severe cases of slipped disc and nerve root compression, there can be substantial amounts of spinal nerve root damage and possibly paralysis (Domisse and Louw 1990). A better understanding of the IVD and how it functions mechanically is important in prevention and repair of debilitating spinal disorders. A better understanding of the IVD requires a closer look at its components.
In this study we have used AFM to study nanomechanical properties of AF. For this purpose, AFM was used in contact mode to obtain topographic and force-volume images. Mechanical analysis of AF could be attained using the force-volume spectroscopy mode of the AFM scanner and the well-established Hertz Model, which was developed in 1882 to describe the relationships between surface indentation and elastic properties or stiffness of the sample (Radmacher 1997). It is based on the principle that stiffer materials will be less submissive to indentations and have less contact with the indenting surface. The Hertz model incorporates the indenter geometry, material properties of the sample investigated, and area of contact between indenter and sample into the analysis. Using the Hertz model to investigate biological samples requires two simplifications: infinite sample thickness and linear elasticity within sample region (Dimitiradis et al 2002). The use of the Hertz model is debatable when it comes to AFM scanning in biology due to the simplifications in the sample. However in the case of IVD samples where the sample (2–3 mm) appears infinitely thick compared to the tip (20 nm) this simplification is justified. Also it is assumed that the scanning regions are fairly homogenous over such a small sample size, in which case the Hertz model still holds value. These two simplifications become more important while scanning cells or thin films (Radmacher et al 1992; Dimitriadis et al 2002). Some investigators have modified the Hertz model to alleviate simplifications and incorporate different mechanical aspects of the sample under investigation (McElfresh et al 2002)
In this work we focused mainly on the nanomechanical properties of the Annulus fibrosus (AF). Specifically we aimed at i) nanomechanical properties estimation in terms of Young’s Modulus in different zones of AF ii) hydration test of the samples under AFM investigation and iii) histological examinations of the areas under investigation for a comparison of the AF nanomechanics that may lead to improved models to represent the IVD and its load capacity and enable zonal mechanical characteristics to be reproduced in artificial and tissue engineered IVD replacements. This demonstration of the ability of the AFM to provide high-resolution information on a sample’s mechanical and topographical properties and elucidation of the regional mechanical properties of the AF of the IVD was achieved using a rabbit model.
Materials and Methods
Sample Preparation
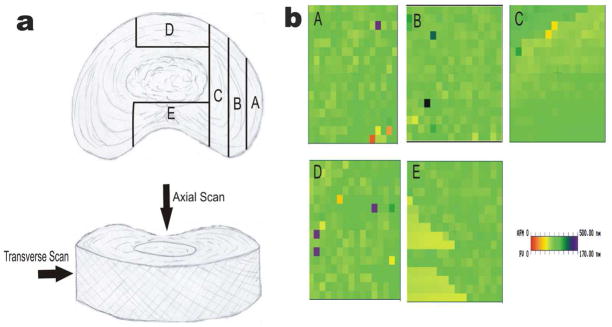
To mechanically probe tissue samples on a micron scale using the nano-indenter system of the AFM, the L4 and L5 vertebrae were dissected, within 15 min after euthanasia, from thirteen 8-week-old New Zealand White rabbits using an orthopedic saw (approved by the University of Illinois at Chicago, Animal Care Committee). Samples were cut from anterior to posterior. The L4-L5 IVD was isolated by gradually removing vertebral bone until the remaining L4 bone was approximately 1 mm thick. Under dissection microscope and with the L5 rigidly fixed in a vice, a sharp scalpel was used to cut the IVD at a level that was 1 mm inferior to L4. Five focal points were selected from 5 arbitrary regions of the AF for AFM scanning, labeled as A through E in Figure 2a. The left side of the disc was not scanned due to evidence from prior in-house experiments that suggested mirror attributes on left and right sides of the disc. Three additional micro dissections were made to allow access to transverse sections regions B and C. Dynamic nanoindentation in the axial direction (direction of spinal loading) and transverse direction (direction of pressure distribution) were applied to each focal point. Each dissected sample was mounted to a glass slide (5 mm diameter) via the L5 vertebral bone, which was further fixed to an AFM metal disc. The sample-disc assembly was then magnetically mounted to the AFM piezo scanner. During AFM scanning, average time 50 minutes, samples were irrigated with PBS.
Figure 2.
(a) Schematic drawing showing the regions of the Annulus Fibrosus within the IVD scanned with the AFM. Axial in direction of spinal loading and Transverse in direction of radial pressure distribution. (b) Force-Volume images representative of regions analyzed depicted as A through E. Although the topography of the samples varied widely, the F-V images showed little variations. Color coded F-V images shows the force measurement based on tip deflection. All graphs normalized to 170 nm.
AFM Scanning
Topography and force spectroscopy images were obtained in constant-force mode using an AFM (Nanoscope IIIa, Digital Instruments, Santa Barbara, CA) and oxide-sharpened Si3N cantilevers tips with minimal force spring constants of k =0.12 N/m. The radius of curvature of the tip was ~20 nm, and the scan size was 5 μm. For force spectroscopy imaging, regions scanned included both cells and matrix. The Young’s modulus for each site was measured using the Hertz model. A sample Force curve is shown in figure 1b and its dissection is depicted in figure 1c.
Data Analysis for AFM Scanning
Five regions from each force-volume image were analyzed and a representative force plot from each region was obtained. Representative regions are shown in Figure 2b. Indentation and deflection was obtained directly from the force plots in AFM Nanoscope software. Force was calculated using Hooke’s Law, equation 2. This information was placed in the Hertz Model equation, shown in equation 1, which was modified for calculation of Young’s Modulus. Roughness was calculated by Nanoscope IIIa software.
| (1) |
| (2) |
Variables for the equations are as follows: F: force, k: spring constant of the tip, d: deflection of the tip, E: Elastic Modulus, R: radius of curvature of the tip, v: Poisson’s ratio or Indentation Ratio, ∂: indentation of the sample.
Sample population was checked for normal distribution. The mean Young’s moduli of all focal points were subjected to analysis of variance (ANOVA) with Bonferroni adjustment using SPSS software. The alpha level was 0.05. Student T-tests were performed across axial and transverse scans using Microsoft Excel with an alpha level of 0.05.
Hydration Test
To determine the rates of dehydration within the sample and to determine regional water loss, samples were cut as described under sample preparation. In a separate experiment to measure the rate of water loss whole disc were soaked in Phosphate Buffered Saline (PBS) for a minimum of 4 hours. Samples were patted dry and allowed to sit in open air at 22° C for one hour. Next, dissected AF regions were soaked in PBS for a minimum of 4 hours, followed by exposure to open air at 22°C. Regions were sectioned as for AFM scanning. The specimens weight was recorded every 3 min for 1 hr. The amount of water loss was calculated as loss in mass over original mass. Percentage of weight loss from initial weight was determined for each trial. The drop in weight was presumed to be from water loss and was calculated as the percentage of weight loss within the tissue.
Data Analysis for Hydration Test
Initial weight measurements were taken as (Wo). The decrease in weight was determined as (Wo − wt) where (wt) was the weight at time (t). Water loss was calculated as shown in Equation 3.
| (3) |
The average of all trials was determined with standard deviation. All data sets were subject to analysis of variance (ANOVA) with Bonferroni adjustments using SPSS software. The alpha level was 0.05.
Histological Analysis
Histology study of the IVD samples was done according to an existing lab protocol. Freshly harvested samples were cleaned and rinsed in PBS and placed in a formalin solution. Prior to decalcification the specimens were rinsed with cold water for 26 hours. The specimens were then placed in a decalcifications solution for 7 days. After decalcification the specimens were then rinsed for 4 hours. After cleaning and embedding the samples in paraffin, the samples were cut at a thickness of 5μmm and mounted on slides. They were dipped in Xylene twice to remove the paraffin, and then rinsed in alcohol, 100%, 95%, and 70%. The samples were then placed in deionized water for 4 minutes, after which they were dipped in Fast Green stain, acetic acid, and finally Saffranin O. The rinse cycle was repeated in reverse order starting with 95% alcohol and ending with Xylene. Hematoxylin and Eosin staining followed a similar pattern. Slides were first cleaned with xylene and alcohol then rinsed with water. Slides remained in Hematoxylin for 6 minutes and were rinsed with water and alcohol. Finally slides were placed in Eosin for one minute and rinsed with alcohol and xylene. All products for staining were purchased from SIGMA scientific.
Results
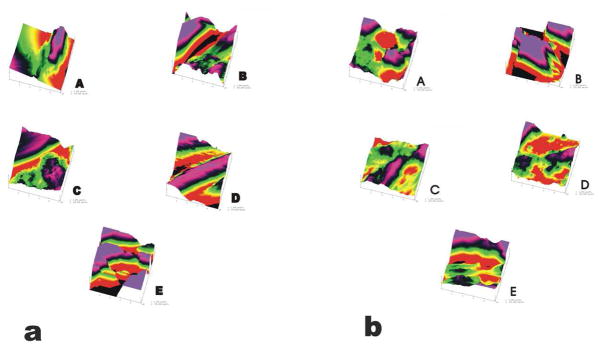
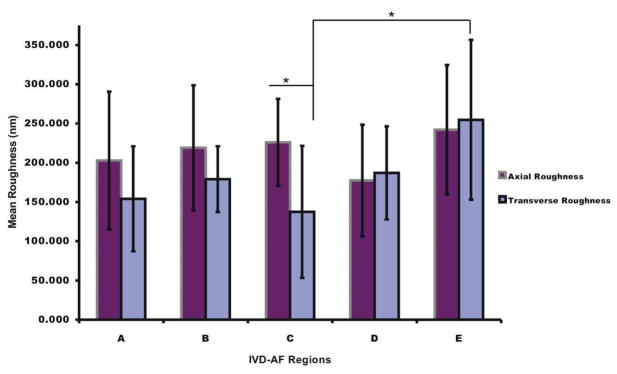
The topographic AFM images shown in Figure 3, showed differences in surface roughness between the regions investigated depicted as A through E. Transverse (Fig. 3b) and Axial (Fig. 3a) topographical scans showed no clear distinction between matrices and cells. Roughness Analysis shown in Figure 4 showed lower significance of differences across groups. ANOVA was done using alpha level of 0.05. Axial versus Transverse roughness varied to some degree, however a clear trend was not determined. All axial scans were performed on cut surfaces. For transverse scans only regions D, A, and E were intact tissue surfaces. Cut verses un-cut surface roughness did not seem to vary. Force spectroscopy data indicated that mechanical properties varied consistently between the regions investigated. Representative Force-Volume (F-V) images of the investigated regions are shown in Fig. 2b
Figure 3.
Reconstructed images from AFM raw data using Nanoscope IIIa software. Surface topographical analysis showed mainly rough surfaces. Details of scanning surfaces (cell or matrix) could not be distinguished in the reconstructed topographical images. Scan size 5×5 um. (a) Image gallery showing surface topography for axial scans of the regions A through E. (b) Image gallery showing surface topography for transverse scans of the regions A through E.
Figure 4.
Roughness analysis performed by Nanoscope IIIa software according to relationship between max height and max depth. Transverse roughness generally showed lower value as compared to axial roughness. ANOVA and Student-T test showed significant differences between axial and transverse roughness only in C region.
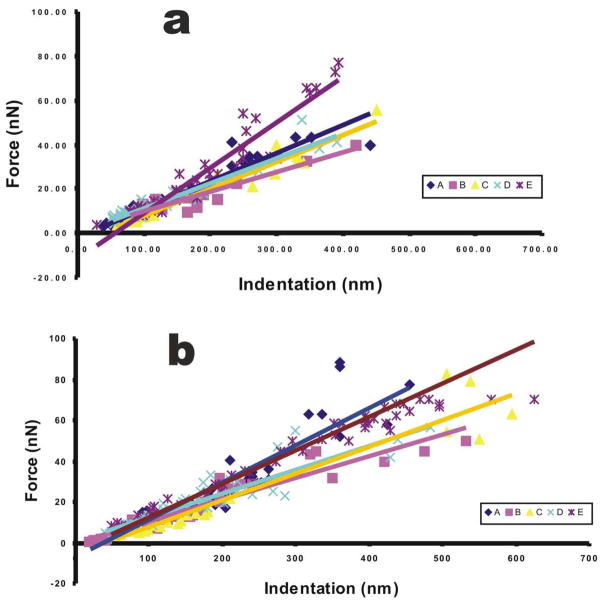
Force versus Indentation graphs were constructed from F-V images to determine the stiffness of the samples. Stiffness was measured as change in force (F) over change in Indentation (I) or slope of the graph. Samples with a smaller slope comparative to the others were considered less stiff. Stiffness tends to be a more generic measurement form. Stiffness does not take into account the geometry of the sample or the indenter used for analysis. Based on the curves in Figure 5a, stiffness for region E appears to be the greatest while regions A, B, C, and D appear to be relatively low for transverse analysis. Based on the curves in Figure 5b, stiffness for region E and A appears to be the highest and regions B and C the lowest for axial.
Figure 5.
Force vs. Indentation graphs for axial and transverse measurements. The slope of the line defines stiffness of the sample. (a) Graphs for transverse scans, all linear regression lines show r2 values of 0.85 or above. (b) Graphs for axial scans, all linear regression lines show r2 value of 0.83 or above.
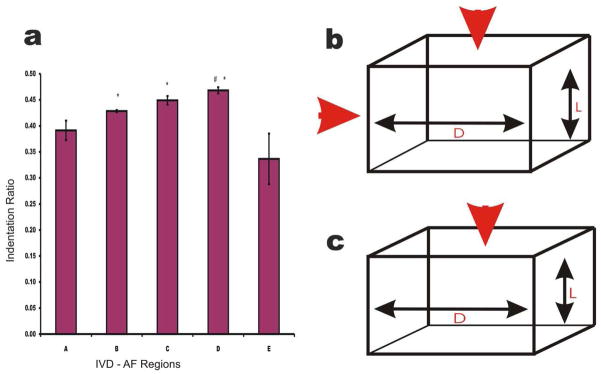
Initial experiments were done to determine the ratio of transverse to axial indentation for the sample, Indentation ratio (IR). It was initially presumed that this ratio resembled the Poisson’s ratio (PR) of the tissue. IR ranged from 0.33 –0.47. Figure 6 describes the trend and difference between the indentation ratios for IVD-AF regions. This was compared to physiologically relevant PR and it was found that the IR resembles the PR described for IVD (Shirazi et al, 1984). IR and PR are similar measurements; see Equation 4.
Figure 6.
(a) The ratio of transverse to axial indentation used as a semblance of the Poisson’s ratios. Region E showed the smallest ratio with transverse indentation being much lower than axial. In all cases transverse indentation showed less than half axial indentation. * denotes regions significantly different from region E, # denotes regions significantly different from region A, and ** denotes an alpha level below 0.01 (b) A diagram showing the measurement of indentation ratio. The red arrows represent forces applied to the sample. (c) A schematic diagram showing the measurement of Poisson’s ratio. Red arrow represents force applied to the sample.
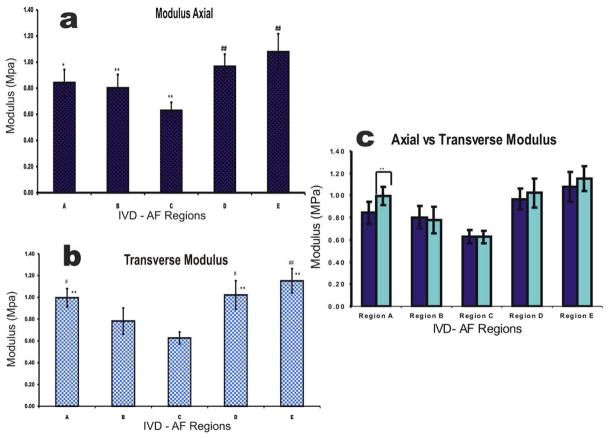
Based on Indentation ratio of the sample the Modulus was calculated using the Hertz model. These results are shown in Figure 7. The microscale Moduli of the AF of the rabbit IVD varied from the lowest 0.63±0.06 MPa for Region C, closest to the nucleus pulposus to the highest 1.08±0.14 MPa for Region E, the ventral side of the outer AF, in axial scans. Force spectroscopy data revealed that Region C was less stiff compared to the outer regions D, and E in axial probing. Transverse loading showed similar trends with region C (0.63±0.06 MPa) being significantly different from all regions except region B (1.15±0.11 MPa). The values obtained for the moduli were in the range of previously published values for cartilaginous tissue (Hu et al., 2001, Best et al., 1994, Klish and Lotz, 2000, Perie et al., 2005). The outer regions, from the final graph appear to be more isotropic in their mechanical properties, as can be seen comparing axial to transverse scans. However significant differences were found only for region A as shown in Figure 7c.
Figure 7.
(a) Plots showing the trend for Axial modulus calculated using the indentation ratio in the Hertz model equation. * denotes regions significantly different from region E, # denotes regions significantly different from region C, and ** or ## denotes an alpha level of below 0.01. (b) Plot showing trend for Transverse Modulus using the indentation ratio in the Hertz model equations. * denotes regions significantly different from region C, # denotes regions significantly different from region B and ** or ## denotes and alpha level of below 0.01. (c) Plot showing the trend between axial and transverse scans, * denotes difference between directions.
This modulus correlated well with the behavior of the force-indentation curves which showed region E to be the stiffer region. Further investigation lead to the use of a normalized PR. A literature search was done and an accepted PR from the literature was used and Young’s Modulus was calculated. Indentation Ratio and Poisson’s Ratio are related by the following equations.
| (4) |
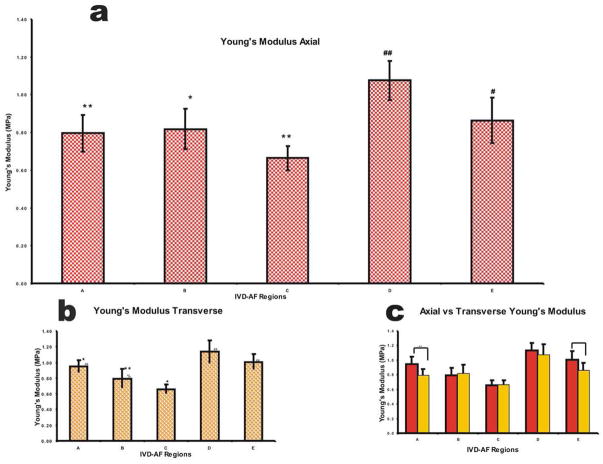
A Poisson’s ratio of 0.42 was used. This data is shown in Figure 8. It was found that region D (1.08±0.10 MPa) had the highest modulus and was significantly different from all regions except E (0.86±0.12 MPa) for axial scans, figure 8a. Region C (0.66±0.07 MPa) appeared to have the lowest Modulus and was significantly different from regions D and E. Regions A and B did not seem to differ and neither did regions D and E. Transverse scans showed a similar trend with region D (1.14±0.15 MPa) being the highest and region C (0.66±0.06 MPa) being the lowest, figure 8b. The comparison of modulus means from Axial to Transverse showed significance only between regions A. Region E showed a matching level of significance with alpha level slightly above 0.05, figure 8c. The outer regions were more anisotropic than the inner regions in their mechanical properties with regions A and E being the most anisotropic, where the axial modulus was about 80% of the transverse modulus. See figure 8. Compared to region C where there was barely any difference in axial versus transverse scans, no statistical difference was found between them.
Figure 8.
(a) Plot showing the trend for Axial Young’s modulus using an established Poisson’s Ratio in the Hertz model equation. * denotes regions significantly different from region D, # denotes regions significantly different from region C, and ** or ## denotes an alpha level of below 0.01. (b) Plot showing trend for Transverse Young’s modulus using the indentation ratio in the Hertz model equations. * denotes regions significantly different from region D, # denotes regions significantly different from region C, % denotes regions significantly different from E and ** or ## denotes and alpha level of below 0.01. (c) Plot showing the trend between axial and transverse scans * denotes difference between directions, ~ denotes region reasonably close to 0.05.
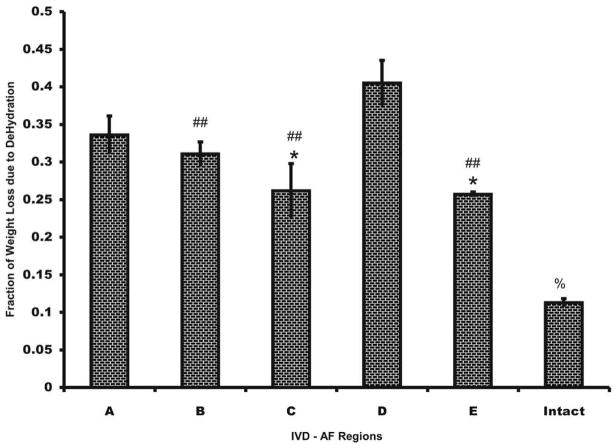
The pattern of one-hour water loss was similar to the distribution of Young’s moduli, in that generally greater water loss was experienced in outer regions as shown in Figure 9. The exception was region E where the amount of water loss was less compared to other outer regions. Region C lost the least amount of water mass over 1 hour of dehydration. Region E, whose percentage loss was similar to region C, showed an increased modulus. The trend for water loss due to dehydration for the tissue appears to be similar to the elastic modulus of the tissue.
Figure 9.
Fraction Hydration loss based on weight loss of the sample in open air. Water loss inversely relates to the amount of Proteoglycans (PG) within the tissue. ANOVA performed with an alpha level of (p<0.05) showed regions significantly different from region A denoted as *; regions significantly different from region D denoted as # and region significantly different from all other regions denoted as %. ## denotes an alpla level below 0.01.
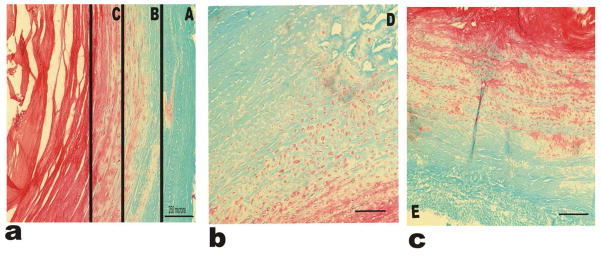
Histology showed Fast Green staining in the outer regions of the AF indicating little to no proteoglycans (PGs) present and intense orange staining in the nucleus pulposus (NP) indicating high PG content as shown in figure 10. There was light orange staining in the inner AF indicating some PGs were present in this region too. Staining with Fast Green indicated collagen fibers, which can be visualized within the tissue samples. These fibers were the densest in regions at the periphery.
Figure 10.
Histological analysis using Saffranin-Orange and Fast Green stains for the IVD-AF regions. (a) Shows regions A, B and C; (b) and (c) represent regions D and E respectively. Saffranin Orange stain binds to GAG chains in PGs. All sections show clear gradient behavior among the PG content within the tissue. Magnification used 10X.
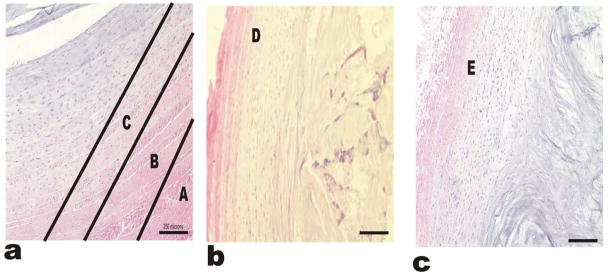
Glycosaminoglycans (GAGs) were present also throughout the tissue with the densest region being the inner portions and the NP. Hematoxylin and Eosin staining revealed a dense blue stain in the inner regions and a pink stain in the outer regions as shown in figure 11. All these regions are depicted as A through E in the galleries of images in figures 10 and 11. Striated structures could be found in the outer regions but were less apparent in the inner regions.
Figure 11.
Hemotoxylin and Eosin stains for the IVD-AF regions. Hematoxylin and Eosin stains bind to charged particles with in the tissue. The staining pattern of H and E resembles the pattern of Saf-O and Fast-G. The tissue appears to be more acidic in the inner regions compared to the outer regions likely due to the limited blood supply and hypoxic conditions of the inner AF. Image (a) shows A, B and C regions, while images (b) and (c) represent the regions D and E respectively.
Discussion
We chose five arbitrary regions of AF depicted as A through E (Figure-2) for nanomechanical and biochemical investigations using AFM and selective staining techniques. Here we compare and discuss our results on histology, nanomechanical properties and water content capability of AF region-wise.
Region A
This area is located on the outermost lateral portion of the AF. This region showed an intermediate values of Modulus (in Mpa) (0.84±0.10 Axial and 1.00±0.08 Transverse) and Young’s modulus (in Mpa) (0.80±0.10 Axial and 0.95±0.08 Transverse) compared to other regions. Saffranin-O Fast Green staining of the disc showed an intense green stain for this region indicating that this region has very few PGs. Because of its positioning, region A would be under large tensile stress and hoop stress caused by the pressure exerted by the NP during loading (Ebara et al. 1996). The collagen fibers in this region have been shown to be highly organized (Tsuji et al 1993) and this seems to be reflected on the histological analysis as fibers in this region seem to be more closely spaced. All these results further suggest anisotropic behavior and this notion is further supported by the fact that region A was the only region with significant differences in axial to transverse analysis. Here we found this region to have an intermediate amount of water loss ~35%. It seems that the concentration and high degree of organization of collagen fibers along with little to no PG’s, renders region A less porous and permeable.
Region B
Region B is positioned adjacent to region A, closer to the inner region of the AF. Region B showed mechanical properties similar to region A with a Modulus (in MPa) (0.80±0.10 Axial and 0.78±0.12 Transverse) and Young’s Modulus (in Mpa) (0.82±0.11 Axial and 0.79±0.12 Transverse). Region B based on F/I stiffness graphs (Figure 5) appeared to have the lowest stiffness in both axial and transverse direction. However modulus showed region B to be slightly higher compared to region C (Figure 7). Region B showed intermediate water loss compared to other regions and was slightly lower than region A (Figure 9). This corresponds with the histological analysis that showed more reddish stains in region B indicating the presence of more PGs (Figure 10). The presence of more PGs would indicate a more porous structure as PGs and collagen interact to create pores within the tissue matrix. The B region also showed a less intense green stain. This region did not show any significant differences between axial and transverse analysis.
Region C
Region C, positioned just outside the NP, showed the lowest Modulus (in Mpa) (0.63±0.06 Axial and 0.63±0.06 Transverse) and Young’s modulus (0.66±0.07 Axial and 0.66±0.06 Transverse). Region C also had a minimal amount of water loss. This correlates with the increase of PGs within the inner AF as shown by an increase of Saffranin Orange stain. The resistance to the removal of water from this region is due to high fixed charge density (FCD), which is greater due to the negatively charged GAG chains of the PGs. It has been shown previously that in the region of the AF surrounding the NP (corresponding to our region C) the collagen fibers are loosely oriented compared to outer regions. This corresponds well with histological findings that showed a loose fiber network in region C and little to no green stain (Figure 10). This random orientation of components also suggests a more isotropic behavior which corresponds well with the observation that axial to transverse Moduli in this region showed no difference. Region C lost the least amount of water mass over 1 hour of dehydration. It has been shown previously that greater PG content corresponds to an ability to retain water in cartilage (Best et al., 1994, Panagiotacopulos et al, 1987). These results would predict that region C has the highest PG content which is consistent with the histological findings in this study.
Region D
Region D is positioned at the dorsal side of the outer AF. Region D showed the varying properties with a Modulus (in Mpa) (0.97±0.09 Axial and 1.02±0.13 Transverse) and Young’s Modulus (in Mpa) (1.08±0.10 Axial and 1.14±0.15 Transverse). This region was significantly higher in Young’s Modulus values than that of regions A, B and C although not significantly higher than the other outer region E (Figure 8). Region D had the highest water loss indicating that it had the fewest PGs (Figure 9). However histological analysis showed PGs present that are comparable to region B (Figure 10). Thus there are few GAG chains to attract water molecules. However region D still lost more water. One explanation for this could be, region D is the thickest region within the rabbit IVD. This could imply that the collagen to PG ratio here may be higher than other areas. This would explain why, histological regions may be similar but biochemically they are different.
Region E
Region E is positioned on the ventral side of the outer AF. Region E showed varying properties including Modulus in (Mpa) (1.08±0.14 Axial and 1.15±0.11 Transverse) and Young’s Modulus (in Mpa) (0.86±0.12 Axial and 1.01±0.10 Transverse). Although no significance was found in transverse to axial modulus, there was a close significant difference found in Young’s Modulus with an alpha level slightly above 0.05 (Figure 8). Region E showed a similar amount of water loss to region C. While region E is on the outer most AF surface, it is a thin region and lies closer to the NP than other outer regions investigated. Therefore it is likely that the PG content of this region is higher when compared to other outer regions. Histology of the region showed red GAG staining more intensely than regions D and A (Figure 10). Although region C and E had similar water loss patterns (Figure 9), they differed significantly in modulus (Figure 7). This may be for mechanical balance as the NP will exert equal pressure on all sides; each side must be able to respond to this pressure. Therefore, it is suggested that region E is stiffer because it is thinner but must be able to withstand similar pressure from the NP and compressive forces as other regions. In addition, the collagen fiber structure and orientation in this region is denser and fibers run nearly perpendicular to other regions analyzed. Histological examination showed region C and region E have similar PG content based on Saffranin-Orange staining (Figure 10). However, region E appears to have more structured matrix organization which could account for the increase in Modulus.
These above findings as discussed region-wise suggest the contents of large PGs in Regions A through E relate well with the presently identified patterns of micromechanical and biochemical properties of the AF (Bruehlmann et al., 2002; Melrose et al. 2001). It has been reported that the large hydrodynamic size aggrecan-like PGs have an important role in providing the IVD with its unique hydrodynamic weight bearing properties (Houben et al 1997; Panagiotacopulos et al 1987). Patterns of hydration resemble patterns of Modulus and Young’s Modulus. It was evident in the correlation between the histology and the Young’s Modulus that the areas with more collagen had the highest modulus and the area with the highest proteoglycan content had the lowest modulus. This fact further supports the notion that it is the micro-components of the tissue that make up the bulk property response. It has been reported that tissue hydration has an effect on the mechanics of fibrocartilage and IVD tissue (Race et al., 2000; Iatridis et al., 1997). Although sample roughness varied (Figure 4), force plots seemed to be fairly smooth over the area scanned. Based on this data it was concluded that the roughness of the samples did not have positive or negative effects in the analysis of Young’s Modulus. There are two distinct differences between the indentation ratio and the Poisson’s ratio measurements. The indentation ratio is calculated as two separate forces of equal magnitude, fig. 6b. The deformations due to each force in axial and transverse directions are taken as independent measurements. In the case of scanning with AFM the probe is so small compared to the dimensions of the tissue being scanned that one could justify the use of this as a measurement over the Poisson’s ratio. In measuring the IR, a force applied in the axial direction makes almost no deformation in the transverse direction because the force is on a scale of nN. The Poisson’s ratio is a widely measured parameter in mechanical analysis of substrates. It is measured as the deformation in the axial and transverse direction due to a single force in the axial direction, fig. 6c. The PR measurement is an established material property. Due to the lack of deformation within the sample transversely from the axial force applied by the tip, one could argue that the PR is not a useful measurement. Furthermore, the IVD regions vary, but the PR was constant across regions.
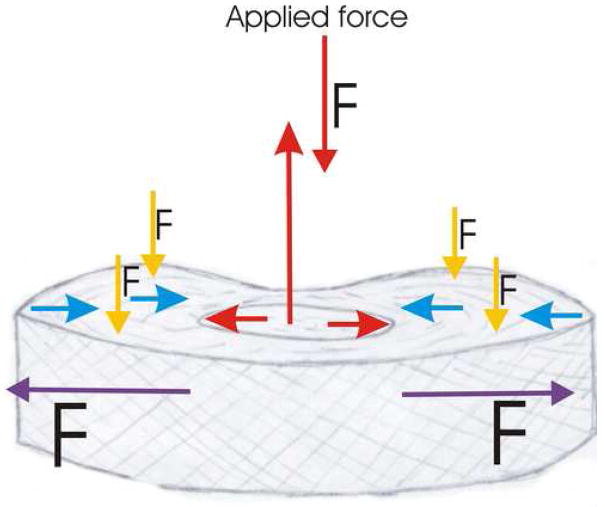
According to the Biphasic and Biphasic Poro-viscous-elastic Theory (Mow et al 1997), the fluid would flow easily out of the domain of the NP as it is a highly porous region of the IVD. As tissue porosity decreased towards the outer regions of the IVD, the rate of fluid flow would decrease due to the increasingly small pores thereby increasing organization of the collagen matrix with more and more collagen fibers. Also the PG’s will attract fluid back into the domain and cause development of a balancing pressure that will resist the applied force. Assuming that stiffness in the outer layers of the AF is directly related to the PG and collagen content, there would be larger drag forces experienced by the outer regions. The AF experiences a compressive force of about half of the total force exerted on the motion segment. Thus, there is only a small decrease in porosity due to compression in the AF region. A representative diagram depicting the stress occurring in the IVD due to applied uniaxial load is shown in Figure 12 (Nordin and Lindh 1990). The largest force acting in the AF is tensile. The AF will apply an equal and opposite force based on Newton’s 3rd law, but the applied force will not be equally distributed throughout the AF tissue. During loading, fluid within the domain of the NP will flow towards the periphery of the IVD-AF. However, the resistance to the removal of water from this region due to high FCD of negative GAG chains will cause an attraction of fluid. The mechanical differences described here relate more closely to the biphasic models than to the cylindrical model. These values also correspond to what would be expected based on the mechanical strains the IVD undergoes during loading. When a uniaxial compressive force is applied to the IVD, the NP distributes the force radially resulting in compressive and tensile forces on the AF (Fig. 12). In this way global compressive stresses will be absorbed with minimal stress transfer to the stiff vertebrae of the spine creating a shock absorbing system for the spine.
Figure 12.
The proposed representative diagram of the stresses and forces occurring in the IVD in case of a single uniaxial load. The NP applies a compressive force in the opposite direction up to 1.5 times that of the original force. The NP also redistributes forces radially (red arrows). The radial force gets counterbalanced by the AF (blue arrows). The outer regions of the AF experience large tensile and hoop stresses up to five times the applied force (purple arrows). The AF also experiences a small compressive force up to 0.5 times smaller than the applied force (yellow arrows). Nordin and Lindh, 1990.
Using atomic force microscopy it was found that localized IVD micromechanical properties are mimicked on a macroscopic level. Also these mechanical variations correspond with histology and dehydration ability of the tissue. The peripheral regions are stiffer, less able to retain water and richer in collagen while areas close to the NP are richer in proteoglycans, softer and better able to retain water. The values of Young’s Modulus for AF tissue, calculated using AFM are in the range of 0.6–1.2 MPa. These fall within the range of IVD moduli predicted in the literature (Table I). The values for the micro Young’s Modulus here resemble more closely to the compressive aggregate modulus described by previous researchers (see Table I). Due to the fact that the tissue is not isolated and the scanning area is surrounded completely by other tissue, it is expected that the micro Young’s Modulus calculated would have this property. Here we found regional variations similar to those found in other experiment (refer to Table I). Inner regions were less stiff compared to outer regions. There were no differences in posterior and anterior measurements for Moduli.
Table I.
Values for Mechanical Properties of the IVD and other Cartilage Tissue as reported in literatures.
| Investigator | Material Property | Reported Value | Tissue Analyzed |
|---|---|---|---|
| Benjamin and Evans, 1990 | Tensile Modulus | ~10MPa | Fibrocartilage |
| Benjamin and Evans, 1990 | Tensile Modulus | ~4MPa | Hyaline cartilage |
| Benjamin and Evans 1990 | Tensile Modulus | ~55MPa | Tendon |
| Skaggs et al., 1994 | Tensile Modulus | ~59–136 MPa | AF |
| Iatridis et al.,1999 | Shear Modulus | ~100–400 kPa | AF |
| Best et al., 1994 | Compressive Aggregate Modulus | ~0.27–0.44MPa | AF |
| Houben et al., 1997 | Aggregate Modulus | ~1.31–1.56 MPa | AF |
| Shirazi-ADL et al., 1984 | Young’s (Elastic) Modulus | ~4.2 MPa | AF |
| Umehara et al., 1996 | Elastic Modulus | ~75.8–110.7 kPa | AF |
| Hu et al., 2001 | Young’s Modulus | ~0.95–2.34 MPa | Fibrocartilage |
| Klisch and Lotz, 2000 | Aggregate Modulus | ~0.116 MPa | AF |
| Best et al. 1999 | Aggregate Modulus | ~0.56 MPa | AF |
| Perie et al., 2005 | Compressive Modulus | ~0.75 MPa | AF |
Here we found significant differences in nanomechanical properties of IVD matrices between the regions (A, B, C, D, and E) of the AF in both axial and transverse directions. Transverse directions appear to have a more complex mechanical environment. As can be seen from the data these values in terms of Young’s Modulus in transverse direction showed difference between region A and C, whereas axial analysis did not show any significant difference. This indicates that AF’s macroscale anisotropic and non-linear properties are reflected at the nanomechanical scale as well. It was also suggested by the data that the anisotropic behavior of the tissue exhibits a gradient behavior. Data showed inner regions to be fairly similar in modulus but regions E and A showed differences in axial vs. transverse measurement. Variations within IVD micromechanical behavior correlated with the tissues water imbibing ability and PG content. This regional difference in mechanical behavior and biochemical content may reflect difference in mechanical environment. The mechanical behavior of a tissue generally reflects the type of load the tissue must bear. Thus simplified models of the IVD may not fully reflect the actual tissue behavior. Additionally, mechanically homogenous replacements and treatments, such as spinal fusions and prosthetic IVD replacements, will not provide the mechanical stability needed to prevent further degeneration of other components in the spine. Tissue engineered joint replacements may alleviate some of these problems.
The present data have implications in the design of intervertebral discs replacements using biocompatible polymers with or without cells. A more complex design incorporating the variations in regional properties will likely function better and last longer than current IVD replacements. The design of biopolymers for tissue engineering of the AF with mechanically stable properties offers a promising solution. In the most serious cases of lower back pain the complete IVD structure must be removed or replaced. Many of these replacements are mechanically homogenous, which may cause detrimental load redistribution to other regions of the spine. An improvement in the mechanical material properties may lead to a more productive rehabilitation in patients and possible regeneration of tissue structures as replacements.
There are some limitations to this study such as (a) all cuts to separate regions were made based on visible anatomical features, however due to animal variation these regions could not be exactly of the same dimensions. Therefore scanning points were not precisely replicated between samples however they were consistent within a region that only varied sample to sample by ~0.3mm and (b) The AFM video system has limited image resolution, thus it could not be determined if the scanning area consisted of cell surface, collagen fibers, or PGs. Therefore the values for Young’s modulus we report most likely represent a mixture of cell and matrix stiffness values.
The design of biopolymers for tissue engineering of the AF with mechanically stable properties offers a solution to the mechanical inferiority of some replacements. Also, improvement in the mechanical material properties may lead to a more productive rehabilitation in patients and possible regeneration of tissue structures as replacements. Therefore mechanically modeling natural tissue structure and finding substitutes is very important. The present study is a progressive step towards defining the mechanical properties and defining possible ways to test alternative IVD replacement system in order to compare them to the native tissue. The use of nanotechnology tools viz. AFM can lead to a more detailed analysis while nanofabrication can lead to reproduction of microstructure.
Acknowledgments
We acknowledge financial supports from Grants DE15391 and EB02332. We also thankfully acknowledge Dr. M.A. Kabir for helpful discussion and critical reading of the manuscript.
Footnotes
Publisher's Disclaimer: This is a PDF file of an unedited manuscript that has been accepted for publication. As a service to our customers we are providing this early version of the manuscript. The manuscript will undergo copyediting, typesetting, and review of the resulting proof before it is published in its final citable form. Please note that during the production process errors may be discovered which could affect the content, and all legal disclaimers that apply to the journal pertain.
Contributor Information
Naama T. Lewis, Department of Bioengineering, University of Illinois at Chicago, Science and Engineering Offices (SEO), room 218, 815 S. Morgan Street (m/c 063), Chicago, IL 60607-7052, USA, Email: nlewis2@uic.edu.
Mohammad A. Hussain, Department of Biotechnology, P.A. College of Engineering, Nadupadav, Kairangala, Mangalore-574 153, INDIA, Email: abujuveria@gmail.com
Jeremy J. Mao, Department of Biomedical Engineering, Fu Foundation School of Engineering and Applied Sciences, College of Medicine, Columbia University, 630 W. 168 St. – PH7 East CDM, New York, NY-10032, USA, Email: jmao@columbia.edu
References
- Ambrosio L, De Santis R, Nicolais L. Composite Hydrogels for Implants. Proc Instn Mechanical Engineers. 1998;212(H):93–99. doi: 10.1243/0954411981533863. [DOI] [PubMed] [Google Scholar]
- Ashton-Miller JA, Schultz AB. Biomechanics of the Human Spine. In: Mow VC, Hayes WC, editors. Basic Orthopaedic Biomechanics. 2. Lippincott-Raven Publishers; Philadelphia, PA: 1997. pp. 353–385. [Google Scholar]
- Benjamin M, Evans EJ. Research Review: Fibrocartilage. Journal of Anatomy. 1990;171:1–15. [PMC free article] [PubMed] [Google Scholar]
- Best BA, Guilak F, Setton LA, Zhu W, Saed-Nejad F, Ratcliffe A, Weidenbaum M, Mow VC. Compressive mechanical Properties of the Human Anulus Fibrosus and Their Relationship to Biochemical Composition. Spine. 1994;19(2):212–221. doi: 10.1097/00007632-199401001-00017. [DOI] [PubMed] [Google Scholar]
- Bruehlmann SB, Rattner JB, Duncan NA. Regional Variations in the Cellular Matrix of the Annulus Fibrosus of the Intervertebral Disc. Journal of Anatomy. 2002;201:159–171. doi: 10.1046/j.1469-7580.2002.00080.x. [DOI] [PMC free article] [PubMed] [Google Scholar]
- Dimitriadis E, Horkay F, Kachar B, Chadwick RS. Determination of Elastic Moduli of Thin Layers of Soft Material Using the Atomic Force Microscope. Biophysical Journal. 2002;82:2789–2810. doi: 10.1016/S0006-3495(02)75620-8. [DOI] [PMC free article] [PubMed] [Google Scholar]
- Dommisse G, Louw J. Anatomy of the Lumbar Spine. In: Flowman Y, editor. Disorders of the Lumbar Spine. Freund Publishing House Ltd, Aspen Publishers. Tel Aviv; Israel, Rockville, MD: 1990. pp. 1–23. [Google Scholar]
- Ebara S, Iatridis JC, Setton LA, Foster RJ, Mow VC, Weidenbaus M. Tensile Properties of Nondegenerate Human Lumbar Anulus Fibrosus. Spine. 1996;21(4):452–461. doi: 10.1097/00007632-199602150-00009. [DOI] [PubMed] [Google Scholar]
- Eibl RH, Moy VT. Atomic force microscopy measurements of protein-ligand interactions on living cells. Methods Mol Biol. 2005;305:439–50. doi: 10.1385/1-59259-912-5:439. [DOI] [PubMed] [Google Scholar]
- Gabrielii I, Gatenholm P. Preparation and Properties of Hydrogels Based on Hemicellulose. Journal of Applied Polymer Science. 1998;69:1661–1667. [Google Scholar]
- Hengsburger S, Kulik A, Zyssett P. Nanoindentation Discriminates the Elastic Properties of Individual Human Bone Lamellae Under Dry and Physiological Conditions. Bone. 2002;30(1):178–184. doi: 10.1016/s8756-3282(01)00624-x. [DOI] [PubMed] [Google Scholar]
- Houben GB, Drost MR, Huyghe JM, Janssen JD, Huson A. Nonhomogeneous Permeability of Canine Annulus Fibrosus. Spine. 1997;22(1):7–16. doi: 10.1097/00007632-199701010-00003. [DOI] [PubMed] [Google Scholar]
- Hu K, Radhakrishnan P, Patel RV, Mao JJ. Regional Structural and Viscoelastic Properties of Fibrocartilage upon Dynamic Nanoindentation of the Articular Condyle. Journal of Structural Biology. 2001;136:46–52. doi: 10.1006/jsbi.2001.4417. [DOI] [PubMed] [Google Scholar]
- Iatridis JC, Kumar S, Foster RJ, Weidenbaum M, Mow VC. Shear Mechanical Properties of Human Lumbar Annulus Fibrosus. Journal of Orthopaedic Research. 1999;17:732–737. doi: 10.1002/jor.1100170517. [DOI] [PubMed] [Google Scholar]
- Iatridis JC, Setton LA, Weidenbaum M, Mow VC. The Viscoelastic Behavior of the Non-Degenerate Human Lumbar Nucleus Pulposus in Shear. Journal of Biomechanics. 1997;30(10):1005–1013. doi: 10.1016/s0021-9290(97)00069-9. [DOI] [PubMed] [Google Scholar]
- Domke J, Radmacher M. Measuring the Elastic Properties of Thin Polymer Films with the Atomic Force Microscope. Langmuir. 1998;14:3320–3325. [Google Scholar]
- Jurvelin JS, Muller DJ, Wong M, Studer D, Engel A, Hunziker EB. Surface and Subsurface Morphology of Bovine Humeral Articular Cartilage as Assessed by Atomic Force and Transmission Electron Microscopy. Journal of Structural Biology. 1996;117:45–54. doi: 10.1006/jsbi.1996.0068. [DOI] [PubMed] [Google Scholar]
- Kinney JH, Habelitz S, Marshall SJ, Marshall GW. The Importance of Intrafibrillar Mineralization of Collagen on the Mechanical Properties of Dentin. Journal of Dental Research. 2003;82(12):957–961. doi: 10.1177/154405910308201204. [DOI] [PubMed] [Google Scholar]
- Klisch S, Lotz J. A Special Theory of Biphasic Mixtures and Experimental Results of Human Annulus Fibrosus Tested in Confined Compression. Journal of Biomechanical Engineering. 2000;122(2):180–188. doi: 10.1115/1.429640. [DOI] [PubMed] [Google Scholar]
- McElfresh M, Baesu E, Balhorn R, Belak J, Allen MJ, Rudd RE. Combining Constitutive Materials Modeling with Atomic Force Microscopy to Understand the Mechanical Properties of Living Cells. PNAS. 2002;99(suppl 2):6493–6497. doi: 10.1073/pnas.082520599. [DOI] [PMC free article] [PubMed] [Google Scholar]
- Melrose J, Ghosh P, Taylor TK. A Comparative Analysis of the Differential Spatial and Temporal Distributions of the Large (Aggrecan, Versican) and Small (Decorin, Biglycan, Fibromodulin) Proteoglycans of the Intervertebral Disc. Journal of Anatomy. 2001;198:3–15. doi: 10.1046/j.1469-7580.2001.19810003.x. [DOI] [PMC free article] [PubMed] [Google Scholar]
- Mow VC, Ratcliffe A. Structure and Function of Articular Cartilage and Meniscus. In: Mow VC, Hayes WC, editors. Basic Orthopaedic Biomechanics. 2. Lippincott-Raven Publishers; Philadelphia, PA: 1997. pp. 113–177. [Google Scholar]
- Nordin M, Lindh M. Biomechanics of the Lumbar Spine. In: Flowman Y, editor. Disorders of the Lumbar Spine. Freund Publishing House Ltd, Aspen Publishers. Tel Aviv; Israel, Rockville, MD: 1990. pp. 25–52. [Google Scholar]
- Panagiotacopulos ND, Pope MH, Bloch R, Krag MH. Water Content in Human Intervertebral Discs: Part II Viscoelastic Behavior. Spine. 1987;12(9):918–924. doi: 10.1097/00007632-198711000-00013. [DOI] [PubMed] [Google Scholar]
- Patel R, Mao JJ. Microstructural and Elastic Properties of the Extracellular Matrices of the Superficial Zone of Neonatal Articular Cartilage by Atomic Force Microscopy. Frontier Bioscience. 2003;1(8):18–25. doi: 10.2741/932. [DOI] [PubMed] [Google Scholar]
- Perie D, Korda D, Iatridis JC. Confined Compression Experiments on Bovine Nucleus Pulposus and Annulus Fibrosus: Sensitivity of the Experiment in the Determination of Compressive Modulus and Hydraulic Permeability. Journal of Biomechanics. 2004;38:2164–2171. doi: 10.1016/j.jbiomech.2004.10.002. [DOI] [PubMed] [Google Scholar]
- Race A, Broom ND, Robertson P. Effect of Loading Rate and Hydration on the Mechanical Properties of the Disc. Spine. 2000;25(6):662–669. doi: 10.1097/00007632-200003150-00003. [DOI] [PubMed] [Google Scholar]
- Radmacher M, Tillmann RW, Fritz M, Guab HE. From Molecules to Cells: Imaging Soft Samples with the Atomic Force Microscope. Science. 1992;257:1900–1905. doi: 10.1126/science.1411505. [DOI] [PubMed] [Google Scholar]
- Radmacher M. Measuring the Elastic Properties of Biological Samples with the AFM. IEEE Engineering in Medicine and Biology. 1997 March/April;:47–57. doi: 10.1109/51.582176. [DOI] [PubMed] [Google Scholar]
- Reilly GC, Knapp HF, Stemmer A, Neiderer P, Knothe-Tate ML. Investigation of the Morphology of the Lacunocanalicular System of Cortical Bone Using Atomic Force Microscopy. Annals of Biomedical Engineering. 2001;29(12):1074–1081. doi: 10.1114/1.1424910. [DOI] [PubMed] [Google Scholar]
- Rotsch C, Braet F, Wisse E, Radmacher M. AFM imaging and elasticity measurements on living rat liver macrophages. Cell Biol Int. 1997 Nov;21(11):685–96. doi: 10.1006/cbir.1997.0213. [DOI] [PubMed] [Google Scholar]
- Shirazi-Adl SA, Shrivastava SC, Ahmed AM. Stress Analysis of the Lumbar Disc-body Unit in Compression: A Three-Dimensional Nonlinear finite Element Study. Spine. 1984;9(2):120–134. doi: 10.1097/00007632-198403000-00003. [DOI] [PubMed] [Google Scholar]
- Skaggs DL, Weidenbaum M, Iatridis JC, Ratcliffe A, Mow VC. Regional Variation in Tensile Properties and Biochemical Composition of the Human Lumbar Anulus Fibrosus. Spine. 1994;19(12):1310–1319. doi: 10.1097/00007632-199406000-00002. [DOI] [PubMed] [Google Scholar]
- Tsuji H, Hirano N, Ohshima H, Terahata N, Motoe T. Structural Variation of the Anterior and Posterior Anulus Fibrosus in the Development of Human Lumbar Intervertebral Disc: A Risk Factor for Intervertebral Disc Rupture. Spine. 1993;18(2):204–210. [PubMed] [Google Scholar]
- Umehara S, Tadano S, Abumi K, Katagiri K, Kaneda K, Ukai T. Effects of Degeneration on the Elastic Modulus Distribution in Lumbar Intervertebral Disc. Spine. 1996;21(7):811–819. doi: 10.1097/00007632-199604010-00007. [DOI] [PubMed] [Google Scholar]
- Wojcikiewicz EP, Abdulreda MH, Zhang X, Moy VT. Force spectroscopy of LFA-1 and its ligands, ICAM-1 and ICAM-2. Biomacromolecules Nov. 2006;7(11):3188–95. doi: 10.1021/bm060559c. [DOI] [PMC free article] [PubMed] [Google Scholar]
- Wu HW, Kuhn T, Moy VT. Mechanical properties of L929 cells measured by atomic force microscopy: effects of anticytoskeletal drugs and membrane crosslinking. Scanning. (5) 1998 Aug;20:389–97. doi: 10.1002/sca.1998.4950200504. [DOI] [PubMed] [Google Scholar]
- Xu T, Fu R, Yan L. A New Insight into the Adsorption of Bovine Serum Albumin onto Porous Polyethylene Membrane by Zeta Potential Measurements, FTIR Analysis, and AFM Observations. Journal of Colloid Interface Science. 2003;262(2):342–350. doi: 10.1016/S0021-9797(03)00208-X. [DOI] [PubMed] [Google Scholar]
- Youreck G, Hussain MA, Mao JJ. Cytoskeletal changes of Mesenchymal Stem Cells during differentiation. Tissue Engineering ASAIO Journal. 2007;53:219–228. doi: 10.1097/MAT.0b013e31802deb2d. [DOI] [PMC free article] [PubMed] [Google Scholar]


