

Abstract
Intercellular adhesion molecule-1 (ICAM-1) and vascular cell adhesion molecule-1 (VCAM-1) may be important contributors to the development and progression of atherosclerosis. Using a stratified random sample of 2,880 participants of the Multi-Ethnic Study of Atherosclerosis we investigated the relationship of 12 ICAM1 and 17 VCAM1 SNPs and coronary artery calcium (CAC) and ICAM1 SNPs and circulating levels of soluble ICAM-1 (sICAM-1). There were no ICAM1 or VCAM1 SNPs significantly associated with CAC in any of the four race/ethnic groups. In a subset of 1,451 subjects with sICAM-1 measurements, we observed a significant association with rs5491 in all four race/ethnic groups corroborating previous research that has shown that the T-allele of rs5491 interferes with the monoclonal antibody used to measure sICAM-1 in this study. After excluding all rs5491 T-allele carriers, several ICAM1 SNPs were significantly associated with sICAM-1 levels; rs5496 in African Americans, rs5498 and rs3093030 in European Americans, and rs1799969 in Hispanics. Our results identified ICAM1 polymorphisms that were significantly associated with sICAM-1 level but not CAC, a subclinical marker of atherosclerosis.
Keywords: coronary artery calcium, intercellular adhesion molecule-1 (ICAM-1), vascular adhesion molecule-1 (VCAM-1), soluble intercellular adhesion molecule-1 (sICAM-1), gene, single nucleotide polymorphism (SNP), haplotypes
Introduction
Intercellular adhesion molecules 1 & 2 (ICAM-1, ICAM-2) and vascular cell adhesion molecule 1 (VCAM-1) are members of the immunoglobin family. Interactions between these cellular adhesion molecules (CAMs) and activated receptors on the leukocytes result in firm adhesion and transmigration of leukocytes into the basement membrane of the vasculature. Platelets, leukocytes, and endothelial cells that depend on adhesion molecules link the processes of hemostasis, thrombosis, and inflammation1. As these factors have been identified as biological mechanisms leading to cardiovascular disease (CVD)2, CAMs may be important contributors to the development and progression of atherosclerosis disease.
Soluble ICAM-1 (sICAM-1) and VCAM-1 (sVCAM-1) levels have been associated with CVD in epidemiologic studies, albeit less consistently for sVCAM-1. The Atherosclerosis Risk in Communities (ARIC) study reported the odds ratios of coronary heart disease (CHD) and carotid artery atherosclerosis were 5.5 and 2.6 respectively, for those with levels of sICAM-1 in the highest quartile compared with those in the lowest quartile3. The Women's Health Study found a relative risk (RR) of 2.6 for cardiovascular events for women in the highest quartile of sICAM-1 levels compared to lowest4. Using a nested case-control design in the Physicians Health Study, Ridker and colleagues found a significant association between increasing sICAM-1 levels and future risk of myocardial infarction in men. Furthermore, they reported a multivariate adjusted RR of 1.8 for myocardial infarction in participants whose baseline sICAM-1 levels were in the highest quartile compared to the lowest5.
Despite evidence linking CVD to sICAM-1, and to a lesser extent sVCAM-1, questions remain about the genetics of these inflammation mediators. Polymorphisms within the ICAM1 structural gene have been shown to influence circulating levels of sICAM-1. The extent that ICAM1 and VCAM1 polymorphisms influence the development of atherosclerosis, however, is unknown. For this analysis, we hypothesize that variations within the ICAM1 and VCAM1 genes are associated with coronary artery calcium (CAC), a marker of atherosclerosis, and that circulating levels of sICAM-1 are influenced by polymorphisms within the ICAM1 gene.
Subjects and Methods
Subjects
The Multi-Ethnic Study of Atherosclerosis (MESA) enrolled 6,814 participants from 2000-2002 without existing clinical cardiovascular disease who were aged 45-85. This study population included 38% European Americans (EUA), 28% African Americans (AFA), 22% Hispanic (HIS), and 12 % Chinese (CHN). MESA participants were examined at one of six field centers located in Baltimore, MD, Chicago, IL, Forsyth County, NC, Los Angeles County, CA, northern Manhattan, NY, and Saint Paul, MN. The MESA study has been described in detail elsewhere8. A stratified random sample of 2,880 MESA participants (720 of each race/ethnicity) was selected from those who gave informed consent for DNA extraction and genetic sub-study and had DNA samples available. Thirty three of the 2,880 participants were excluded due to an inability to be genotyped or laboratory validity issues. We further excluded 3 samples, 1 Chinese and 2 Hispanics, from field centers that did not actively recruit these two ethnic groups. The final analysis sample size was 2,844.
Measurements
Circulating levels of sICAM-1 were measured in the first one third of those enrolled in MESA and in others who were randomly selected from among the first 5,030 participants enrolled. SICAM-1 was measured at baseline in plasma by ELISA (Parameter Human sICAM-1 Immunoassay; R&D Systems, Minneapolis, MN) at the Laboratory for Clinical Biochemistry Research, University of Vermont in Burlington. The coefficient of variation (CV) for the assay was 5.0%, with a minimum detectable level of < 0.35 ng/mL. Computed tomography of the coronary arteries was performed at visit 1, as has been previously described9. At three of six clinical centers, electron beam scanners (Imatron C-150; Imatron, Inc., San Francisco, CA) were used with cardiac-gating at 80% of the R-R interval. At the other three centers, a prospective electrocardiogram-triggered multi-dector scan was acquired at 50 percent of the R-R interval. All scanners were comparable in their ability to measure calcium9. Scans were read centrally at Harbor-University of California Medical Center (Los Angeles, CA), and Agatston coronary artery calcium (CAC) scores were quantified by blinded CT image analysts. Current smoking and alcoholic intake were assessed via questionnaire at baseline.
Genotyping
DNA was extracted from peripheral leukocytes isolated from packed cells in anticoagulated blood using a commercially available DNA isolation kit (Puregene; Gentra Systems, Minneapolis, MN). The DNA was quantified by determination of absorbance at 260 nm followed by PicoGreen analysis (Molecular Probes, Inc., Eugene, OR). DNA was stored per participant at -70 degrees centigrade and subsequently aliquoted for use.
Single nucleotide polymorphisms (SNPs) were selected in candidate gene loci according to the following criteria: (1) within the proximal and distal 10 kb regions 5′ and 3′ to the given candidate gene (NCBI Build 35); (2) compatibility with the Illumina GoldenGate technology 10,11 as determined by the Assay Design Tool (TechSupport, Illumina, San Diego, CA); (3) minor allele frequency (MAF) ≥0.05 or a tag (r2 value ≥0.8) for another SNP with MAF≥0.05 as determined by applying the multilocus or “aggressive” “Tagger” option of Haploview v3 12,13 based on the International HapMap14 project data for CEPH and Yoruban populations (release 19). Genotyping was performed by Illumina Genotyping Services (Illumina Inc., San Diego, CA) using their proprietary GoldenGate assay.
Illumina performed initial quality control in their laboratory to identify samples and SNPs that failed genotyping according to proprietary protocols, and sporadic failed genotypes with gencall quality score <0.25. Of 156 duplicate pairs included in 33 plates of samples typed, Illumina was blinded to 92 pairs. Both unblinded and blinded sample replicate concordance rates were > 99.99%. After removal of failed SNPs and samples, the genotype calling rate was 99.93%, with a maximum missing data rate per sample of 2.1%, and maximum missing rate per SNP of 4.98%. Genetic data were checked for cryptic sample duplicates and discrepancies in genetically predicted sex (using X markers) versus reported sex. Samples with unresolved duplicate and sex discrepancies were excluded.
Statistical Analysis
We tested for Hardy Weinberg equilibrium (HWE) using the χ2 goodness of fit test. SICAM-1 measurements were log transformed to normalize the distribution. In MESA, about 50% of the participants have a CAC score of zero and the remaining non-zero scores were highly skewed. We modeled CAC in three ways; (a) continuous trait (log-transformation of the CAC score, adding ten prior to log transformation for all subjects); (b) dichotomous trait (presence or absence of CAC); and (c) categorical trait (4 categories of CAC, 0-49, 50-149, 150-399, ≥400). All associations were stratified by race/ethnicity to reduce confounding due to population stratification and to evaluate heterogeneity in the associations. Associations between individual SNPs and levels of sICAM-1 were assessed with linear regression methods as implemented in PC SAS Version 9.1 (SAS Institute Inc. Cary NC). Logistic regression methods were used with the dichotomous CAC. We used generalized linear models (GENMOD) for categories and continuous CAC with specified probability distributions, multinomial and gamma respectively, to deal with the unique properties of these variables. SNP genotypes were included in the model as a categorical variable, defined as having 0, 1, or 2 copies of the minor allele. To correct for multiple comparisons, we used Bonferroni correction based on the total number race-SNP tests and set a threshold of p < 0.0015 (0.05/34) for ICAM1 and p < 0.0010 (0.05/52) for VCAM1 to determine statistical significance.
The program PHASE v2.1.115-17 was used to estimate haplotypes for 11 ICAM1 SNPs. The most likely haplotypes with a ≥ 1% frequency in the population were included individually in the models and the rare haplotypes (< 1%) were grouped together into a single haplotype. We used a Bonferroni correction based on the total number of race-haplotype tests and set a threshold of p < 0.002 (0.05/24) as a threshold for statistical significance for single haplotype associations. Haploview12 was used to estimate linkage disequilibrium (LD) (Broad Institute, Cambridge MA).
Results
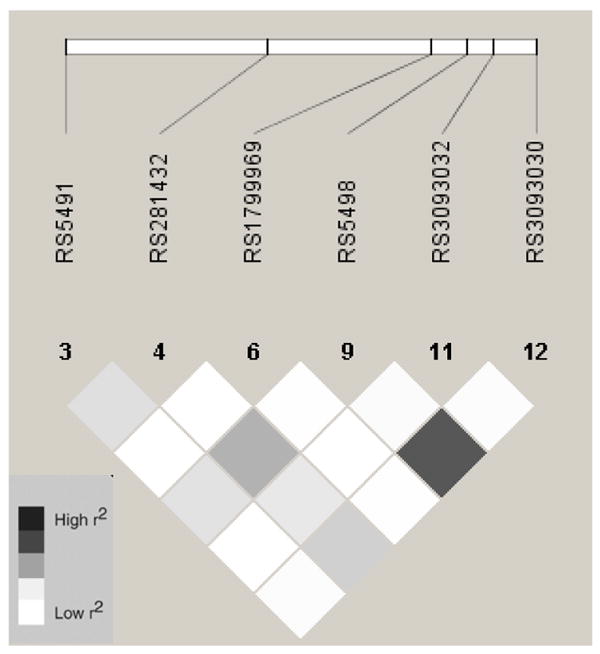
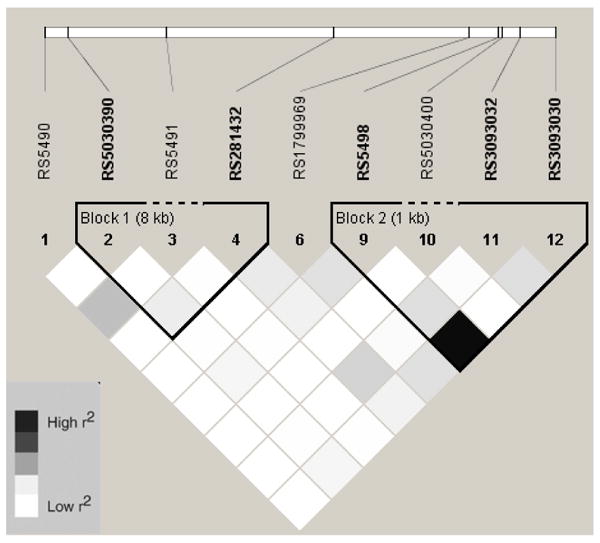
Baseline characteristics by race/ethnic group are shown in table 1. Allele frequencies for ICAM1 and VCAM1 SNPs are listed in Online Table 1. With two exceptions, ICAM1 rs5498 and rs3093030, all SNPs were in HWE (p > 0.05). In African Americans, European Americans, and Hispanics, there were fewer heterozygotes than expected for rs5498 and rs3093030 (see Online Table 2). However, these two SNPs were in HWE in the Chinese. In addition, two SNPs were not in HWE in the sub-sample measured for sICAM-1 compared to the entire MESA sample; rs3093032 in European Americans (p = 0.004) and rs1799969 (p = 0.02) in Hispanics. Description of the SNPs including the base pair position, amino acid substitution, alleles, and location are listed in Online Table 3. Online figures 1-8 show the linkage disequilibrium plots generated in Haploview for each race/ethnic group. ICAM1 haplotype genotype and frequencies are listed in Online Table 4 by race/ethnic group. Because no single SNP associations were observed for VCAM1 and CAC, haplotypes for this gene were not estimated.
Table 1.
Baseline characteristics of MESA participants genotyped for ICAM1 and VCAM1 SNPs by race/ethnic group (means ± SD or percentage)
| Variable | African Americans
(n = 712) |
Chinese
(n = 716) |
European Americans
(n = 712) |
Hispanics
(n = 704) |
|---|---|---|---|---|
| Male, % | 45 | 48 | 47 | 46 |
| Age, years | 62 ± 10 | 62 ± 10 | 61 ± 10 | 61 ± 10 |
| Present CAC, % | 42 | 50 | 45 | 55 |
| Range of CAC scores | 0-4013 | 0-3773 | 0-6062 | 0-5148 |
| Mean CAC score | 136 ± 428 | 95 ± 269 | 156 ± 408 | 122 ± 393 |
| CAC score < 50, % | 76 | 70 | 65 | 74 |
| CAC score 50-149, % | 8 | 14 | 11 | 11 |
| CAC score 150-399, % | 7 | 9 | 12 | 7 |
| CAC score ≥ 400, % | 9 | 7 | 12 | 8 |
| Log (CAC score + 1) | 1.8 ± 2.5 | 2.1 ± 2.4 | 2.4 ± 2.6 | 1.9 ± 2.4 |
| sICAM-1, ng/mL | 252 ± 110 | 230 ± 57 | 284 ± 65 | 296 ± 85 |
Table 2.
Means of sICAM-1 by ICAM1 rs5491 genotype for each race/ethnic group
| Race Group | Geometric mean sICAM-1 levels, ng/mL (n) | p-value | ||
|---|---|---|---|---|
| AA | AT | TT | ||
| African Americans | 298 (179) | 174 (98) | < LOD† (12) | <0.0001 |
| Chinese | 238 (248) | 134 (31) | n/a (0) | <0.0001 |
| European Americans | 279 (532) | 148 (6) | n/a (0) | <0.0001 |
| Hispanics | 300 (315) | 166 (30) | n/a (0) | <0.0001 |
All samples below lower limit of detection (LOD)
n/a = homozygotes not present in this race/ethnic group
Table 3.
ICAM1 SNPs associated at the nominal level (p < 0.05) with sICAM-1 after excluding T-allele carriers for rs5491
| ICAM1 SNP | Geometric mean sICAM-1 levels*, ng/mL (n) | p-value | ||
|---|---|---|---|---|
| African Americans | ||||
| rs5496 (AA, AG, GG) | n/a (0) | 267 (44) | 309 (135) | 0.0008* |
|
| ||||
| Chinese | ||||
| rs5498 (AA, AG, GG) | 231 (149) | 248 (85) | 248 (14) | 0.008 |
| rs3093030 (AA, AG, GG) | 247 (15) | 248 (88) | 230 (145) | 0.006 |
| rs281432 (CC, CG, GG) | 229 (139) | 249 (95) | 245 (14) | 0.002 |
|
| ||||
| European Americans | ||||
| rs5498 (AA, AG, GG) | 268 (180) | 279 (228) | 298 (124) | <0.0001* |
| rs3093030 (AA, AG, GG) | 299 (123) | 278 (227) | 269 (182) | <0.0001* |
|
| ||||
| Hispanics | ||||
| rs1799969 (AA, AG, GG) | n/a (0) | 273 (84) | 310 (231) | <0.0001* |
Statistically significant with Bonferroni Correction (p < 0.0015)
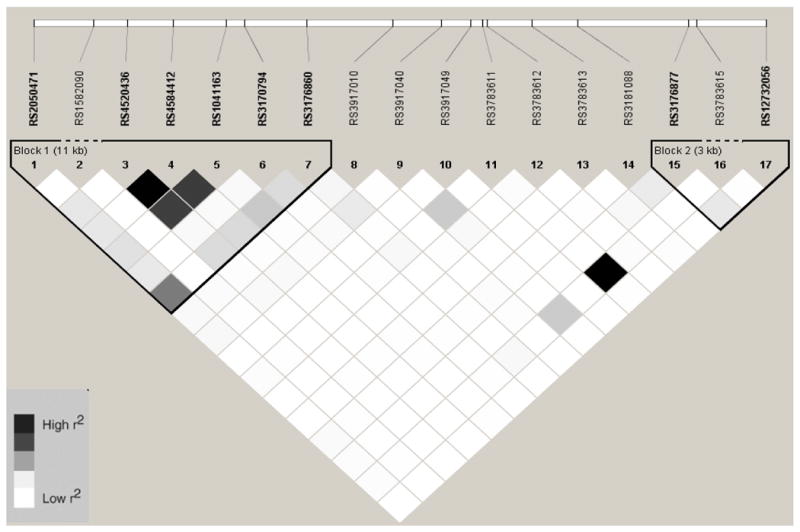
Figure 1.
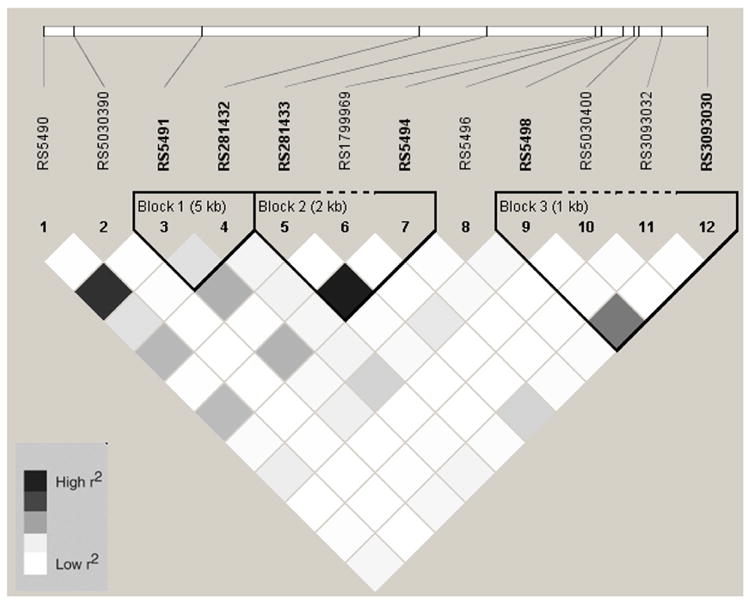
Linkage Disequilibrium Plot (r2) for ICAM1 SNPs in African Americans
Figure 8.
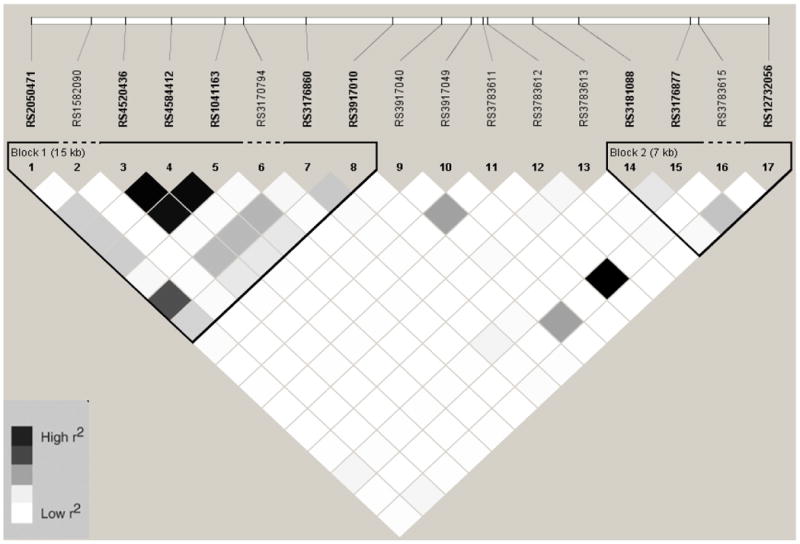
Linkage Disequilibrium Plot (r2) for VCAM1 SNPs in Hispanics
Table 4.
ICAM1 haplotype associations with sICAM-1 after excluding T-allele carriers for rs5491
| ICAM1 Haplotype | Geometric mean sICAM-1 levels, ng/mL by copy (n) | p-value | ||
|---|---|---|---|---|
| 0 | 1 | 2 | ||
| Chinese | ||||
| H1 | 257 (24) | 244 (114) | 229 (110) | 0.003 |
| H2 | 237 (217) | 252 (28) | 236 (3) | 0.23 |
| H3 | 238 (229) | 251 (19) | 0.20 | |
| H4 | 238 (241) | 244 (7) | 0.75 | |
| H5 | 238 (230) | 250 (18) | 0.27 | |
| H6 | 235 (181) | 248 (60) | 260 (7) | 0.05 |
| rare | 239 (238) | 222 (10) | 0.21 | |
| European Americans | ||||
| H1 | 286 (306) | 274 (195) | 268 (31) | 0.04 |
| H2 | 273 (349) | 291 (157) | 297 (26) | 0.003 |
| H3 | 281 (441) | 275 (84) | 284 (7) | 0.67 |
| H4 | 282 (426) | 271 (98) | 316 (8) | 0.05 |
| H5 | 284 (401) | 271 (121) | 267 (10) | 0.06 |
| H6 | 274 (384) | 295 (136) | 276 (12) | 0.001* |
| H7 | 282 (467) | 273 (62) | 236 (3) | 0.17 |
| rare | 280 (515) | 309 (17) | 0.04 | |
| Hispanics | ||||
| H1 | 293 (219) | 305 (78) | 370 (18) | <0.0001* |
| H2 | 303 (178) | 299 (125) | 280 (12) | 0.45 |
| H3 | 310 (231) | 273 (79) | 273 (5) | <0.0001* |
| H4 | 296 (217) | 309 (89) | 335 (9) | 0.12 |
| H5 | 303 (263) | 288 (47) | 321 (5) | 0.30 |
| H6 | 302 (270) | 293 (45) | 0.41 | |
| H7 | 299 (297) | 320 (18) | 0.23 | |
| H8 | 302 (286) | 286 (28) | 276 (1) | 0.46 |
| rare | 300 (294) | 310 (21) | 0.53 | |
Statistically significant with Bonferroni Correction (p < 0.002)
The associations of genotypes and CAC and sICAM-1 were assessed with and without covariates. Covariates included sex, age, smoking status, lifetime smoking exposure (pack-years), alcoholic drinking status, and field center. With the exception of a few SNPs associated with smoking, the most parsimonious model that included only genotype is shown because other covariates were not strongly associated with genotype and the addition of covariates did not materially change the associations. There were no SNPs significantly associated with levels or presence of CAC in any of the four race/ethnic groups using the Bonferroni corrected thresholds (Online Tables 5 and 6). A modest association in African Americans was observed for ICAM1 rs3093030 and CAC (p = 0.002).
ICAM1 SNP genotypes and sICAM-1 levels were available for 1,451 subjects. ICAM1 SNP rs5491 was significantly associated with sICAM-1 levels in all race/ethnic groups. More specifically, the T-allele of rs5491 was associated with 50% lower sICAM-1 levels for heterozygotes and undetectable levels in homozygotes (Table 2). Previous research has shown that the T-allele of rs5491 alters a critical binding site of ICAM-1 interfering with the monoclonal antibody used in the R&D Systems assay to bind to the protein, the same assay that was used to measure sICAM-1 in our study population. Given the relationship between the sICAM-1 assay and rs5491, we assessed the association of the other ICAM1 SNPs and sICAM-1 levels after excluding all rs5491 T-allele carriers (sample size after exclusions n = 1,274). After applying this exclusion, SNPs rs281433 and rs5494 were no longer polymorphic in African Americans.
Table 3 lists geometric means of sICAM-1 by genotype for the most highly associated ICAM1 SNPs. Results for all single SNPs associations are provided in Online Table 7. In African Americans, rs5496 was associated with sICAM-1 level in single SNP model (p = 0.0008) and in a model containing all ICAM1 SNPs (p = 0.002). In Chinese, rs5498 (p = 0.008), rs3093030 (p = 0.006), and rs281432 (p = 0.002) were all modestly associated with sICAM-1. In European Americans, rs5498 (p < 0.0001) and rs3093030 (p < 0.0001) were significantly associated with sICAM-1 in single SNP model. In Hispanics, rs1799969 was significantly associated with sICAM-1 levels in single SNP model (p = 0.0001) and in a model with all ICAM1 SNPs (p < 0.0001).
ICAM1 haplotypes were estimated using all available SNP data; however rs5491 T-carriers were excluded from the analysis with sICAM-1. Global tests of significance for sICAM-1 level and ICAM1 haplotypes were significant in Chinese (F = 2.16, p = 0.03), European Americans (F= 3.39, p < 0.0001), and Hispanics (F= 3.2, p = 0.0001), but not African Americans (F = 1.28, p = 0.22). Table 4 lists the geometric sICAM-1 means by haplotype genotype for Chinese, European Americans, and Hispanics.
Discussion
ICAM-1 is critical in the inflammation pathway. Abnormalities in the ICAM-1 protein and/or sICAM-1 levels may interfere with normal immune function and increase risk for immune-related diseases. While we did not observe strong associations between ICAM1 or VCAM1 SNPs and CAC, we did discover several SNPs that were significantly associated with sICAM-1 levels, although not always consistent across racial/ethnic groups.
Regarding the relationship of rs5491 genotype and the R&D Systems ICAM-1 assay, our data corroborates the finding of Register et al. that heterozygotes have a 50% lower sICAM level, on average, and TT homozygotes have undetectable levels18. In a sample of non-rs6591 T carriers, several ICAM1 SNPs and haplotypes were associated with sICAM-1. SNPs rs5498 and rs3093030 were significantly associated with sICAM-1 in European Americans, with similar patterns observed for these SNPs in Chinese. In European Americans, rs5498 and rs3093030 are in complete LD (r2 = 1) and both of these SNPs were out of HWE. However, corroborating evidence suggests that this association is credible. The rs5498 polymorphism entails a glutamic acid to lysine substitution within coding exon 6 that is thought to lead to decreased integrin receptor binding19. We observed higher levels of sICAM-1 with rs5498-G allele replicating a previous report in a German pediatric asthma case control study. Rs5498 has been associated with other conditions including prostate cancer in African Americans21, plasma fibrinogen in type 2 diabetics22, and type 1 diabetes in a Swedish population23. In contrast, rs3093030 has no known function. In European Americans, the haplotype (H6) loaded with alleles that are associated with higher sICAM-1 in the four ethnic groups and was significantly associated with sICAM-1. It is unclear why we did not observe a dose dependent relationship. One possible explanation is the small number of subjects (n = 12) who carry 2-copies of H6. Larger sample sizes are needed to clarify the pattern of association.
In Hispanics, rs1799969 and H1 & H3 were significantly associated with sICAM-1 levels. H3 is the only haplotype to carry the ‘A’ allele for rs1799969. Haplotype 1 carries the ‘G’ allele, but is otherwise identical to H3. SNP rs1799969 entails an arginine to glycine substitution within coding exon 4 and is located in the third NH2-terminal immunoglobulinlike domain of the protein that maps to the binding site for Mac-1. Based on known functions of rare mutations in this domain, the hypothesis is that this variant modulates affinity for Mac-1 that alters the receptor-ligand interaction24. Excess melanoma risk was observed in subjects carrying the ‘A’ allele25 and the frequency of this allele increased threefold (OR = 3.59) in celiac disease patients compared to controls and this association was stronger (OR = 4.97) in adult on-set cases compared to cases diagnosed prior to 15 years of age24. In African Americans, rs5496 was associated with sICAM-1. This SNP resides within intron-5 and has no known function.
There are several reasons that might explain the lack of consistency between racial/ethnic groups. Differing LD patterns between racial groups, genotype frequency differences affecting the power to detect associations, and evidence of selection pressure at this locus in tropical climates where malaria is endemic26 are possible factors that could be in play. Two of the SNPs related to sICAM-1 level in our study, rs5498 and rs1799969, have been previously implicated in increased risk of auto-immune disease.
This investigation has several strengths. This was the first population based study to investigate the relationship between ICAM1 and VCAM1 SNPs and CAC, a subclinical measure of atherosclerosis. We were able to assess LD structure and heterogeneity by race given our study population included four racial groups of equal size. Furthermore, we were able to investigate ICAM1 SNPs and sICAM-1 levels in a subset of our population that included all 4 race/ethnic groups. As with any candidate gene study, LD patterns make it difficult to positively identify the causal variant. Further studies are needed to determine the true causal SNPs related to sICAM-1 level and to evaluate the relationship between these SNPs and CVD outcomes.
Supplementary Material
Figure 2.
Linkage Disequilibrium Plot (r2) for ICAM1 SNPs in Chinese
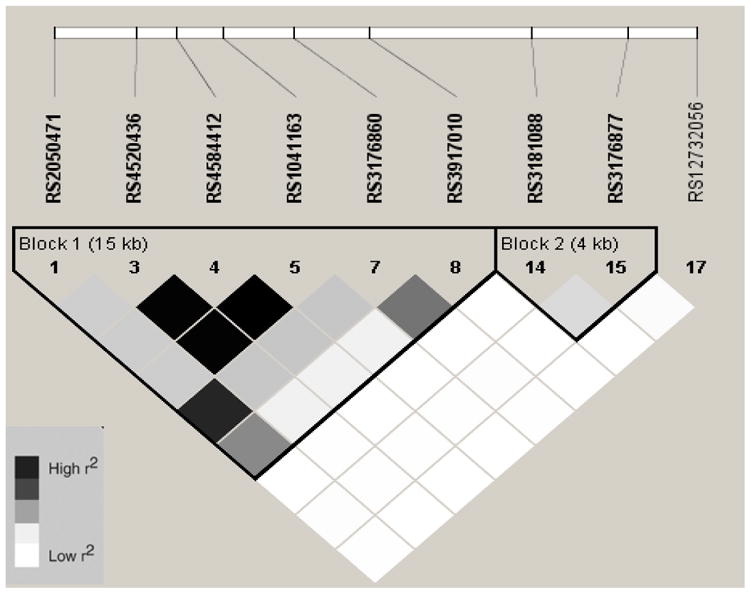
Figure 3.
Linkage Disequilibrium Plot (r2) for ICAM1 SNPs in European Americans
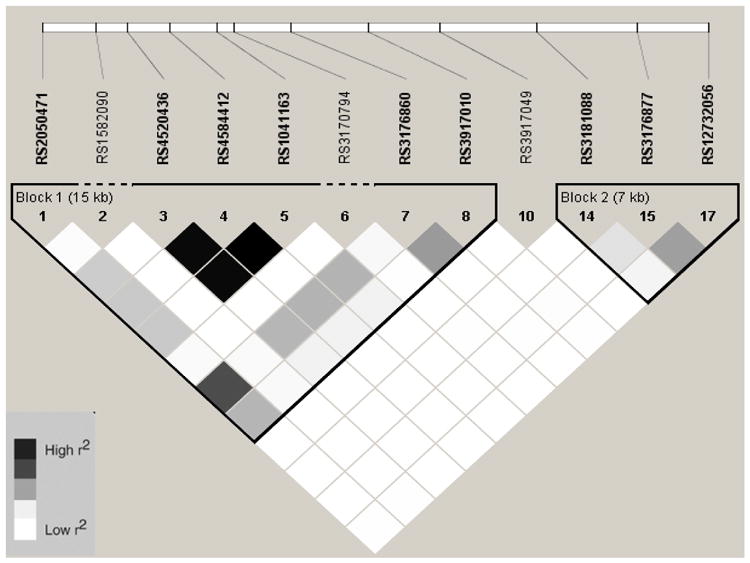
Figure 4.

Linkage Disequilibrium Plot (r2) for ICAM1 SNPs in Hispanics
Figure 5.
Linkage Disequilibrium Plot (r2) for VCAM1 SNPs in African Americans
Figure 6.
Linkage Disequilibrium Plot (r2) for VCAM1 SNPs in Chinese
Figure 7.
Linkage Disequilibrium Plot (r2) for VCAM1 SNPs in European Americans
Acknowledgments
The authors thank the other investigators, the staff, and the participants of the MESA study for their valuable contributions. This research was supported by contracts N01-HC-95159 through N01-HC-95165, N01-HC-95169, R01-HL071250 through R01-HL071252, R01-HL071259, R01-HL071051, and R01-HL071205 from the National Heart, Lung, and Blood Institute. A full list of participating MESA investigators and institutions can be found at http://www.mesa-nhlbi.org.
Footnotes
Publisher's Disclaimer: This is a PDF file of an unedited manuscript that has been accepted for publication. As a service to our customers we are providing this early version of the manuscript. The manuscript will undergo copyediting, typesetting, and review of the resulting proof before it is published in its final citable form. Please note that during the production process errors may be discovered which could affect the content, and all legal disclaimers that apply to the journal pertain.
References
- 1.Inwald D, Davies EG, Klein N. Demystified…adhesion molecule deficiencies. Mol Pathol. 2001;54:1–7. doi: 10.1136/mp.54.1.1. [DOI] [PMC free article] [PubMed] [Google Scholar]
- 2.Libby P, Theroux P. Pathophysiology of coronary artery disease. Circulation. 2005;111:3481–3488. doi: 10.1161/CIRCULATIONAHA.105.537878. [DOI] [PubMed] [Google Scholar]
- 3.Hwang SJ, Ballantyne CM, Sharrett AR, Smith LC, Davis CE, Gotto AM, Jr, Boerwinkle E. Circulating adhesion molecules VCAM-1, ICAM-1, and E-selectin in carotid atherosclerosis and incident coronary heart disease cases: the Atherosclerosis Risk In Communities (ARIC) study. Circulation. 1997;96:4219–4225. doi: 10.1161/01.cir.96.12.4219. [DOI] [PubMed] [Google Scholar]
- 4.Ridker PM, Hennekens CH, Buring JE, Rifai N. C-reactive protein and other markers of inflammation in the prediction of cardiovascular disease in women. N Engl J Med. 2000;342:836–843. doi: 10.1056/NEJM200003233421202. [DOI] [PubMed] [Google Scholar]
- 5.Ridker PM, Hennekens CH, Roitman-Johnson B, Stampfer MJ, Allen J. Plasma concentration of soluble intercellular adhesion molecule 1 and risks of future myocardial infarction in apparently healthy men. Lancet. 1998;351:88–92. doi: 10.1016/S0140-6736(97)09032-6. [DOI] [PubMed] [Google Scholar]
- 6.Malik I, Danesh J, Whincup P, Bhatia V, Papacosta O, Walker M, Lennon L, Thomson A, Haskard D. Soluble adhesion molecules and prediction of coronary heart disease: a prospective study and meta-analysis. Lancet. 2001;358:971–976. doi: 10.1016/S0140-6736(01)06104-9. [DOI] [PubMed] [Google Scholar]
- 7.Signorelli SS, Mazzarino MC, Di Pino L, Malaponte G, Porto C, Pennisi G, Marchese G, Costa MP, Digrandi D, Celotta G, Virgilio V. High circulating levels of cytokines (IL-6 and TNFalpha), adhesion molecules (VCAM-1 and ICAM-1) and selectins in patients with peripheral arterial disease at rest and after a treadmill test. Vasc Med. 2003;8:15–19. doi: 10.1191/1358863x03vm466oa. [DOI] [PubMed] [Google Scholar]
- 8.Bild DE, Bluemke DA, Burke GL, Detrano R, Diez Roux AV, Folsom AR, Greenland P, Jacob DR, Jr, Kronmal R, Liu K, Nelson JC, O'Leary D, Saad MF, Shea S, Szklo M, Tracy RP. Multi-ethnic study of atherosclerosis: objectives and design. Am J Epidemiol. 2002;156:871–881. doi: 10.1093/aje/kwf113. [DOI] [PubMed] [Google Scholar]
- 9.Carr JJ, Nelson JC, Wong ND, McNitt-Gray M, Arad Y, Jacobs DR, Jr, Sidney S, Bild DE, Williams OD, Detrano RC. Calcified coronary artery plaque measurement with cardiac CT in population-based studies: standardized protocol of Multi-Ethnic Study of Atherosclerosis (MESA) and Coronary Artery Risk Development in Young Adults (CARDIA) study. Radiology. 2005;234:35–43. doi: 10.1148/radiol.2341040439. [DOI] [PubMed] [Google Scholar]
- 10.Fan JB, Gunderson KL, Bibikova M, Yeakley JM, Chen J, Wickham Garcia E, Lebruska LL, Laurent M, Shen R, Barker D. Illumina universal bead arrays. Methods Enzymol. 2006;410:57–73. doi: 10.1016/S0076-6879(06)10003-8. [DOI] [PubMed] [Google Scholar]
- 11.Gunderson KL, Kruglyak S, Graige MS, Garcia F, Kermani BG, Zhao C, Che D, Dickinson T, Wickham E, Bierle J, Doucet D, Milewski M, Yang R, Siegmund C, Haas J, Zhou L, Oliphant A, Fan JB, Barnard S, Chee MS. Decoding randomly ordered DNA arrays. Genome Res. 2004;14:870–877. doi: 10.1101/gr.2255804. [DOI] [PMC free article] [PubMed] [Google Scholar]
- 12.Barrett JC, Fry B, Maller J, Daly MJ. Haploview: analysis and visualization of LD and haplotype maps. Bioinformatics. 2005;21:263–265. doi: 10.1093/bioinformatics/bth457. [DOI] [PubMed] [Google Scholar]
- 13.P dB. Tagger. In; 2004.
- 14.The International HapMap Project. Nature. 2003;426:789–796. doi: 10.1038/nature02168. [DOI] [PubMed] [Google Scholar]
- 15.Li N, Stephens M. Modeling linkage disequilibrium and identifying recombination hotspots using single-nucleotide polymorphism data. Genetics. 2003;165:2213–2233. doi: 10.1093/genetics/165.4.2213. [DOI] [PMC free article] [PubMed] [Google Scholar]
- 16.Stephens M, Donnelly P. A comparison of bayesian methods for haplotype reconstruction from population genotype data. Am J Hum Genet. 2003;73:1162–1169. doi: 10.1086/379378. [DOI] [PMC free article] [PubMed] [Google Scholar]
- 17.Stephens M, Smith NJ, Donnelly P. A new statistical method for haplotype reconstruction from population data. Am J Hum Genet. 2001;68:978–989. doi: 10.1086/319501. [DOI] [PMC free article] [PubMed] [Google Scholar]
- 18.Register TC, Burdon KP, Lenchik L, Bowden DW, Hawkins GA, Nicklas BJ, Lohman K, Hsu FC, Langefeld CD, Carr JJ. Variability of serum soluble intercellular adhesion molecule-1 measurements attributable to a common polymorphism. Clin Chem. 2004;50:2185–2187. doi: 10.1373/clinchem.2004.036806. [DOI] [PubMed] [Google Scholar]
- 19.Puthothu B, Krueger M, Bernhardt M, Heinzmann A. ICAM1 amino-acid variant K469E is associated with paediatric bronchial asthma and elevated sICAM1 levels. Genes Immun. 2006;7:322–326. doi: 10.1038/sj.gene.6364302. [DOI] [PubMed] [Google Scholar]
- 20.Meyer DM, Dustin ML, Carron CP. Characterization of intercellular adhesion molecule-1 ectodomain (sICAM-1) as an inhibitor of lymphocyte function-associated molecule-1 interaction with ICAM-1. J Immunol. 1995;155:3578–3584. [PubMed] [Google Scholar]
- 21.Chen H, Hernandez W, Shriver MD, Ahaghotu CA, Kittles RA. ICAM gene cluster SNPs and prostate cancer risk in African Americans. Hum Genet. 2006;120:69–76. doi: 10.1007/s00439-006-0184-3. [DOI] [PubMed] [Google Scholar]
- 22.Yokoyama H, Tahara H, Emoto M, Fujiwara S, Araki T, Shinohara K, Hatsuda S, Maeno T, Shoji T, Koyama H, Shoji T, Nishizawa Y. The K469E polymorphism of the intercellular adhesion molecule-1 gene is associated with plasma fibrinogen level in type 2 diabetes. Metabolism. 2005;54:381–386. doi: 10.1016/j.metabol.2004.10.002. [DOI] [PubMed] [Google Scholar]
- 23.Ma J, Mollsten A, Prazny M, Falhammar H, Brismar K, Dahlquist G, Efendic S, Gu HF. Genetic influences of the intercellular adhesion molecule 1 (ICAM-1) gene polymorphisms in development of Type 1 diabetes and diabetic nephropathy. Diabet Med. 2006;23:1093–1099. doi: 10.1111/j.1464-5491.2006.01948.x. [DOI] [PMC free article] [PubMed] [Google Scholar]
- 24.Abel M, Cellier C, Kumar N, Cerf-Bensussan N, Schmitz J, Caillat-Zucman S. Adulthood-onset celiac disease is associated with intercellular adhesion molecule-1 (ICAM-1) gene polymorphism. Hum Immunol. 2006;67:612–617. doi: 10.1016/j.humimm.2006.04.011. [DOI] [PubMed] [Google Scholar]
- 25.Vinceti M, Pellacani G, Casali B, Malagoli C, Nicoli D, Farnetti E, Bassissi S, Bergomi M, Seidenari S. High risk of cutaneous melanoma amongst carriers of the intercellular adhesion molecule-1 R241 allele. Melanoma Res. 2006;16:93–96. doi: 10.1097/01.cmr.0000198450.19204.dd. [DOI] [PubMed] [Google Scholar]
- 26.Craig A, Fernandez-Reyes D, Mesri M, McDowall A, Altieri DC, Hogg N, Newbold C. A functional analysis of a natural variant of intercellular adhesion molecule-1 (ICAM-1Kilifi) Hum Mol Genet. 2000;9:525–530. doi: 10.1093/hmg/9.4.525. [DOI] [PubMed] [Google Scholar]
Associated Data
This section collects any data citations, data availability statements, or supplementary materials included in this article.