Abstract
As an alternative to traditional, morphology-based methods, molecular techniques can provide detection of multiple species within the HAB community and, more widely, the phytoplankton community in a rapid, accurate and simultaneous qualitative analysis. These methods require detailed knowledge of the molecular diversity within taxa in order to design efficient specific primers and specific probes able to avoid cross-reaction with non-target sequences. Isolates from Florida coastal communities were sequence-analyzed and compared with the GenBank database. Almost 44% of the genotypes obtained did not match any sequence in GenBank, showing the existence of a large and still unexplored biodiversity among taxa. Based on these results and on the GenBank database, we designed 14 species-specific probes and 4 sets of specific primers. Multiple simultaneous detection was achieved with a bead array method based on the use of a flow cytometer and color-coded microspheres, which are conjugated to the developed probes. Following a parallel double PCR amplification, which employed universal primers in a singleplex reaction and a set of species-specific primers in multiplex, detection was performed in a cost effective and highly specific analysis. This multi-format assay, which required less than 4 h to complete from sample collection, can be expanded according to need. Up to 100 different species can be identified simultaneously in a single sample, which allows for additional use of this method in community analyses extended to all phytoplankton species. Our initial field trials, which were based on the 14 species-specific probes, showed the co-existence and dominance of two or more species of Karenia during toxic blooms in Florida waters.
Keywords: Bead array, Harmful Algal Bloom, Luminex, Simultaneous molecular detection
1. Introduction
The spatial and temporal distribution of total phytoplankton biomass is better documented and understood than the distribution of individual phytoplankton species because of the greater ease of measuring total biomass. Total phytoplankton biomass is usually estimated by the concentration of chlorophyll a, which can be easily extracted and measured fluorometrically or spectrophotometrically. While not as quantitatively accurate, chlorophyll spatial and temporal patterns can also be examined using satellite or airborne remote sensing, or using towed or moored instruments that detect the in vivo fluorescence of chlorophyll. By contrast, the identification and quantification of individual species remains difficult, time consuming, tedious, and requires a great deal of expertise and experience. In general, individual cells must be examined to distinguish species by their morphological characteristics.
Light microscopy is often not adequate for discerning some of the small differences between species and electron microscopy must be used, increasing the expense and time needed. Often, even a morphologically defined “species” is inadequate because of the existence of sibling species. An understanding of the population dynamics of a species is dependent upon the correct identification of the genetic species, which is often not the “morphological species”. The correct identification of species is particularly acute in the study of toxic Harmful Algal Blooms, as only individual genetic species produce the toxins that present an increasing hazard, throughout the world, to the health of humans and various organisms in the ecosystem (Smayda, 1990; Hallegraeff, 1993; Hackett et al., 2004). To satisfy these requirements, a genetic analysis is needed. An understanding of the factors that lead to Harmful Algal Blooms requires information of the spatial and temporal distribution of the species before they increase to high concentrations. Furthermore, samples must be taken over large areas and frequently over long time periods. Rapid and inexpensive analysis is therefore an important factor.
Because a rather high percentage of toxic Harmful Algal Blooms are caused by dinoflagellates, we directed most of our effort on distinguishing different species of dinoflagellates. For field studies, we focused on Karenia brevis, the toxic dinoflagellate that causes most of the toxic Harmful Algal Blooms along the west coast of Florida.
Several alternative detection methods based on molecular assays have been developed in the last decade. These methods comprised RFLP (Restriction Fragment Length Polymorhism) (Adachi et al., 1994), HMA (Heteroduplex Mobility Assay) (Oldach et al., 2000), Real-time PCR (Bowers et al., 2000; Tengs et al., 2001; Gray et al., 2003; Galluzzi et al., 2004; Hosoi-Tanabe and Sako, 2005), FISH (Fluorescent In Situ Hybridization) (Miller and Scholin, 1996; John et al., 2005; Takahashi et al., 2005), NASBA (Nucleic Acid-based Sequence Amplification) (Casper et al., 2004, 2007; Patterson et al., 2005), SHA (Sandwich Hybridization Assay) (Scholin et al., 1996; Tyrrell et al., 2002) and NPA-SH Sandwich Hybridization Assay Nuclease Protection (Cai et al., 2004). More recently, detection methods for some of the most common toxic dinoflagellates were developed based on bead (Ellison and Burton, 2005) or nanoparticle (Galluzzi et al., 2006) array technology.
All molecular-based methods require the support of detailed phylogenetic data. Unfortunately, phytoplankton phylogeny is poorly resolved and in particular the phylogeny of dinoflagellate species. In the late 1800s and early 1900s four genera of dinoflagellates (Gymnodinium, Peridinium, Amphidinium and Prorocentrum) were described based on morphological characteristics. In the 1960s a major revision was carried out by Balech that resulted in the inclusion of several new genera (Balech, 1974, 1977, 1989). The morphology was based mainly on the pattern of the thecal plates (composed of celluose or other polysaccharides, whose role is to harden the cell wall) and their number. For this reason, the taxonomy of athecate dinoflagellates (naked dinoflagellates) progressed slowly.
Based on ultrastructural studies, rDNA large subunit (LSU) sequence data and previous (Saunders et al., 1997) small subunit (SSU) data, Daugbjerg et al. (2000) divided the genus Gymnodinium into 4 genera. Additional phylogenetic studies based on the LSU rDNA have been conducted on a diversity of genera and species, many of which were newly described (Hirashita et al., 2000; Guillou et al., 2002; De Salas et al., 2003, 2004a,b; Murray et al., 2005; Haywood et al., 2004; Botes et al., 2003).
Other genes have also been studied: the encoded form II Rubisco gene, chloroplast 23S, SSU rRNA, mitochondrial cytochrome B, Internal Transcribed Spacer regions (ITS) (Zhang and Lin, 2003; Pochon et al., 2006; Litaker et al., 1999; Lin et al., 2006a,b; Zhang et al., 2005; Yoshida et al., 2003; D'Onofrio et al., 1999; Gottschling et al., 2005; Montresor et al., 2003). Further phylogenetic analyses on dinoflagellates are needed, however, to clarify the relationship between molecular and morphology-based taxonomy and to provide taxonomic support to molecular detection methods.
The goals of the present study included: (1) assessment, through sequencing data, of HAB community diversity in west Florida waters, (2) development of a rapid, sensitive, reliable and cost-effective procedure to allow simultaneous detection of toxin-producing species in a multi-format assay and to provide, at the same time, high specificity, (3) application of this procedure in preliminary field trials.
Goal 1 was achieved with sequence analysis of isolates from Florida waters and related cultures from the CCMP laboratory, to compare with sequences in the GenBank database whereas (2) and (3) employed Luminex Xmap technology based on a flow cytometer that analyzes multiple color-coded fluorescent microspheres (beads) coupled with specific sequences. These sequences represent probes that were designed based on sequence analysis of individual species. The 5.6 μm polystyrene carboxylated beads are internally dyed with two different fluorophores (red and infrared) in a variety of combinations generating up to 100 different microsphere sets with specific spectral addresses. These unique microspheres are covalently coupled to probes that are designed to be complimentary to target DNA sequences. The covalent linkage occurs between the carboxyl group of the microsphere and the C12 modification of the probe. Target DNA is biotinylated, denatured and hybridized to the microsphere-probe set under stringent conditions. A reporter molecule, such as streptavidin-R-phycoerythrin, is added to detect hybridization.
The microsphere-probe sets are interrogated individually in a fast flowing fluid as they pass by two separate laser beams in the Luminex 100 analyzer. A 635 nm classification laser excites the 2 fluorophores contained inside the microspheres, allowing the classification of each coupled bead based on its spectral address. A 532 nm reporter laser excites the reporter fluorochrome (streptavidin-R-phycoerythrin) on the surface, permitting quantification of the hybridized biotinylated amplicon (captured DNA). The fluorescent signals are converted into intensity units by a digital signal processor.
The multi-format structure of this assay, which permits qualitative detection of 100 species at one time, allows for additional, simultaneous analysis of phytoplankton community diversity. The method could provide, in this way, a more precise understanding of the biodiversity that can be found in Florida waters before, during and after a toxic bloom.
2. Materials and methods
2.1. Strains studied
Isolates from Florida waters and voucher specimens were studied in comparison for our Florida waters community analysis. Twenty-three strains of voucher specimens (Table 1) from the Provasoli-Guillard Center for the Culture of Marine Phytoplankton, from the Algae Collection at the University of Texas and from the Algae Collection at Florida International University were cultured. Seawater for the cultures was collected from the northern Tongue of the Ocean, Bahamas. The seawater and individual nutrient stock solutions were all autoclaved separately in Teflon bottles to make BWM media (Brand, 1986). The cultures were maintained at 21-23 °C and a light intensity of 59 uEinst m−2 s−1 provided by cool-white fluorescent bulbs on a 14:10 photoperiod. Twenty-nine cultures (Table 2) were isolated from Florida waters, several of which were deposited at CCMP (the detailed isolation method for these cultures will be described in a future publication).
Table 1.
List of voucher specimens studied
| Collection label | Collection number | Sequencing identification | GenBank accession number |
|---|---|---|---|
| Alexandrium tamarense/catenella | CCMP 1493 | Identical to Alexandrium catenella AB088229 | EU165300 |
| Amphidinium carterae | CCMP 1314 | Identical to Amphidinium carterae AF260380 | EU165301 |
| Amphidinium massartii | CCMP 1342 | Identical to Amphidinium klebsii AF260381 | EU165302 |
| Amphidinium operculatum | CCMP 120 | I bp different from Amphidinium gibbosum AY460567 | EU165303 |
| Amphidinium operculatum | CCMP 1344 | Related to Amphidinium carterae and Amphidinium eilatiensis | EU165304 |
| Ceratium longipes | CCMP 1770 | Related to Ceratium lineatum | EU165305 |
| Heterocapsa pygmeae | UTEX 2421 | Clusters in the Heterocapsa group | EU165306 |
| Heterocapsa triquetra | CCMP 448 | 4 bp different from Heterocapsa triquetra AF2604401 | EU165307 |
| Karenia brevis | CCMP 2228 | Identical to Karenia brevis U92248 | EU165308 |
| Karenia brevis | CCMP 2229 | Identical to Karenia brevis U92248 | EU165309 |
| Karenia brevis | CCMP 2281 | Identical to Karenia brevis U92248 | EU165310 |
| Karenia mikimotoi | CCMP 429 | Identical to Karenia mikimotoi AY355460 | EU165311 |
| Katodinium rotundatum (Heterocapsa rotundata) | CCMP 1734 | Clusters in the Heterocapsa group, far from Heterocapsa rotundata AF260400 | EU165312 |
| Lingulodinium polyedra (Gonyaulax polyedra) | CCMP 1738 | 8 bp different from Gonyaulax polyedra AF377944 | EU165313 |
| Prorocentrum cassubicum | UTEX 1596 | Related to Prorocentrum foveolatum AY259173 | EU165314 |
| Prorocentrum hoffmannianum | CCMP 683 | 2 bp different from Prorocentrum hoffmannianum AY259171 | EU165315 |
| Prorocentrum lima | FIU PL | Identical to Prorocentrum lima L38634 | EU165316 |
| Prorocentrum lima | CCMP 1368 | 19 bp different from Prorocentrum lima L38634 | EU165317 |
| Prorocentrum mexicanum | CCMP 687 | 3 bp different from Prorocentrum mexicanum AF260378 | EU165318 |
| Prorocentrum micans | CCMP 1591 | 1 bp different from Prorocentrum micans AF260377 | EU165319 |
| Prorocentrum minimum | CCMP 695 | Identical to Prorocentrum minimum AF042813 | EU165320 |
| Protoceratium reticulatum | CCMP 1721 | More than 30 bp from Protoceratium reticulatum AY027907 | EU165321 |
| Scrippsiella sp. | CCMP 1735 | Clusters in the Scrippsiella group | EU165322 |
CCMP, Provasoli-Guillard Center for the Culture of Marine Phytoplankton; UTEX, Culture Collection of Algae, University of Texas; FIU, Culture Collection of Algae, Florida International University.
Table 2.
List of Florida water isolates studied
| FIU number/CCMP number | Sequencing identification | GenBank accession number | Number of identical strains |
|---|---|---|---|
| FIU 2 | Related to Amphidinium carterae and Amphidinium eilatiensis | EU165276 | |
| FIU 5/CCMP 2770 | Clusters in the Heterocapsa/Cachonina group | EU165271 | 3 |
| FIU 9 | 1 bp different from Prorocentrum rhathymum AY259167 | EU165279 | 3 |
| FIU 10 | Clusters in the Heterocapsa/Cachonina group | EU165272 | |
| FIU 11 | Clusters in the Heterocapsa/Cachonina group | EU165273 | 2 |
| FIU 12R | 5 bp different from Heterocapsa sp. AY371082 | EU165274 | |
| FIU 14/CCMP 2819 | 1 bp different from Amphidinium gibbosum AY460587 | EU165277 | 2 |
| FIU 16/CCMP 2797 | 6 bp different from Scrippsiella trochoidea AY628427 | EU165285 | 2 |
| FIU 20/CCMP 2776 | Identical to Protoceratium reticulatum AY027907 | EU165290 | 2 |
| FIU 21/CCMP 2812 | Identical to Prorocentrum minimum AF042813 | EU165280 | 2 |
| FIU 22 | Related to Prorocentrum donghiaense, Prorocentrum dentatum, Prorocentrum minimum and Prorocentrum balticum | EU165281 | |
| FIU 23/CCMP 2772 | Related to Prorocentrum micans and Prorocentrum gracile | EU165282 | 1 |
| FIU 25 | 6 bp different from Prorocentrum rhathymum AY259167 | EU165283 | |
| FIU 26 | Identical to Scrippsiella trochoidea AY628427 | EU165286 | 2 |
| FIU 30/CCMP 2810 | Clusters in the Scrippsiella group | EU165287 | |
| FIU 31 | Clusters in the Heterocapsa/Cachonina group | EU165275 | |
| FIU 32/CCMP 2774 | Related to Amphidinium massartii and Amphidinium klebsii | EU165278 | 1 |
| FIU 34/CCMP 2796 | More than 10 bp different from Akashiwo sanguinea AF2603397 | EU165292 | 1 |
| FIU 35/CCMP 2810 | Clusters in the Scrippsiella group | EU165288 | |
| FIU 39 | Related to Coolia monotis U92258/Coolia malayense AF244942 | EU165293 | |
| FIU 40/CCMP 2804 | 3 bp different from Prorocentrum hoffmannianum AY259171 | EU165284 | |
| FIU 41/CCMP 2778 | Identical to Karlodinium micrum AY245692 | EU165294 | |
| FIU 42/CCMP 2793 | Identical to Chattonella subsalsa AF409126 | EU165295 | 4 |
| FIU 45/CCMP 2820 | Identical to Karenia brevis U92248 | EU165296 | |
| FIU 49 | Related to Fragilidium subglobosum AF033868 | EU165297 | |
| FIU 51/CCMP 2817 | 1 bp different from Heterosigma akashiwo AF409124 | EU165291 | 2 |
| FIU 52 | Identical to Gymnodinium corii AF318226 | EU165298 | |
| FIU 53/CCMP 2775 | Clusters in the Scrippsiella group | EU165289 | |
| FIU 57 | 3 bp different from Gymnodinium sp. U94907 | EU165299 |
FIU, Culture Collection of Algae, Florida International University; CCMP, Provasoli-Guillard Center for the Culture of Marine Phytoplankton.
For our field studies surface seawater samples were collected in Florida waters from Pine Island Sound in July 2006 and off Charlotte Harbor in October 2006. The latter samples were taken during a Florida Monitoring and Event Response for Harmful Algal Blooms (MERHAB) Cruise. Specific locations for both cruises and microscopic counts for the MERHAB Cruise are reported in Tables 7 and 8.
Table 7.
List of collection sites
| Station | Time (EDT) | Latitude | Longitude |
|---|---|---|---|
| July 27, 2006 | |||
| Stn 1 | 06:05 | 26°27.227′N | 82°00.241′W |
| Stn 2 | 07:40 | 26°28.623′N | 82°05.179′W |
| Stn 4 | 08:40 | 26°33.614′N | 82°10.437′W |
| Stn 5 | 09:02 | 26°36.554′N | 82°12.108′W |
| Stn 7 | 10:35 | 26°41.592′N | 82°13.995′W |
| Stn 8 | 11:00 | 26°44.394′N | 82°14.960′W |
| Stn 9 | 12:17 | 26°46.150′N | 82°18.498′W |
| Stn 10 | 12:36 | 26°44.968′N | 82°17.591′W |
| October 9–13, 2006 MERHAB Cruise | |||
| Stn 32 | 19:13 | 26°44.422′N | 82°20.421′W |
| Stn 44 | 07:20 | 26°40.706′N | 82°20.330′W |
| Stn 52 | 18:26 | 26°42.821′N | 82°20.747′W |
| Stn 58 | 06:15 | 26°41.492′N | 82°19.481′W |
Table 8.
Microscopic counts for the 9–13, October 2006 MERHAB Cruise
| K. brevis | K. mikimotoi | K. papilionacea | Karenia sp. | |
|---|---|---|---|---|
| Station 32 | 57 | 2 | 3 | 32 |
| Station 44 | 79 | 2 | 46 | |
| Station 52 | 251 | 4 | 3 | 158 |
| Station 58 | 59 | 1 | 1 | 34 |
Numbers refer to cells per ml.
2.1.1. DNA extraction
The steps in our methods are synthesized in Table 3. DNA extraction for the 29 cultures in Table 2 was achieved with the Bio101 FastDNA kit (Qbiogene) and the FastPrep instrument (Qbiogene) according to the manufacturer's instructions. DNA extraction for voucher specimens and environmental samples was carried out according to the following procedure. Two hundred microliters of each sample were filtered through SUPOR 800 filters (0.8 μM pore, 25 mm diameter). All filters were frozen at −80 °C. One tenth of each filter (about 2.5 mm) was punched out with a hole-punch, placed in a microtube containing 100 μl of water and boiled for5 min at 100 °C. Genomic DNA concentration was quantified with a Nano Drop ND-100 spectrophotometer using absorbance of 260 nm. Due to the PCR inhibition showed by several single culture samples, the procedure was modified for these samples, which were spun for 10 min at 13,000 rpm in a microcentrifuge (Galaxy 16DH, VWR). The pellet was then re-dissolved in 100 ml of seawater and filtered. The purpose of this wash step was to eliminate possible inhibitors, which were present in single culture samples due to the cultural media or to substances produced by the cultures themselves at some stage of their growth.
Table 3.
List of steps carried out in our procedure
| DNA extraction (2.1.1) | |
| Sequencing analysis (2.1.2) | PCR amplification with universal primers (no biotin moiety added) followed by electrophoresis verification, purification and determination of partial LSU rDNA sequences |
| Luminex analysis (2.1.3) | Primer design based on sequencing results (2.1.3.1) |
| Probe design based on sequencing results (2.1.3.2) | |
| Coupling reaction (2.1.3.3) | |
| PCR amplifications: singleplex with universal primers (biotinylated reverse) and multiplex with 4 sets of specific primers (biotinylated reverse) (2.1.3.4) | |
| Hybridization assay (2.1.3.5) | |
| Detection analysis (probe singleplex, probe multiplex, probe and target multiplex) (2.1.3.6) | |
| Field studies (2.1.4) |
2.1.2. Sequence analysis
A PCR amplification followed the extraction. The PCR mixture was comprised of 5 μl of buffer (containing 15 mM Mg2Cl2), 10 pmol per each primer, 1.5 μl dNTPs (10 mM) and 1.5 units of DyNAzyme polymerase (New England Biolabs). Template amount was based on the genomic DNA concentration. Final DNA concentration varied from 10 to 40 ng. Sterile water was added to bring the mixture to the final volume (50 μl). Primers D1R and D2C (Scholin et al., 1994) were synthesized by Sigma Genosys (Table 4).
Table 4.
List of universal primers used
| Primer name | Primer sequence; primer length | Melting T; G/C%; Sec. struct. |
|---|---|---|
| D1R F | ACCGCTGAATTTAAGCATA; 19bp | 57.4 °C; 36.84%; weak |
| D2C R | CCTTGGTCCGTGTTTCAAGA; 20bp | 65 °C; 50%; moderate |
The PCR program consisted of one cycle of denaturation at 95 °C for 5 min followed by 30 cycles of 30 s denaturation at 95 °C, 30 s annealing at 50 °C and 1 min extension at 70 °C. The final extension at 72 °C was for 8 min. The program was run in a PTC-200 Thermocycler (MJ Research). Samples were checked by electrophoresis on a 2% agarose gel and purified (Qiagene, QIAquick PCR Purification Kit). Sequencing was performed on an ABI 3730 sequencer (Applied Biosystems, CA, USA). The sequences obtained were analyzed with Seqman 5.51 (DNASTAR for MacOSx), visually corrected, analyzed through GenBank BLAST and aligned in Megalign (DNASTAR for MacOSx) with related sequences available in GenBank. Sequences obtained were deposited into the GenBank database, GenBank accession numbers for all the strains sequenced can be found in Tables 1 and 2. Phylogenetic analysis employed PAUP 4.0b 10 with neighbor joining analysis.
2.1.3. Luminex analysis
2.1.3.1. Region of study and primer design
The region elected for primer and probe design was the D1D2 domain of the large subunit rRNA. The choice was based on the relevant presence of D1D2 sequences in the GenBank database and on the variability of the region, which permits inter-specific discrimination for the species of interest (Daugbjerg et al., 2000; Hirashita et al., 2000; Guillou et al., 2002; De Salas et al., 2003, 2004a,b; Murray et al., 2005; Haywood et al., 2004). Data present in GenBank showed also intraspecific variability for some species (Scrippsiella trochoidea AY628427, AF042819 and AF260393).
Universal primers D1R and D2C (Table 4) were used to generate a “universal” amplicon (length range from 550 to 650 bp according to the species). In addition four “specific” amplicons (Table 5) were produced in a multiplex PCR by specific primers, which were also designed in the D1D2 domain LSU rDNA. The 4 sets of specific primers were designed to enhance amplification of species less represented in environmental samples. The species were Prorocentrum minimum, Prorocentrum rhatymum, Prorocentrum micans, Prorocentrum mexicanum, S. trochoidea and Protoceratium reticulatum. The amplicon lengths were, respectively, 165 bp (minimum), 290 bp (rhatmicmex), 440 bp (Scripp) and 550 bp (Protoce) long (Table 5). Primer sequences, species amplified and related information are in Table 5. Universal and specific PCR products were both biotinylated (all reverse primers had a biotin moiety) and hybridized with the probes in Table 6, which were previously conjugated to carboxylated microspheres.
Table 5.
List of specific primers designed
| Primer name; spp. amplified | Primer sequence; primer length | Melting T; G/C%; Sec. struct. |
|---|---|---|
| Scripp F; all spp. in the Scrippsiella complex | GAATTGTAGTCTGGAGATGTACCAC; 25 bp | 61.5 °C; 44%; weak |
| Scripp R | BioCTGAAGTTTTCCCCAGTTGC; 20 bp | 63.5 °C; 50%; weak |
| Protoce F; Protoceratium reticulatum | ATGGCGAATGAAGAAGGAGT; 20 bp | 62.5 °C; 45%; none |
| Protoce R | BioGATCCACAAGCTAAATCTGAACCT; 24 bp | 63.3 °C; 41.67%; very weak |
| Minimum F; Prorocentrum minimum | GGGTCATGGTAGCTCGTCTA; 20 bp | 61.7 °C; 55%; very weak |
| Minimum R | BioCGTCTTTGTGTCAGGGAAAT; 20 bp | 61.5 °C; 45%; none |
| Rhatmicmex F; Prorocentrum rhathymum, micans and mexicanum | CTTGGCGAGATTGTCATACG; 20bp | 63.2 °C; 50%; none |
| Rhatmicmex R | BioCGTCTATGTGTCAGGGAAGC; 20 bp | 62.3 °C; 55%; none |
Table 6.
List of Luminex probes designed
| Species name; probe name; probe amount | Probe sequence; probe length | Melting T; G/C%; secondary structcure; ΔG |
|---|---|---|
| Heterosigma akashiwo; (HA1); 0.35 nm | GTTCCGCGGGAAATGTTCAGTG; 22 bp | 71.4 °C; 54.5%; moderate; −6.7 |
| Karlodinium micrum; (KM2); 0.35 nm | AGCATGACGCGCACTTTGTTTCTC; 24 bp | 72 °C; 50%; none; −6.7 |
| Karenia brevis; (430 brevis); 0.35 nm | TGTTGTCTAAGGTGATAGCTTGC; 23 bp | 62 °C; 43.4%; very weak; −8.5 |
| Scrippsiella trochoidea; (Scripps); 0.35 nm | AGTAAGTCTTGAACAGGACATGCG; 24 bp | 65.2 °C; 45.8%; weak; −10.1 |
| Karenia mikimotoi; (530 mikimotoi); 0.35 nm | CGCTTCCGAGTGACTGAATG; 20 bp | 65.8 °C; 55%; very weak; −6.9 |
| Heterocapsa triquetra; (HT7bis); 0.35 nm | GCATTGTGTCTTCACACCCCTG; 22 bp | 68.8 °C; 54.5%; moderate; −9.7 |
| Alexandrium catenella, Alexandrium tamarense; (AC8); 0.35 nm | GGGTTTTGGCTGCAAGTGCAA; 21 bp | 71.1 °C; 52.3%; weak; −8.8 |
| Prorocentrum micans; (Pmic); 0.2 nm | AGTGCTGCTTGATCCTGTGTTG; 22 bp | 66.5 °C; 50%; none; −7 |
| Prorocentrum minimum; (PI3); 0.35 nm | GCAGTGTCCTTGGCATTCTGGA; 22 bp | 70.5 °C; 54.5%; weak; −8.2 |
| Prorocentrum lima; (Plim); 0.2 nm | GACGAATATGTCTGGGTGCATC; 22 bp | 65.3 C; 50%; weak; −8.1 |
| Prorocentrum hoffmannianum; (Phoff); 0.2 nm | ACGAAGGTGCCTGGTCGCAT; 20 bp | 71.2 C; 60%; weak; −10.1 |
| Prorocentrum mexicanum; (PE4); 0.35 nm | GTCTTCGGGTGGGCGAATGTG; 21 bp | 72.8 C; 61.9%; moderate; −6.6 |
| Prorocentrum rhathymum; (PH5); 0.35 nm | GTCTTCGGGCGGGTGAATGTG; 21 bp | 72.8 C; 61.9%; very weak; −6.6 |
| Protoceratium reticulatum; (PR6); 0.35 nm | GTGAATGCGCAATGTTGCTTG; 21 bp | 72.8 C; 61.9%; very weak; −6.6 |
2.1.3.2. Probe design
Fourteen probes were designed based on species sequences (Table 6). Sequences were obtained from one or more strains for each species and compared with related GenBank sequences in sequence alignments obtained with Megalign Program (DNAStar).
Specific parameters of the probe sequences were analyzed with the Programs Oligo (Mol. Biol. Ins.) and Mac Vector (Oxford Molec.) to assess probe functionality. The chosen probes had lengths ranging from 20 to 25 bp, with a G/C ratio between 43.4 and 61.9%. Secondary structure was avoided, when possible, and was never more than moderate, according to Sigma-Genosys DNA calculations (http://www.sigma-genosys.com/calc/DNACalc.asp). Following Luminex Corporation's suggestions (Dunbar, S.A., personal communication), shorter probes (20-21 bp) were favored for species with a low number of mismatches in the probe sequence in order to ensure adequate sequence discrimination. When the number of mismatches and the consequent specificity were higher, slightly longer probes (23-24) were used to achieve larger signals. Also higher melting temperatures were favored to obtain stricter specificity. Temperatures ranged from 62 to 72.8 °C with a ΔG (free energy of reaction) from −6.6 to −10.1. The number of mismatches with the closest species was at least two. The mismatches were localized in the center of the probe (Dunbar, 2006) in order to obtain a maximum destabilizing effect. All the probe sequences were analyzed through GenBank BLAST for specificity.
The probes were synthesized by IDT Technologies with a 5′ Amino Modifier C12 that allows for covalent binding to the carboxyl groups on the microsphere's surface. The probes were initially designed for amplicons generated between Universal primers D1R and D2C. The binding site within the amplicon was in the second half of the sequence, near the 3′ end, to avoid possible interference of the secondary structure. This position was maintained when the specific primers were used, designing the additional primers around the existing probes.
All the probes were species specific with the exception of S. trochoidea probe, which is a cluster probe. Due to the existence of 3 different GenBank sequences for this species and to the high number of different strains found in the environment, the probe was designed to include voucher CCMP 1735 and isolates FIU 16, FIU 26 and FIU 30.
2.1.3.3. Coupling reaction
The coupling reaction followed a carbodiimide method (Fulton et al., 1997) with slight modifications (Diaz and Fell, 2004). Multianalyte carboxylated microspheres were purchased from MiraiBio (Alameda, CA, USA).
The beads (2.5 × 10⁶ in number) were re-suspended by vortex and sonication for 20 s and centrifuged at 13,000 rpm for 2.5 min. The re-suspension of the pellet was in 50 μl of 0.1 M MES [2-(N-morpholino)ethanesulfonic acid; Sigma], pH 4.5. Variable amounts of the probe and 2.5 μl of a 10mg/ml solution of EDC [1-ethyl-3-(3-dimethylaminopropyl)carbodiimidehydrochloride; Pierce] were added. After vortexing and incubating the beads for 30 min in the dark, at room temperature, 2.5 μl of the EDC solution were added again, followed by a second incubation (room temperature for 30 min in the dark). Two wash steps in 500 μl of 0.02% Tween 20 and in 500 μl of 0.1% SDS, respectively, were carried out with a microcentrifugation at 13,000 rpm for 2 min to pellet the beads after each wash. Finally the beads were resuspended in 50 μl of TE, pH 8, to a final concentration of 5 × 10⁴ beads/μl. The amount of probe in the coupling reactions was optimized for each microshere set and ranged from 0.2 to 0.35 nmol (Table 6). Conjugated microspheres were stored in the dark at 5 °C. Following Luminex recommended procedures, three of the most represented probes (430 brevis, 530 mikimotoi and Scripps; Table 6) were assessed in a coupling verification test where biotinylated oligonucleotides, which represented the reverse and complement of each probe, were used in place of biotinylated amplicons.
2.1.3.4. PCR amplifications prior hybridization
Prior to hybridization two parallel amplifications were performed: a singleplex with universal primers (Table 4) and a multiplex with specific primers (Table 5). Separate amplifications were required due to the production of random amplicons when universal and specific primers were used in a combined reaction.
Both PCR mixtures contained 7 μl of buffer (15 mM Mg2Cl2), 2.5 μl dNTPs (10 mM) and 2.5 units of polymerase. In the 4 primer sets multiplex, however, primer concentration was 7.5 pmol per each primer, in contrast with 20 pmol per each primer utilized in the singleplex. Template amount was based on the genomic DNA concentration. Final DNA concentration varied from 10 to 40 ng. Sterile water was added to bring the mixture to final volume (50 μl). All the reverse primers had a biotin moiety at the 5′ end to allow labeling of the biotinylated oligonucleotides through a reporter molecule (streptavidin-R-phycoerythrin).
The program consisted of one cycle of denaturation at 95 °C for 10 min followed by 40 cycles of 30 s denaturation at 95 °C, 30 s annealing at 50 °C and 1 min extension at 69 °C. The final extension at 69 °C was for 30 min. Samples were checked by electrophoresis on a 2% agarose gel, but no purification step was carried out.
2.1.3.5. Hybridization assay
The hybridization assay was performed in 3 M TMAC (tetramethyl ammonium chloride) solution (50 mM Tris, pH 8.0/4 mM EDTA, pH 8.0/0.1% Sarkosyl). This salt stabilizes ATs pairs sensibility to melting temperature, so that probes with different base composition can work uniformly under the same hybridization conditions.
Duplicate samples containing 10 μl of biotinylated amplicon were diluted in 7 μl of 1 × TE buffer (pH 8) and 33 μl of 1.5 × TMAC solution containing a bead mixture of circa 5000 microspheres for each set of probes. The reaction mixture was incubated for 10 min at 95 °C with a PTC-200 Thermocycler (MJ Research). This step was followed by a 40 min incubation at 55 °C. The beads were pelleted by centrifugation at 2250 rpm for 3 min. Incubation at 55 °C for 5 min followed careful removal of the supernatant. Subsequently 300 ng streptavidin-R-phycoerythrin (Invitrogen) from a 1 mg/ml stock solution were diluted in 75 μl of 1 × TMAC and added to each sample. The amplicons were then labeled for 5 min at 55 °C. After a second centrifugation (2250 rpm for 3 min), the supernatant was removed and 75 μl of 1 × TMAC were again added to wash unbound label.
2.1.3.6. Detection analysis
The samples were run on a Luminex 100 analyzer where 100 microspheres of each set were analyzed. The median fluorescence intensity (MFI) values were calculated by Luminex 1.7 proprietary software (on a PC interfacing the Luminex analyzer) as a direct statistical average of each bead analyzed in a sample. A blank (no target DNA) and a set of positive and negative controls were included in the assay. All samples were run in duplicates. The signal obtained from a blank sample was subtracted from the MFI value. A response was considered positive when the corrected MFI value (MFI value after subtraction of the blank value) was at least twice the blank value (Diaz and Fell, 2005).
2.1.3.6.1. Probe singleplex
Each probe was initially tested in singleplex experiments against the appropriate target (specific DNA from a cultured organism) to assess probe design and sensitivity. Probes that did not show a positive signal with the appropriate target (approximately 7.1% of all the designed probes) were modified by adding a few nucleotides on each end or replaced when modifications would drastically change the probe structure. Serial dilutions of genomic DNA and of biotinylated amplicons and serial dilutions of single cultures before filtration were used to determine probe sensitivity.
2.1.3.6.2. Probe multiplex
Probes with a positive evaluation in the singleplex test were assessed in multiplex experiments for possible cross-reactivity. All 14 probes were tested against samples containing individual target DNAs. Probes that showed cross-reactivity (positive response for non specific target) were altered or replaced (approximately 7.1% of all the designed probes).
2.1.3.6.3. Probe and target multiplex
As a final step, probes were tested against amplicons that contained more than one target DNA. These amplicons were first obtained from PCR where DNA templates, extracted from different species, were added to the PCR mix. Subsequently, different cultures were used to spike seawater samples. The resulting mixture was filtered, extracted, amplified and Luminex-tested.
2.1.4. Field studies
Surface seawater samples were collected in Florida waters from Pine Island Sound in July 2006 and off Charlotte Harbor in October 2006. The latter samples were taken during a Florida Monitoring and Event Response for Harmful Algal Blooms (MERHAB) Cruise. Specific locations for both cruises and microscopic counts for the MERHAB Cruises are reported in Tables 7 and 8. Microscopic counts for samples from Pine Island Sound were for Karenia sp. and ranged from 0 cell/ml at station 4 to 95 cell/ml at station 10. The amount of biotinylated amplicon in the hybridization assay was increased to 17 μl when field samples were analyzed.
3. Results
3.1. HAB community diversity
Based on culture sequences we constructed a phylogenetic tree that comprised specimen vouchers (from CCMP, from the University of Texas and from Florida International University), strains isolated in Florida waters and GenBank sequences of related species. Chattonella subsalsa and Heterosigma akashiwo, two HAB raphidophytes found in Florida waters, were used as the outgroup. The goal was to provide a phylogenetic estimate of the ecological diversity among taxa, which is an essential step for probe design. Therefore, fourteen different dinoflagellate genera (Akashiwo, Alexandrium, Amphidinium, Cachonina, Ceratium, Fragilidium, Gonyaulax, Gymnodinium, Heterocapsa, Karenia, Karlodinium, Prorocentrum, Protoceratium and Scrippsiella) were analyzed.
Due to the large size, the phylogenetic tree was depicted in Fig. 1 as a stick tree, divided into clusters, which were represented in subsequent figures (Figs. 2–5). In addition to cluster names, single strain names of sequences, which were unrelated to any of the clusters, can be found in Fig. 1. Cultures from CCMP, from the University of Texas and from Florida International University were reported as listed in those collections (the names Katodinium rotondatum and Lyngulodinium polyedra were replaced with their updated synonyms Heterocapsa rotundata and Gonyaulax polyedra) (see Table 1). Isolates from Florida waters appear as FIU (Florida International University) followed by the isolation numbers (see Table 2). GenBank accession numbers for all the strains sequenced can be found in Tables 1 and 2.
Fig. 1.
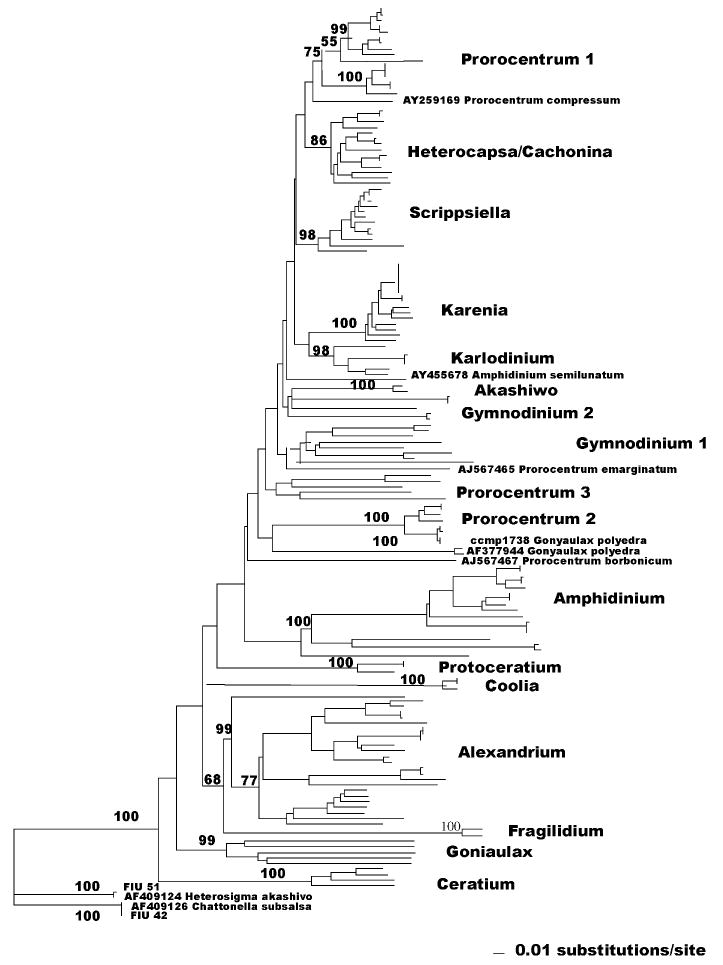
LSU D1D2 rRNA phylogenetic stick tree comprising CCMP specimen vouchers, FL waters isolates and related GenBank sequences. The tree was constructed with neighbor joining analysis. Bootstrap values are reported on branches when higher than 50%. Clades are shown to indicate their orientation within lineages (see Figs. 2–5).
Fig. 2.
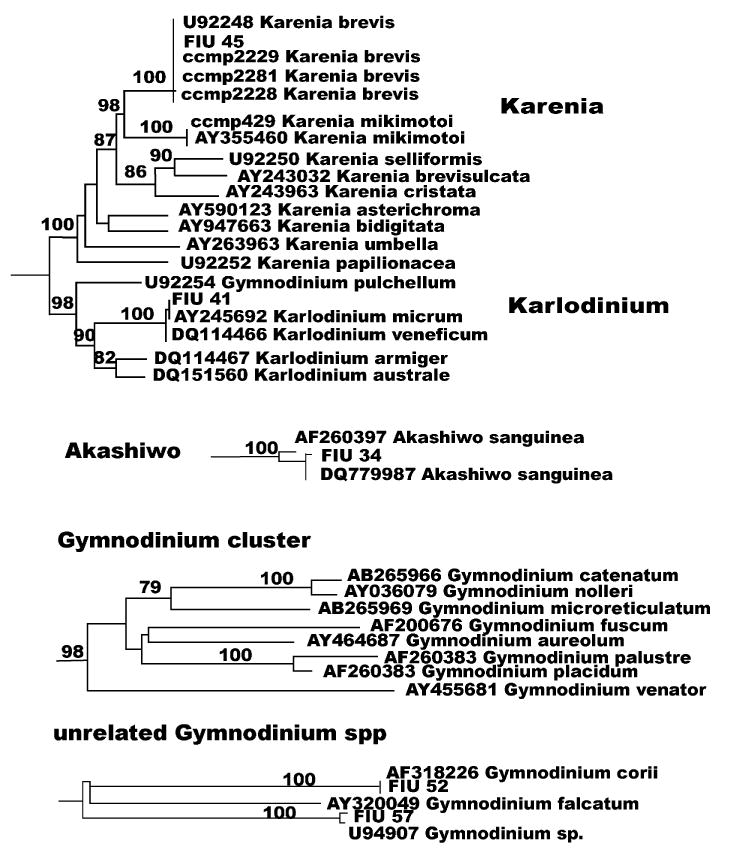
Karenia, Karlodinium, Akashiwo and Gymnodinium clusters and unrelated Gymodinium species as from Fig. 1.
Fig. 5.
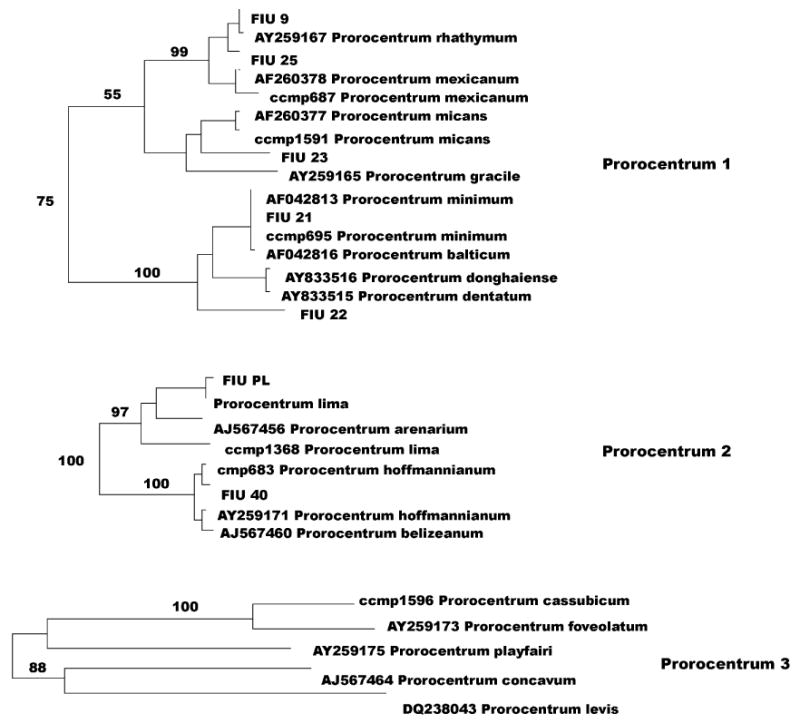
Prorocentrum 1, 2 and 3 clusters as from Fig. 1.
Without taking in account the three voucher specimens that lack a D1D2 GenBank submission (Heterocapsa pygmaea, Ceratium longipes and Prorocentrum cassubicum), only 65% of the remaining cultures had their collection label confirmed. For all the other voucher cultures, our sequences aligned with a species different from the collection label, or did not find any match in the GenBank database. This lack of confirmation for voucher cultures can possibly be explained by misidentification or mislabeling. A third hypothesis could be that some cultures in collection represent a mixture of similar species and only one of them was successfully extracted or amplified.
The “unique” sequences in the tree, which did not match any GenBank submission, comprised 43.6% of the total number of different genotypes, demonstrating the existence of a large and still unexplored biodiversity among taxa. Further analyses in different genes should evaluate the possibility that these sequences represent species already described, but not yet sequenced in the D1D2 region, such as species in the genera Scrippsiella (Gottschling et al., 2005) and Heterocapsa (Yoshida et al., 2003). Sequences that differed by only a few bp (one to four) from GenBank submissions were not taken into account as separate species, with the assumption that the mismatches were due to differences in sequencing procedures.
3.1.1. Unarmored dinoflagellates
Among the unarmored or naked dinoflagellates (species lacking thecal plates) we analyzed the following genera: Karenia, Karlodnium, Gymnodinium, Akashiwo and Amphidinium. The genera Karenia and Karlodinium were created after review of the genus Gymnodinium (Daugbjerg et al., 2000) and they both are robust monophyletic clusters as shown in Fig. 1. The two genera appear to cluster together, although with low bootstrap values (Fig. 2, bootstrap values lower than 50% are not reported). In recent years, several new species of Karenia were described, such as Karenia asterichroma (De Salas et al., 2004a), Karenia umbella (De Salas et al., 2004b), Karenia papilionacea, Karenia bidigitata and Karenia selliformis (Haywood et al., 2004), Karenia cristata and Karenia bicuneiformis (Botes et al., 2003). The only available cultures are, however,K. brevis and Karenia mikimotoi. In the Karenia cluster three strains listed by CCMP as brevis, FIU 45 and K. mikimotoi CCMP 429 confirmed the respective GenBank sequences. In the Karlodinium cluster, isolate FIU 41 is identical to Karlodinium micrum AY245692. One Gymnodinium species (Gymnodinium pulchellum) appears strictly related to the Karlodinium cluster (98% bootstrap; Fig. 2). The closeness of Karenia species, Karlodinium species and G. pulchellum was morphologically confirmed by the presence of a common ultra-structural character, an intercingular tubular structure of the cingulum (Haywood et al., 2004). In contrast, the remaining Gymnodinium species appear in a cluster with high bootstrap value (98%; Fig. 2), but also in three unrelated branches (Gymnodinium corii, G. falcatum and Gymnodinium sp.), which include FIU 52, a perfect match for G. corii AF318226, and FIU 57, a close match for GenBank U94907 Gymnodinium sp. The Akashiwo genus (Fig. 2) contains only one species, Akashiwo sanguinea. Isolate FIU 34 is one bp different from one of the two GenBank sequences submitted for this species (DQ779987) and more than ten bp different from the other (AF2603397).
The genus Amphidinium (Fig. 3) is a compact cluster, which reaches a bootstrap value of 100% without inclusion of the species Amphidinium incoloratum, 58% with inclusion. The species A. semilunatum, however, stands separate with no apparent relation to this group (Fig. 1). Our sequence for Amphidinium operculatum CCMP 1344 (Fig. 3) did not match any sequence in GenBank and clustered between Amphidinium eilatiensis and Amphidinium carterae (100% bootstrap value), almost identical to isolate FIU 2. In contrast, A. operculatum CCMP 120, identical to isolate FIU 14, matched almost perfectly (one mismatch) the GenBank sequence of a different species, AY460587 Amphidinium gibbosum (Fig. 3). Also CCMP 1342, labeled as Amphidinium massartii, did not match AAY455670 A. massartii and showed a sequence identical to AAF260381 Amphidinium klebsii (Fig. 3). Strain FIU 32 aligned in a clade with A. klebsii and A. massartii (82% bootstrap value). A. carterae CCMP 1314 confirmed GenBank sequence AF260380 for the same species.
Fig. 3.
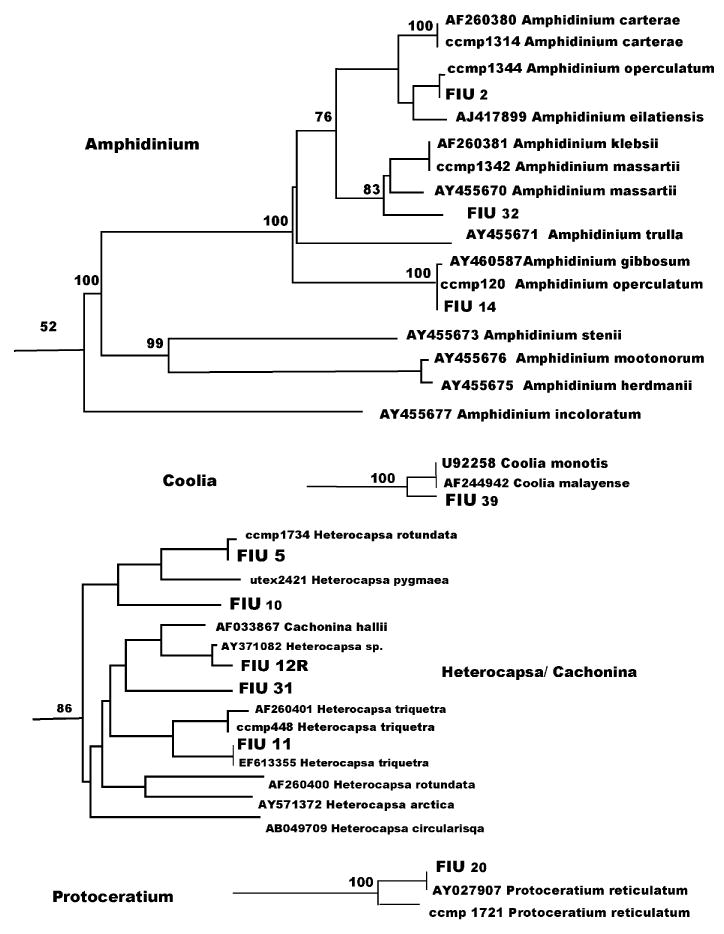
Amphidinium, Coolia, Heterocapsa/Cachonina and Protoceratium clusters as from Fig. 1.
3.1.2. Armored dinoflagellates
The armored dinoflagellate genera examined were: Coolia, Cachonina, Heterocapsa, Protoceratium, Fragilidium, Alexandrium, Ceratium, Gonyaulax, Scrippsiella and Prorocentrum. The genus Coolia (Fig. 3), contains two species identical in their D1D2 sequence (Coolia monotis and Coolia malayense). Isolate FIU 39 is strictly related to Coolia monotis/Coolia malayense (100%), but represents a different species. Cachonina hallii clusters within the genus Heterocapsa (Fig. 3). Bootstrap value for the whole group is 86%. CCMP 1734 H. rotundata (Fig. 3), almost a match for isolate FIU 5, is considerably distant from H. rotundata GenBank AF260400. CCMP 448 Heterocapsa triquetra is a close match for H. triquetra GenBank AF260401, while isolate FIU 11 is identical to the other submission for the same species, EF613355. Isolates FIU 10, FIU 31 and FIU 12R did not align with any GenBank sequence, showing a high biodiversity in this cluster. H. pygmaea UTEX 2421 also clustered within the genus. GenBank sequences X61735 and X61736 for H. pygmaea included only the D1 domain and were not used in our tree.
In the Protoceratium cluster (Fig. 3), CCMP 1721 P. reticulatum (Fig. 3) differed considerably from GenBank sequence AY027907 P. reticulatum, which was a perfect match for isolate FIU 20. The genus Protoceratium, as well as Fragilidium, Alexandrium, Ceratium and Gonyaulax, belong to the Gonyaulacales, a morphologically diverse order that lacks a unique morphological character common to all the taxa. The only noticeable relationship among these genera is between Alexandrium and Fragilidium with a 68% bootstrap value (Figs. 1 and 4). The two genera also share the same plate pattern (Fensome et al., 1993). In the Fragilidium cluster (Fig. 4) FIU 49, which is related to Fragilidium subglobosum AF033868 (bootstrap100%), represents a different species in this monospecific genus. Alexandrium is a well-supported group (bootstrap 99%) that contains Ceratium furca, a species related to Alexandrium tropicale (Fig. 4). Our sequence of CCMP 1493 Alexandrium tamarense was a perfect match for AB088229 Alexandrium catenella, one of the species in the A. tamarense species complex (John et al., 2005). Four other Ceratium species cluster with 100% bootstrap support (Fig. 4) including C. longipes CCMP 1770. (There are no D1D2 sequence in GenBank for this species.) Gonyaulax (Fig. 4) is a split genus with five well-supported species in a clade and the species G. polyedra standing separately (Fig. 1). Our sequence for CCMP 1738 G. polyedra (Fig. 1) was related, but not identical to AF377994 (100%).
Fig. 4.
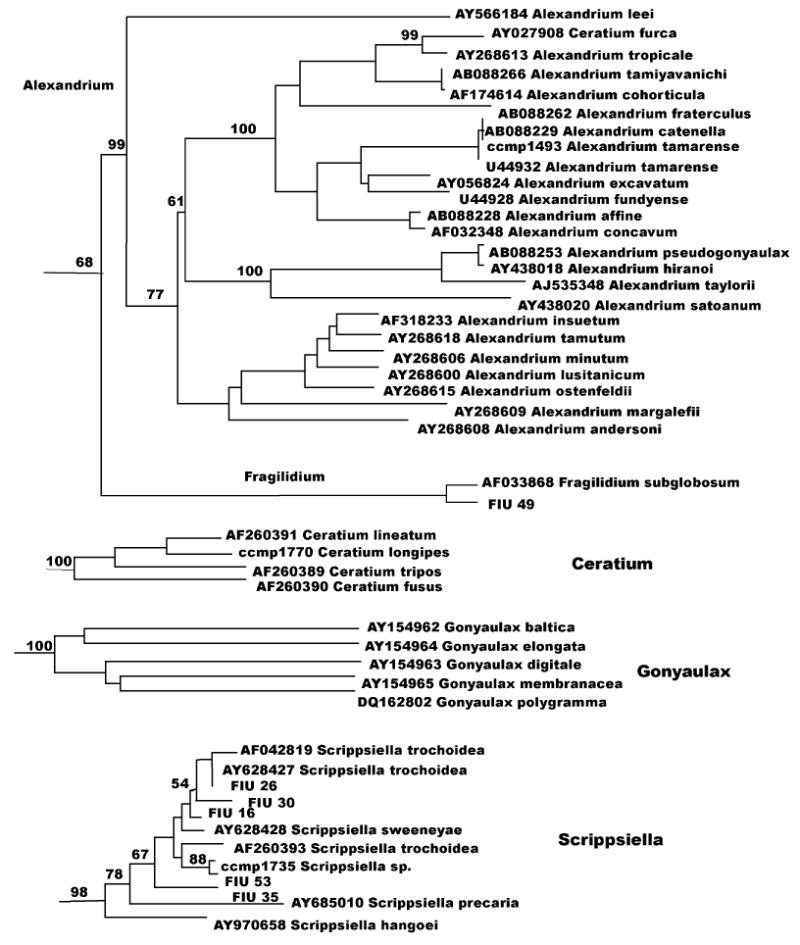
Alexandrium, Fragilidium, Ceratium, Gonyaulax and Scrippsiella clusters as from Fig. 1.
Species belonging to Scrippsiella (Fig. 4), a cyst forming genus, group in a well supported cluster (bootstrap 98%). S. trochoidea (Fig. 4) is a particular case, with three different GenBank sequences (AY628427, AF042819 and AF260393). Our sequence analysis for CCMP 1735, labeled as S. trochoidea, generated a sequence different from any of the three GenBank submissions and from any other sequence in the Scrippsiella cluster. In addition, sequence analysis of Florida waters isolates showed one strain with an identical sequence to S. trochoidea AY628427 and four strains with a different sequence from any other species. Intraspecific diversity in the ITS regions was also reported for this species (Montresor et al., 2003).
A peculiar situation is reflected in the genus Prorocentrum (Fig. 5). According to previous LSU (Zardoya et al., 1995) and SSU (Grzebyc and Sako, 1998) analyses, Prorocentrum species are divided in two distinct clusters: one comprising planktonic and bentho-planktonic species (P. mexicanum, micans, minimum), the other including strictly benthic species (P. lima, hoffmannianum). Although this dichotomy appears in our phylogenetic representation (see Prorocentrum 1 and Prorocentrum 2; Fig. 5), the situation is complicated by the presence of a third cluster (Prorocentrum 3; Fig. 5) including additional species such as P. cassubicum, Prorocentrum levis, Prorocentrum foveolatum, Prorocentrum playfar-iii and Prorocentrum concavum. Furthermore, three species (Prorocentrum emarginatum, Prorocentrum borbonicum and Prorocentrum compressum) appear to be unrelated to any of the three groups (Fig. 1). Taxonomy in this genus has not, however, progressed uniformly since the first morphological description of the species. The AlgaeBase database reports 48 species for the genus Prorocentrum, several of which were described based on morphology (Faust, 1990, 1993a,b, 1994, 1997); the GenBank database contains, however, sequences for only 25 different species, two of which undescribed (P. donggang and P. tainan). Also, identical D1D2 sequences were deposited for different species (P. minimum/Prorocentrum balticum, Prorocentrum donghiaense/Prorocentrum dentatum, Prorocentrum hoffmannianum/Prorocentrum belizeanum).
Among collection vouchers, FIU PL Prorocentrum lima was identical to GenBank sequence L38634 P. lima, while P. lima CCMP 1368 (Fig. 5, Prorocentrum 2), which was 19 bp different, represented a different species. CCMP vouchers for P. hoffmannianum, P. mexicanum, P. micans and P. minimum differed only a few bp (one to four) from the corresponding GenBank sequences (Fig. 5, Prorocentrum 1 and 2). P. cassubicum UTEX 1596 (from the University of Texas algae collection), species not present in the GenBank database, strictly clustered with P. foveolatum AY259173 in the clade Prorocentrum 3.
Among environmental isolates, FIU 21 was identical to P. minimum AF042813, FIU 9 differed by one bp from Prorocentrum rhathymum AY259167 and FIU 40 differed by three bp from P. hoffmannianum, AY259171. FIU 22 clusters with P. minimum/balticum and Prorocentrum donghaiense/dentatum (100 boostrap value), FIU 23 clusters with P. micans and Prorocentrum gracile (100) and FIU 25 aligns very closely to P. rhathymum (89), but they all represent different species.
Lastly, in the outgroup (Fig. 1), the raphidophyte species C. subsalsa matched perfectly with FIU 42. Isolate FIU 51 differed by one bp from the other raphidophyte species, H. akashiwo.
3.2. Luminex results
3.2.1. Lab samples
3.2.1.1. Probe singleplex
Universal primers and species-specific sets of primers (Tables 4 and 5) produced amplicons that gave a Luminex positive response when tested against a single appropriate target DNA. Each of the 14 probes designed showed sensitivity to target DNA with MFI corrected values ranging from 420 (Scrippsiella) to 1300 (P. hoffmannianum). Similar wide-ranged results are not unusual in Luminex assays (Diaz and Fell, 2005). Several theories (Graves, 1999; Southern et al., 1999; Inacio et al., 2003; Peplies et al., 2003; Diaz and Fell, 2005) have been elaborated to explain their variability based mainly on the probe itself (base composition, base stacking, steric hindrance, kinetics, hairpin structure, position of the binding site) or on possible secondary structure in the denatured target DNA, but the mechanisms have not been clarified. Differences were also found in the intensity of the signal when probes were tested against different strains of the same target (Fig. 6). This kind of heterogeneity is probably due to differences in DNA quality and copy numbers among strains. Serial dilutions of genomic DNA and amplicons, as well as serial dilution of single cultures before filtration, also showed differences in signal response. In Fig. 7 are reported the results for culture dilutions of P. micans.
Fig. 6.
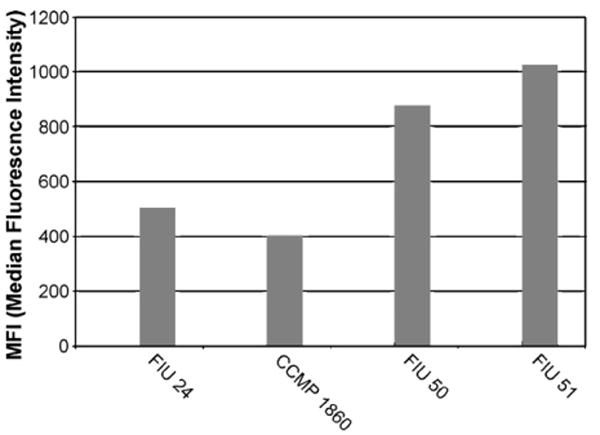
Probe singleplex with different strains of the same target (Heterosigma akashiwo).
Fig. 7.
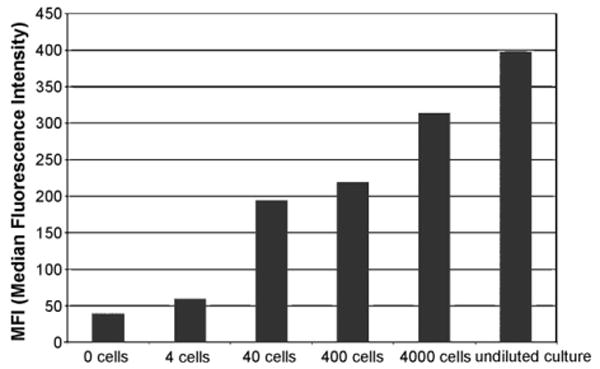
Probe singleplex with culture dilutions of the same target (Prorocentrum micans).
3.2.1.2. Probe multiplex
Multiplexing of the probes was conducted by testing all 14 probes against single species samples (Fig. 8). A slight decrease in the signal, compared to the singleplex results, occurred for the majority of the probes. Heterogeneity among probes can be noticed in the same trend shown in probe singleplex results (Scrippsiella 200/P. hoffmannianum 950).
Fig. 8.
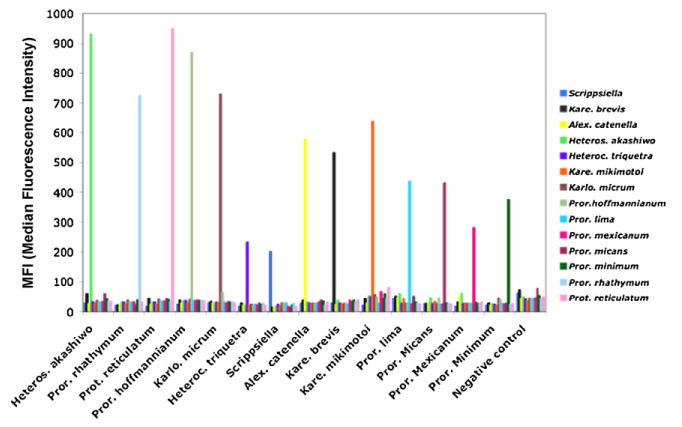
Probe multiplex with 14 probes against single-species samples.
3.2.1.3. Probe and target multiplex
Initially PCR products generated by Universal primers were used in Luminex tests on probe and target multiplexing. Use of universal primers allows for a simple and less expensive procedure, avoiding multiple-primers-PCRs and parallel amplifications.
A first stage of multi-probe-multi-target tests were performed adding DNA from different species in the PCR mix. In experiments with uniform amounts of DNA added to the PCR mix, the Luminex responses were consistently positive (Fig. 9). In spite of employing equal amounts of DNA, however, the difference in MFI values, for the two species contained in each sample, varied greatly from 50 (H. akashiwo 1150, P. reticulatum 1200) up to 850 MFI (H. akashiwo 1100, P. mexicanum 250). Also, the MFI absolute values for each species differed noticeably, in some cases, when compared to the MFI values for the same species tested singularly (K. mikimotoi 300 Fig. 9 and 650 Fig. 8). The difference always consisted in a reduced signal for the multi target samples. PCR mixtures with non-uniform amounts of DNA produced, instead, inconsistent Luminex results where species with smaller amount of target were generally “overwhelmed” by the most represented species and often went undetected (data not shown).
Fig. 9.

Probe and target multiplex with 9 probes and 2-species samples containing uniform DNA amounts for each species.
The second stage, in the multi-probe-multi-target testing, was performed spiking a water sample with multiple cultures, followed by filtration and DNA extraction. Luminex results with these samples were also variable. In this case, the inconsistency occurred even when the number of filtered cells per species was approximately identical. Differences in the extracted DNA quality and concentration for the different cultures, even within the same extraction sample, were probably responsible for this situation.
To improve and stabilize Luminex response in multi-probe-multi-target testing, a multiple-primers-PCR, which employed specific sets of primers, was added to the universal primers singleplex. Performing amplifications with specific primers increased PCR yield and specificity, for the species less represented in the sample, and allowed their detection in Luminex analyses. Specific primer sets (Table 5) were designed for a selected group of species prevalent in Florida waters, which included species numerically less represented in the environment, during HABs, and species unsuitable for multiplex reactions due to their sequence structure. Five different species (P. minimum, P. rhathymum, P. micans, P. mexicanum and P. reticulatum) and all the strains belonging to the S. trochoidea cluster were detected using the four sets of primers (Table 5). Forward and reverse specific sets generated different size amplicons, a feature that allowed a pre-Luminex PCR validation by a minigel electrophoresis (Fig. 10) where different size bands marked the presence of the four different amplicons. As previously reported, specific amplicons were used in Luminex tests with the same probes designed for universal amplicons. Hybridization can be improved choosing a probe-binding site close to the 3′ end of the amplicon sequence, to minimize the potential formation of secondary structures between the formed duplex and the biotinylated end. For this reason, the design of specific primers took into account the position of the binding site that was maintained as in the amplicons generated with universal primers or improved (moved closer to the 3′ end). The four sets of specific primers gave positive Luminex results when tested in DNA mix with random amount of DNA, as well as in cell mix with a random number of cells (Fig. 11).
Fig. 10.
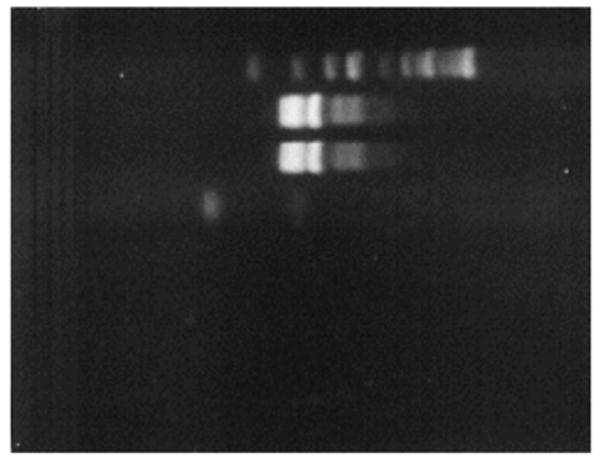
Minigel electrophoresis showing different size amplicons generated by specific primers sets.
Fig. 11.
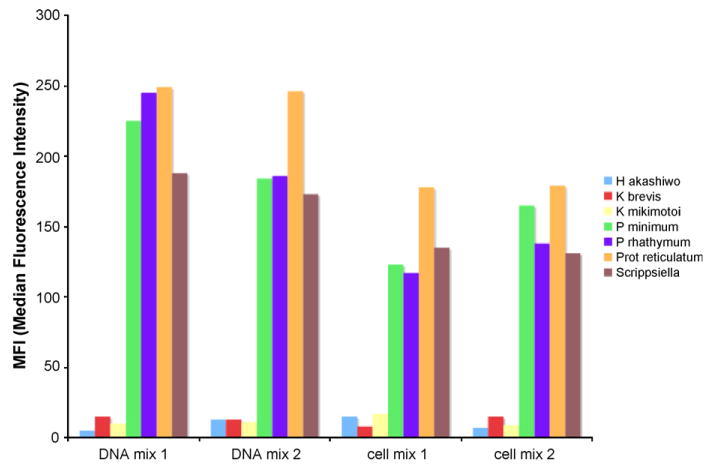
Probe and target multiplex with 7 probes and 4-species amplicons generated with species specific primers. The first two samples were originated from a PCR DNA mix with random amount of DNA for each of the 4 species. For the second two samples a cell mix containing a random number of cells for each species was extracted and amplified.
3.2.2. Field samples
In our initial field trials, environmental samples were collected in Florida waters from Pine Island Sound in July 2006 and off Charlotte Harbor in October 2006. The latter samples were taken during a Florida Monitoring and Event Response for Harmful Algal Blooms (MERHAB) Cruise. Surface seawater samples were analyzed with the Luminex system (Figs. 12 and 13). The results showed the co-existence and dominance of two or more species of Karenia during toxic blooms in Florida waters. Four out of the nine Karenia species described are presently reported and regularly counted in Florida waters: K. brevis, K. mikimotoi, K. papilionacea and K. selliformis. In the present study we were able to design species-specific probes for the only two species available in culture: K. brevis and K. mikimotoi.
Fig. 12.
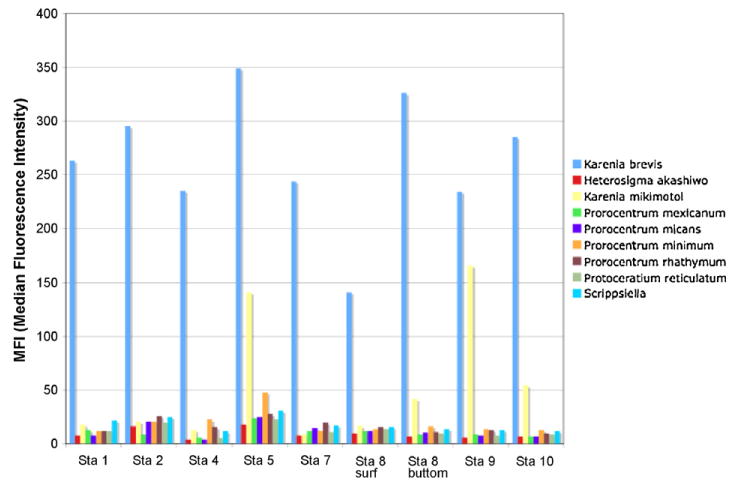
Probe multiplex on environmental samples collected in Florida waters from Pine Island Sound in July 2006.
Fig. 13.
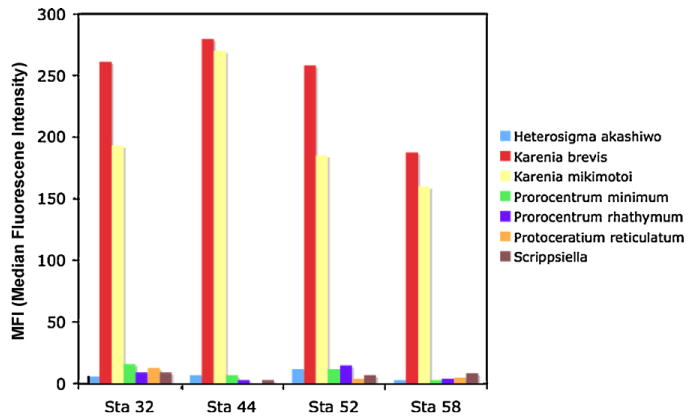
Probe multiplex on environmental samples collected off Charlotte Harbor in October 2006 (MERHAB Cruise).
Microscopic counts for Karenia sp. were carried out on samples from Pine Island Sound and ranged from 0 cell/ml at station 4– 95 cells/ml at station 10. As shown in Fig. 12, a positive signal for K. brevis was obtained with the Luminex assay for all the samples analyzed, including station 4. A positive signal for K. mikimotoi was also shown for stations 5 and 9. For the October MERHAB Cruise we have counts at four stations for three different species of Karenia: K. brevis, K. mikimotoi and K. papilionacea (Table 8). Unidentified cells were recorded as Karenia sp. K. brevis was the most abundant species in both assays (Fig. 13 and Table 8). It is interesting to note, however, that, while in the microscopic counts the second biggest group is Karenia sp., the Luminex results reported a positive signal for K. mikimotoi at all stations (Fig. 12), even at station 44 where no cells of K. mikimotoi could be distinguished in the counts (Table 8). A possible explanation might be that cells of K. mikimotoi, even though present at all stations, could not be distinguished through microscopy due to their position on the slide. Design of additional species-specific probes (and potentially primers), when more Karenia species will be available in culture, might also help in solving this problem.
4. Discussion
Our first goal (assessment of HAB community diversity) was accomplished through sequence analysis of specimen vouchers and natural isolates. Label identification was confirmed for the majority of the voucher cultures. However, 35% of the voucher sequences aligned with a species different from the label, or did not find any match in the GenBank database. Misidentification, mislabeling or presence of a mixed culture might be responsible for this situation. The most interesting result was that 43.6% of our total sequence analysis (total number of different genotypes from specimen vouchers and natural isolates) showed a “unique” sequence, which did not match any GenBank submission. These results demonstrate the existence of a large and still unexplored phytoplankton biodiversity. Further analyses in different genes should be considered, however, for these cultures, to establish whether or not they may constitute new species.
Goals 2 and 3 (respectively early detection of HAB species and preliminary field application of the procedures) were realized through a qualitative bead array method based on the use of a flow cytometer (Luminex 100) and color-coded microspheres. For the bead array fourteen probes were designed, based on sequence analysis, for 14 microalgal species and four sets of species specific (or group specific) primers were employed, in addition to the universal primers, to enhance the presence of species of low abundance. The design of these specific primers was the key to success for species detection in analysis of samples, such as environmental samples, that contain multiple species in different concentrations.
Two parallel amplifications, followed by hybridization and Luminex analysis, allowed rapid identification of at least nine species of microalgae independently from their abundance. The singleplex PCR with Universal primers was performed for the detection of K. brevis, K. mikimotoi and H. akashiwo. A parallel multiplex PCR with sets of specific primers was carried out to amplify P. minimum, P. rhathymum, P. micans, P. mexicanum, P. reticulatum and S. trochoidea. The need for two separate PCR reactions is due to the possible production of random PCR amplicons if universal and specific primers, designed in the same gene, are present in the same amplification.
The two parallel amplicons obtained from single and multiplex PCR can be mixed in a single sample before hybridization and Luminex analysis, with consequent reduction in costs and time. If an enhanced signal is required, however, singleplex and multiplex PCR products can be kept separate and can be hybridized and analyzed as two different samples, increasing concentration and consequently signal response. Our LSU sequence analysis showed also sufficient inter-species variability to allow the design of additional species-specific primers for the majority of the species.
K. brevis and K. mikimotoi, did not show sufficient LSU variability to allow species-specific primer design without compromising probe closeness to the reverse primer. Increasing the distance of the probe site from the biotinylated end of the amplicon was avoided since it implied an increased risk of secondary structure formation between binding site and biotinylated end with consequent signal reduction. The regular abundance of the two species in any Florida HAB, however, provides high DNA yield and amplicon production. H. akashiwo does not require specific primers, since it could be detected in universal-primers-generated-amplicons in combination with any other species and with a constantly high MFI value (see Fig. 9, more than 900 MFI).
In recent years several new species of Karenia were described in different geographical locations: K. asterichroma (De Salas et al., 2004a), K. umbella (De Salas et al., 2004b), K. papilionacea, K. bidigitata and K. selliformis (Haywood et al., 2004), K. cristata and K. bicuneiformis (Botes et al., 2003) and K. brevisulcata (Chang, 1999). Unfortunately, the present lack of availability for Karenia cultures other than K. mikimotoi and K. brevis does not permit design of additional species-specific probes (and potentially primers) for the genus. A sequence for these species could be obtained cloning environmental samples and compared with the existing GenBank sequences. Lack of the specific culture, however, would still prevent proper testing of the probe design.
Future efforts should concentrate on an accurate assessment of the genetic variability in LSU and/or other genes of the new Karenia species, in particular K. papilionacea and K. selliformis, which are regularly reported in Florida waters in addition to K. brevis and K. mikimotoi. The acquisition of sequences to compare to the ones presently available in the GenBank database, would enable us to expand and integrate our present method. A different gene, which might offer larger variability and material for higher specificity, might be considered in probe design for the whole genus Karenia. This possibility could eliminate universal primers and replace the parallel amplifications with a single multiplex containing the present four LSU sets of primers and new sets of Karenia species (or group) specific primers. The use of a single PCR reaction would result in considerable reduction of time and costs.
Finally, the multi-format structure of this assay, which permits detection of 100 species at one time, could be advantageously used for additional, simultaneous analysis of phytoplankton community diversity. The method could provide more precise information of the biodiversity before, during and after a toxic bloom, which would contribute to a more comprehensive evaluation of the HAB phenomenon.
Acknowledgments
Funding was provided in part by the NSF-NIEHS Oceans and Human Health Center Program (NSF 0432368 and NIEHS P50 ES12736). Participation in the MERHAB Cruise was courtesy of Dr. Gary Kirkpatrick, Mote Marine Laboratory, Sarasota, FL, USA. Cell counts for the Pine Island Sound samples were provided courtesy of V. Palubok (Mote Marine Laboratory) and for the MERHAB Cruise samples courtesy of R. Pigg.[SS]
References
- Adachi M, Sako Y, Ishida Y. Restriction fragment length polymorphism of ribosomal DNA Internal Transcribed Spacer and 5.8S region in Japanese Alexandrium species (Dinophyceae) J Phycol. 1994;30:857–863. [Google Scholar]
- Balech E. El genero Protoperidinium, Bergh 1881 (Peridinium, Ehrenberg 1831, partim) Revista del Museo Argentino de Ciencias Naturales “Bernardino Rivadavia” Hidrobiologia. 1974;4:1–79. [Google Scholar]
- Balech E. Cuatro especies de Gonyaulax sensu lato, y cosideraciones sobre el genero (Dinoflagellata) Revista del Museo Argentino de Ciencias Naturales “Bernardino Rivadavia” Hidrobiologia. 1977;5:115–143. [Google Scholar]
- Balech E. Redescription of Alexandrium minutum (Dynophyceae) type species of the genus Alexandrium. Phycologia. 1989;28:206–211. [Google Scholar]
- Botes L, Sym SD, Pitcher GC. Karenia cristata sp. nov. and Karenia bicuneiformis sp. nov. (Gymnodiniales, Dinophyceae): two new species from South African coast. Phycologia. 2003;42:563–571. [Google Scholar]
- Bowers HA, Tengs T, Glasgow HB, Jr, Burkholder JM, Rublee PA, Oldach DW. Development of real-time PCR assay for rapid detection of Pfiesteria piscicida and related Dinoflagellates. Appl Environ Microb. 2000;66:4641–4648. doi: 10.1128/aem.66.11.4641-4648.2000. [DOI] [PMC free article] [PubMed] [Google Scholar]
- Brand LE. Nutrition and culture of autotrophic ultraplankton and picoplankton. Can Bull Fish Aquat Sci. 1986;214:205–233. [Google Scholar]
- Cai Q, Li R, Zhen Y, Mi T, Yu Z. Detection of two Prorocentrum species using sandwich hybridization integrated with nuclease protection assay. Harmful Algae. 2004;5:300–309. [Google Scholar]
- Casper ET, Paul JH, Smith MC, Gray M. Detection and quantificaton of the red tide dinoflagellate Karenia brevis by real-time nucleic acid sequence-based amplification. Appl Environ Microb. 2004;70:4727–4732. doi: 10.1128/AEM.70.8.4727-4732.2004. [DOI] [PMC free article] [PubMed] [Google Scholar]
- Casper ET, Patterson SS, Bhanushali P, Farmer A, Smith MC, Fries DP, Paul JH. A handheld NASBA analyzer for the field detection and quantification of Karenia brevis. Harmful Algae. 2007;6:112–118. [Google Scholar]
- Chang FH. Gymnodinium brevisulcatum sp. nov. (Gymnodiales, Dinophyceae), a new species isolated from the 1998 summer toxic bloom in Wellington Harbour, New Zealand. Phycologia. 1999;38:377–384. [Google Scholar]
- D'Onofrio G, Marino D, Bianco L, Busico E, Montresor M. Toward an assessment on the taxonomy of dinoflagellates that produce calcareous cysts (Calciodinelloideae, Dinophyceae): a morphological and molecular approach. J Phycol. 1999;35:1063–1078. [Google Scholar]
- Daugbjerg N, Hansen G, Larsen J, Moestrup Ø. Phylogeny of some of the major genera of dinoflagellates based on ultrastructure and partial LSU rDNA sequence data, including the erection of three new genera of unarmored dinoflagellates. Phycologia. 2000;39:302–317. [Google Scholar]
- De Salas MF, Bolch CJS, Botes L, Nash G, Wright SW, Hallegraeff GM. Takayama Gen. Nov. (Gymnodiales, Dinophyceae), a new genus of unarmored dinoflagellates with sigmoid apical grooves, including he description of two new species. J Phycol. 2003;39:1233–1246. [Google Scholar]
- De Salas MF, Bolch CJS, Hallegraeff GM. Karenia asterichroma sp. nov. (Gymnodiniales, Dynophyceae) a new dinoflagellate species associated with finfish aquaculture mortalities in Tasmania, Australia. Phycologia. 2004a;43:624–631. [Google Scholar]
- De Salas MF, Bolch CJS, Hallegraeff GM. Karenia umbella sp. nov. (Gymnodiniales, dinophyceae), a new, potentially ichthyotoxic dinoflagellate species from Tasmania, Australia. Phycologia. 2004b;43:166–175. [Google Scholar]
- Diaz MR, Fell JW. High-throughput detection of pathogenic yeasts of the genus Trichosporon. J Clin Microbiol. 2004;42:3696–3706. doi: 10.1128/JCM.42.8.3696-3706.2004. [DOI] [PMC free article] [PubMed] [Google Scholar]
- Diaz MR, Fell JW. Use of a suspension array for rapid identification of the varieties and genotypes of the Cryptococcum neoformans species complex. J Clin Microbiol. 2005;43:3662–3672. doi: 10.1128/JCM.43.8.3662-3672.2005. [DOI] [PMC free article] [PubMed] [Google Scholar]
- Dunbar SA. Applications of Luminex xMAP technology for rapid, high-throughput multiplexed nucleic acid detection. Clin Chim Acta. 2006;363:71–82. doi: 10.1016/j.cccn.2005.06.023. [DOI] [PMC free article] [PubMed] [Google Scholar]
- Ellison CK, Burton RS. Application of bead array technology to community dynamics of marine phytoplankton. Mar Ecol Prog Ser. 2005;288:75–85. [Google Scholar]
- Faust MA. Morphological details of six benthic species of Prorocentrum (Pyrrophita) from a mangrove Island, Twin Cays, Belize, including two new species. J Phycol. 1990;26:548–558. doi: 10.1111/j.1529-8817.2007.00450.x. [DOI] [PubMed] [Google Scholar]
- Faust MA. Prorocentrum belizeanum, Prorocentrum elegans and Prorocentrum caribbaeum, three new benthic species (Dinophyceae), from a Mangrove island, Twin Cays, Belize. J Phycol. 1993a;29:100–107. doi: 10.1111/j.1529-8817.2007.00450.x. [DOI] [PubMed] [Google Scholar]
- Faust MA. Three new benthic species of Prorocentrum (Dinophyceae) from Twin Cays, Belize: P. maculosum sp. nov., P. foraminosum sp. nov. and P. formosum sp. nov. Phycologia. 1993b;32:410–418. [Google Scholar]
- Faust MA. Three new benthic species of Prorocentrum (Dinophyceae) from Carrie Bow Cay, Belize: P. sabulosum sp. nov., P. sculptile sp. nov. and P. arenarium sp. nov. J Phycol. 1994;30:755–763. [Google Scholar]
- Faust MA. Three new benthic species of Prorocentrum (Dinophyceae) from Belize: P. norrisianum sp. nov., P. tropicalis sp. nov. and P. reticulatum sp. nov. J Phycol. 1997;33:851–858. [Google Scholar]
- Fensome RA, Taylor FJR, Norris G, Sarjeant WAS, Wharton DI, Williams GL. A classification of living and fossil dinoflagellates. Micropaleontology. 1993 Special Publication Number 7. [Google Scholar]
- Fulton R, Mcdade R, Smith P, Kienker L, Kettman J. Advanced multiplexed analysis with the FlowMetrix system. Clin Chem. 1997;43:1749–1756. [PubMed] [Google Scholar]
- Galluzzi L, Penna A, Bertozzini E, Vila M, Garces E, Magnani M. Development of a real-time PCR assay for rapid detection and quantification of Alexandrium minutum (a dinoflagellate) Appl Environ Microb. 2004;70:1199–1206. doi: 10.1128/AEM.70.2.1199-1206.2004. [DOI] [PMC free article] [PubMed] [Google Scholar]
- Galluzzi L, Bertozzini E, del Campo A, Penna A, Bruce IJ, Magnani M. Capture probe conjugated to paramagnetic nanoparticles for purification of Alexandrium (Dinophyceae) DNA from environmental samples. J Appl Microb. 2006;101:36–43. doi: 10.1111/j.1365-2672.2006.02952.x. [DOI] [PubMed] [Google Scholar]
- Gottschling M, Keupp H, Plotner J, Knop R, Willems H, Kirsch M. Phylogeny of calcareous dinoflagellates as inferred from ITS and ribosomal sequence data. Mol Phylogenet Evol. 2005;36:444–455. doi: 10.1016/j.ympev.2005.03.036. [DOI] [PubMed] [Google Scholar]
- Graves JD. Powerful tools fro genetic analysis come to age. Trends Biochem Technol. 1999;17:127–134. doi: 10.1016/s0167-7799(98)01241-4. [DOI] [PubMed] [Google Scholar]
- Gray M, Wawrick B, Paul J, Casper E. Molecular detection and quantitation of the red tide dinoflagellate Karenia brevis in the marine environment. Appl Environ Microb. 2003;69:5726–5730. doi: 10.1128/AEM.69.9.5726-5730.2003. [DOI] [PMC free article] [PubMed] [Google Scholar]
- Grzebyc D, Sako Y. Phylogenetic analysis of nine species of Prorocentrum (Dinophyceae) inferred from 18S ribosomal DNA sequences, morphological comparisons and description of Prorocentrum panamensis sp. nov. J Phycol. 1998;34:1055–1068. [Google Scholar]
- Guillou L, Nezan E, Cueff V, Erard-Le Denn E, Cambon-Bonavita MA, Gentien P, Barbier G. Genetic diversity and molecular detection of three toxic dinoflagellate geenra (Alexandrium, Dinophysis and Karenia) from French Coasts. Protist. 2002;153:223–238. doi: 10.1078/1434-4610-00100. [DOI] [PubMed] [Google Scholar]
- Hackett JD, Anderson DM, Erdner DL, Bhattacharya D. Dinoflagellates: a remarkable evolutionary experiment. Am J Bot. 2004;91:1523–1534. doi: 10.3732/ajb.91.10.1523. [DOI] [PubMed] [Google Scholar]
- Hallegraeff GM. A review of Harmful Algal Blooms and their apparent global increase. Phycologica. 1993;32:79–99. [Google Scholar]
- Haywood AJ, Steidinger KA, Truby EW. Comparative morphology and molecular phylogenetic analysis of three new species of the genus Karenia (Dinophyceae) from New Zeland. J Phycol. 2004;40:165–179. [Google Scholar]
- Hirashita T, Ichmini K, Montani S, Nomura M, Tajima S. Molecular analysis of ribosomal RNA gene of red tide algae obtained from the Seto Island Sea. Mar Biotechnol. 2000;2:267–273. doi: 10.1007/s101269900034. [DOI] [PubMed] [Google Scholar]
- Hosoi-Tanabe S, Sako Y. Species-specific detection and quantitation of toxic marine dinoflagellate Alexandrium tamarense and catenella by real-time PCR assay. Mar Biotechnol. 2005;7:506–514. doi: 10.1007/s10126-004-4128-4. [DOI] [PubMed] [Google Scholar]
- Inacio J, Beherens S, Fuchs BM, Fonseca A, Spencer-Martins I, Amann R. In situ accessibility of Saccharomyces cerevisiae 26S rRNA to Cy3-labeled oligonucleotide probes comprising the D1 and D2 domains. Appl Environ Microbiol. 2003;69:2899–2905. doi: 10.1128/AEM.69.5.2899-2905.2003. [DOI] [PMC free article] [PubMed] [Google Scholar]
- John U, Medlin LK, Groben R. Development of specific rRNA probes to distinguish between geographic clades of the Alexandrium tamarense species complex. J Plankton Res. 2005;27:199–204. [Google Scholar]
- Lin S, Zhang H, Hou Y, Miranda L, Bhattacharya D. Development of a dinoflagellate-oriented PCR primer set leads to detection of picoplanktonic dinoflagellates from Long Island sound. Appl Environ Microb. 2006a;72:5626–5630. doi: 10.1128/AEM.00586-06. [DOI] [PMC free article] [PubMed] [Google Scholar]
- Lin S, Zhang H, Jiao N. Potential utility of mitochondrial cytochrome b and its mRNA editing in resolving closesly related dinoflagellates: a case study of Prorocentrum (Dinophyceae) J Phycol. 2006b;42:646–654. [Google Scholar]
- Litaker RW, Tester PA, Colorni A, Levy MG, Noga EJ. The phylogenetic relationship of Pfiesteria piscicida, cryptoperidiniopsoid sp. Amyloodinoum ocellatum and a Pfiesteria-like dinoflagellate to other dinoflagellates and Apicomplexans. J Phycol. 1999;35:1379–1389. [Google Scholar]
- Miller PE, Scholin CA. Identification of cultured Pseudo-Nitzschia (Bacillariophyceae) using species-specific LSUrRNA-targeted fluorescent probes. J Phicol. 1996;32:646–655. [Google Scholar]
- Montresor M, Sgrosso S, Procaccini G, Kooistra WHCE. Intraspecific diversity in Scrippsiella trochoidea (Dinophyceae): evidence for cryptic species. Phycologia. 2003;42:56–70. [Google Scholar]
- Murray S, Jorgensen MF, Ho SYW, Patterson DJ, Jermiin LS. Improving the analysis of dinoflagellate phylogeny based on rDNA. Protist. 2005;156:269–286. doi: 10.1016/j.protis.2005.05.003. [DOI] [PubMed] [Google Scholar]
- Oldach DW, Delwiche CF, Jacobsen KS, Tengs T, Brown EG, Kempton JW, Schaefer EF, Bowers HA, Glasgow HB, Jr, Burkholder JM, Steidinger KA. Heteroduplex mobility assay-guided sequence discovery: elucidation of the small subunit (18s) rDNA sequences of Pfiesteria piscicida and related dinoflagellates from complex algal culture and environmental sample DNA pools. PNAS. 2000;97:4303–4308. doi: 10.1073/pnas.97.8.4303. [DOI] [PMC free article] [PubMed] [Google Scholar]
- Patterson SS, Casper ET, Garcia-Rubio L, Smith MC, Paul JH., III Increased precision of microbial RNA quantification using NASBA with an internal control. J Micriobiol Methods. 2005;60:343–352. doi: 10.1016/j.mimet.2004.10.011. [DOI] [PubMed] [Google Scholar]
- Peplies J, Glockner FO, Amann R. Optimization strategies for DNA microarray-based detection of bacteria with 16s RNA targeting oligonucleotide probes. Appl Environ Microbiol. 2003;69:1397–1407. doi: 10.1128/AEM.69.3.1397-1407.2003. [DOI] [PMC free article] [PubMed] [Google Scholar]
- Pochon X, Montoya-Burgos JI, Stadelman B, Pawlowski J. Molecular phylogeny, evolutionary rates, and divergence timing of the symbiotic dinoflagellate genus Symbiodinium. Mol Phylogenet Evol. 2006;38:20–30. doi: 10.1016/j.ympev.2005.04.028. [DOI] [PubMed] [Google Scholar]
- Saunders GW, Hill DRA, Sexton JP, Andersen RA. Small-subunit ribosomal RNA sequences from selected dinoflagelates: testing classical evolutionary hypothesis with molecular systematic methods. In: Bhattacharya D, editor. Origins of Algae and their Plastids. Springer Verlag; Vienna, Austria: 1997. pp. 237–239. [Google Scholar]
- Scholin CA, Herzog M, Sogin M, Anderson DM. Identification of group- and strain-specific genetic markers for globally distributed Alexandrium (Dinophyceae). II. Sequence analysis of a fragment of the LSU rRNA gene. J Phycol. 1994;30:999–1011. [Google Scholar]
- Scholin CA, Buck KR, Britschgi T, Cangelosi G, Chavez EP. Identification of Pseudo-nitzschia australis (Bacillariophyceae) using rRNA-targeted probes in whole cell and sandwich hybridization formats. Phycologia. 1996;35:190–197. [Google Scholar]
- Smayda TJ. Novel and nuisance phytoplankton blooms in the sea: evidence for a global epidemic. In: Graneli E, Sundstrom B, Edler L, Anderson DM, editors. Toxic Marine Phytoplankton. Elsevier Science; 1990. pp. 29–40. [Google Scholar]
- Southern E, Mir K, Shchepinov M. Molecular interactions on microarrays. Nat Genet. 1999;21(Suppl):5–9. doi: 10.1038/4429. [DOI] [PubMed] [Google Scholar]
- Takahashi Y, Takashita K, Koike K, Maruyama T, Nakayama T, Kobiyama A, Ogata T. Development of molecular probes for Dinophysis (Dinophyceae) plastid, a tool to predict blooming and explore plastid origin. Mar Biotechnol. 2005;7:95–103. doi: 10.1007/s10126-004-0482-5. [DOI] [PubMed] [Google Scholar]
- Tengs T, Bowers HA, Ziman AP, Stoecker DK, Oldach DW. Genetic polymorphism in Gymnodinium galatheanum chloroplast DNA sequences and development of a molecular detection assay. Mol Ecol. 2001;10:515–523. doi: 10.1046/j.1365-294x.2001.01223.x. [DOI] [PubMed] [Google Scholar]
- Tyrrell JV, Connelland LB, Sholin CA. Monitoring for Heterosigma akashiwo using a sandwich hybridization assay. Harmful Algae. 2002;2:205–214. [Google Scholar]
- Yoshida T, Nakai R, Seto H, Wang MK, Iwataki M, Hiroishi S. Sequence analysis of 5.8S rDNA and the internal transcribed space region in dinoflagellate Heterocapsa species (Dinophyceae) and development of selective PCR primers for the bivalve killer Heterocapsa circularisquama. Microbes Environ. 2003;18:216–222. [Google Scholar]
- Zardoya R, Costas E, Lopez-Roda V, Garrido-Pertiera A, Autista JM. Revised dinoflagellate phylogeny inferred from molecular analysis of large subunit ribosomal RNA gene sequences. J Mol Evol. 1995;41:637–645. doi: 10.1007/BF00175822. [DOI] [PubMed] [Google Scholar]
- Zhang H, Lin S. Complex gene structure of the form II rubisco in the dinoflagellate Prorocentrum minimum (Dinophyceae) J Phycol. 2003;39:1160–1171. [Google Scholar]
- Zhang H, Bhattacharya D, Lin S. Phylogeny of dinoflagellates based on mitochondrial cytochrome b and nuclear small subunit rDNA sequence comparisons. J Phycol. 2005;41:411–420. [Google Scholar]


