

Abstract
Objectives
We sought to determine whether Rho kinase (ROCK) activity is increased in a Taiwanese population with metabolic syndrome (MetS).
Background
Recent studies suggest that ROCK may be involved in the pathogenesis of MetS, but clinical studies linking ROCK with MetS are lacking.
Methods
We studied 40 Taiwanese subjects (60% men, mean age 55.5 ± 5.6 years) who were diagnosed with MetS with National Cholesterol Educational Program Adult Treatment Panel III criteria and 40 age- and gender-matched control subjects. Subject demographics were recorded, and blood samples were obtained.
Results
Compared with control subjects, ROCK activity, as determined by phosphorylation of myosin binding subunit (MBS) in leukocytes, was greater in MetS subjects (mean phospho-MBS/MBS ratio 0.46 vs. 0.35, p = 0.002). A cutoff value for ROCK activity of 0.39 predicted the presence of MetS with specificity and sensitivity rates of 70%. Plasma high-sensitivity C-reactive protein was greater (5.5 mg/l, 95% confidence interval [CI] 3.1 to 7.2 mg/l vs. 2.8 mg/l, 95% CI 1.1 to 3.9 mg/l, p = 0.01) and adiponectin was lower (4.9 μg/ml, 95% CI 3.2 to 6.1 μg/ml vs. 5.9 μg/ml, 95% CI 4.2 to 7.5 μg/ml, p = 0.01) in MetS subjects compared with control subjects, but plasma levels of interleukin-6 and tumor necrosis factor-alpha were not different (p > 0.05 for both). Body mass index, waist circumference, fasting glucose, high-sensitivity C-reactive protein, and triglyceride levels were associated with increased levels of ROCK activity. The risk of increased ROCK activity increased with the number of MetS components (p for trend <0.001).
Conclusions
Rho kinase activity is increased in Taiwanese subjects with MetS and is associated with each component of MetS and markers of inflammation. These findings suggest that ROCK activity may be a novel serological marker of MetS.
Metabolic syndrome (MetS) is a cluster of atherosclerotic cardiovascular disease risk factors and is closely associated with insulin resistance and obesity (1,2). The precise diagnosis of MetS, however, is still somewhat controversial, and no serological markers are available for its detection. Nevertheless, according to the criteria of National Cholesterol Educational Program Adult Treatment Panel (ATP)-III (3), the prevalence of MetS in U.S. adults who are older than 20 years of age is approximately 24% (4). Metabolic syndrome is a growing problem worldwide, particularly in the Asian population (5). The World Health Organization Expert Consultation recommended a lower cut-off point for observed risk in Asian populations than that for non-Asian populations, varying from 22 to 25 kg/m2 (6). Some studies on migrants from Asian countries to Western countries also indicated that Asian populations might be more susceptible to the Western diet and lifestyle than white ones in developing the MetS (7,8). Patients with MetS have twice the incidence of developing new-onset diabetes compared with those without MetS (9). Metabolic syndrome, therefore, is associated with increasing risk of developing diabetes and cardiovascular disease.
Several inflammatory mediators and adipocytokines, including tumor necrosis factor (TNF)-alpha (10), interleukin (IL)-6 (11), high-sensitivity C-reactive protein (hs-CRP) (12,13), and adiponectin (14) are associated with the development of insulin resistance and MetS (15,16). Despite these associations, the pathogenesis of MetS remains unknown. We recently reported that Rho kinase (ROCK) mediates the expression of plasminogen activator inhibitor-1 under hyperglycemic conditions (17). Furthermore, ROCK is upregulated under inflammatory conditions (18) and may be involved in adipocyte differentiation (19). Thus, growing evidence suggest that ROCK may contribute to the pathogenesis of MetS. However, clinical studies are lacking, which definitively link ROCK activity with MetS.
Rho kinase is a serine/threonine kinase that mediates the downstream signaling of the small guanosine triphosphate-binding protein, Rho, on the actin cytoskeleton (20). ROCK consists of 2 isoforms, ROCK1 and ROCK2. In mostly animal models, the inhibition of ROCK ameliorates many cardiovascular conditions, including hypertension (21), atherosclerosis (22), myocardial fibrosis (23), and stroke (24). Furthermore, ROCK also could regulate insulin signaling and glucose metabolism through direct phosphorylation of the insulin receptor substrate (IRS)-1 (25). Thus, it is likely that ROCK plays an important role in the pathogenesis of MetS and diabetes. However, evidence is lacking showing that ROCK activity is increased in human subjects with MetS. In the current study, we measured ROCK activity in Taiwanese population with MetS and determined whether ROCK activity is an independent marker of MetS and whether it correlates with other components and risk markers of MetS.
Materials and Methods
Study subjects
We prospectively enrolled 40 consecutive Taiwanese patients (60% men, ages 35 to 62 years), who were diagnosed with MetS with ATP-III criteria, from an outpatient clinic at the National Cheng Kung University Medical Center from 2005 to 2006. Patients who had a history of percutaneous coronary intervention within 6 months or coronary artery bypass surgery within 1 year were excluded. Other exclusion criteria included patients who had heart failure, cardiomyopathy, or valvular heart diseases. Because statins could affect ROCK activity through modulation of Rho (26), patients taking statins before enrollment also were excluded. A volunteer control group consisting of age- and gender-matched healthy subjects (n = 40, 60% men), with a mean age of 53.8 ± 6.6 years, also was enrolled. These control subjects showed no clinical or electrocardiographic evidence of ischemia or cerebrovascular disease. All subjects provided their informed consent. The study protocol was approved by the Human Research Subjects review committee of the National Cheng Kung University Medical Center.
Definition of MetS
We used ATP-III criteria for MetS (3), which require 3 or more of the following components: 1) obesity as defined by waist circumference >102 cm (40 inches) in men and >88 cm (35 inches) in women; 2) a low level of high-density lipoprotein cholesterol (HDL-C), defined as HDL-C <40 mg/dl in men and <50 mg/dl in women; 3) high triglycerides (TG), defined as TG ≥150 mg/dl; 4) high level of glucose, defined as fasting glucose ≥110 mg/dl; and 5) increased blood pressure, defined as blood pressure ≥130/85 mm Hg.
Biochemical analysis
Venous blood samples were drawn from each subject after ≥8 h or overnight fasting. The samples were stored at -80°C until biochemical assay by blinded investigators. Triglycerides were determined enzymatically. High-density lipoprotein cholesterol was measured by the phosphotungstate method. Glucose was enzymatically determined by the hexokinase method. Tumor necrosis factor-alpha was measured by enzyme immunoassay with a minimum detectable level of 6 pg/ml (Dainippon Pharmaceutical Co., Ltd., Osaka, Japan). High-sensitivity IL-6 was also measured by enzyme immunoassay (Dainippon Pharmaceutical Co., Ltd.). High-sensitivity CRP was measured by latex nephelometry (BNII, Dade Behring Co., Ltd., Milton Keynes, Buckinghamshire, United Kingdom). Adiponectin concentrations were determined by enzymelinked immunosorbent assay (Otsuka Pharmaceutical Co., Ltd., Rockville, Maryland). Interassay coefficients of variation of each variable were as follows: TNF-alpha, <9.6%; IL-6, <7.5%; hs-CRP, <4.0%; adiponectin, <8.6%.
Leukocyte isolation
Twenty milliliters of blood sample was mixed with Hanks’ balanced salt solution (HBSS) in a 50-ml citrate-containing tube. Ten milliliters of Histopaque (Histopaque-1077, Sigma Chemical Co., St. Louis, Missouri) were layered with 25 ml of diluted blood in 2 tubes and centrifuged at room temperature for 30 min at 350 g. The supernatant containing the leukocytes was aspirated, mixed with HBSS and diluted with 2% dextran (1:1 ratio), and kept rest at room temperature for 30 min. The top layer is then aspirated, mixed with HBSS, and centrifuged at room temperature for 5 min at 350 g. The supernatant was discarded, and the pellet containing the leukocytes was resuspended in 3 ml of cold phosphate-buffered saline. After swirling the tubes for 30 s, HBSS was added to stop the lysis. After centrifugation, the supernatant was discarded, and the pellet was resuspended in 5 ml of M199.
After determining cell yield and viability by using the trypan blue exclusion test (usually 4 to 80 × 106 viable cells with a viability of more than 95%), we diluted the suspension with HBSS to achieve 5 × 10⁶ cells/ml. Then, 400 μl of the leukocyte suspension was transferred to 4 sterile 1.5-ml tubes. We added 100 μl of fixative solution (50% trichloroacetic acid [Sigma]), 50 mmol/l dichlorodiphenyltrichloroethane (Sigma), and protease inhibitors (Calbiochem, EMD Biosciences, Inc., Darmstadt, Germany) to each tube. After vortexing and centrifuging the samples at 4°C for 5 min at 11,000 g, we removed the supernatant, added HBSS, and centrifuged the samples again at 4°C for 1 min at 11,000 g. Finally, we removed the supernatant with a micropipette. The leukocyte pellets were stored at -80° C until use.
Assay for ROCK expression and activity
After centrifugation, pellets were dissolved in 10 μl of 1 mol/l Tris and mixed with 100 μl of extraction buffer (8 mol/l urea, 2% sodium dodecyl sulfate, 5% sucrose, and 5% 2-mercaptoethanol, 0.02% BPB dye). Equal amounts of cell extracts were subjected to 7.5% sodium dodecyl sulfate polyacrylamide gel electrophoresis and transferred onto polyvinylidene fluoride membrane (Immobilon-P, Millipore, Billerica, Massachusetts). NIH 3T3 cell lysates were used as a positive control and to standardize the results of Western blot analyses from several membranes. The membranes were incubated with rabbit anti-phospho-specific Thr853-myosin binding subunit (MBS) polyclonal antibody (Biosource-Invitrogen, Carlsbad, California) (17), rabbit anti-MBS polyclonal antibody (Covance, Princeton, New Jersey), anti-ROCK2 monoclonal antibody, anti-ROCK1 monoclonal antibody (BD Biosciences, San Jose, California), or antiactin monoclonal antibody (Sigma). Bands were visualized with the use of the ECL detection kit (Amersham Biosciences, a division of GE Healthcare, Piscataway, New Jersey). Rho kinase activity was expressed as the ratio of phosphorylation levels of myosin binding subunit (pMBS) in each sample per pMBS in each positive control divided by MBS in each sample per MBS in each positive control.
Statistical analysis
All statistical analyses were conducted with the SPSS statistical package for Windows version 13.0 (SPSS Inc., Chicago, Illinois). The frequencies between MetS and the controls were compared with chi-square analysis. Independent-samples t test was used for comparison of mean values of parametric continuous variables (expressed as mean ± SD) between MetS and control groups. Because of asymmetric distribution, values for TNF-alpha, IL-6, hs-CRP, and adiponectin were analyzed by nonparametric methods and shown as the geometric means with 95% confidence intervals for those means. For nonparametric analysis, we used Mann-Whitney U test to evaluate the difference of levels between groups. Receiver-operating characteristic analysis was performed to determine the best cutoff value of ROCK activity to differentiate MetS and the control subjects. Because smoking status was found to strongly influence ROCK activity (27) and ROCK activity itself was not normally distributed, we used partial correlation coefficients adjusted for smoking status to compute the association between inflammation-related markers and levels of ROCK activity. The odds ratios by number of the MetS components for elevated ROCK activity were also calculated. All reported p values were 2-sided, and a p value of <0.05 was considered statistically significant.
Results
The prevalence of cardiovascular risk factors, including hypertension, fasting glucose levels, lipid profiles, smoking, body mass index (BMI), and waist circumference, are shown for control and MetS subjects (Table 1). Compared with the control group, the average age, gender, medications for hypertension and glucose control, and percentage of smokers in the MetS group were similar. Blood pressure, fasting glucose, low-density lipoprotein cholesterol, TG levels, BMI, and waist circumference were all greater among MetS subjects, and HDL-C levels were lower among MetS subjects.
Table 1. Clinical Manifestations of Metabolic Syndrome and Control Subjects.
| Controls (n = 40) | MetS (n = 40) | p Value | |
|---|---|---|---|
| Age (yrs) | 59.6 ± 6.5 | 60.1 ± 6.7 | 0.813 |
| Gender (male) | 24 (60%) | 24 (60%) | 0.815 |
| Hypertension | 8 (20%) | 18 (45%) | 0.004 |
| BMI (kg/m2) | 24.1 ± 2.2 | 33.4 ± 1.5 | <0.001 |
| Fasting glucose (mg/dl) | 93.5 ± 5.9 | 120.8 ± 5.9 | <0.001 |
| LDL-C (mg/dl) | 122 ± 8 | 131 ± 11 | 0.01 |
| TG (mg/dl) | 147 ± 18 | 159 ± 22 | 0.02 |
| HDL-C (mg/dl) | 49 ± 6 | 34 ± 5 | 0.002 |
| Waist circumference (cm) | 84.3 ± 7.2 | 104.3 ± 8.9 | <0.001 |
Values are expressed as mean ± SD or n (%).
BMI = body mass index; HDL-C = high-density lipoprotein cholesterol; LDL-C = low-density lipoprotein cholesterol; MetS = metabolic syndrome; TG = triglycerides.
The protein levels of ROCK1 and ROCK2 were similar in control and MetS subjects (Figs. 1A and 1B). However, compared with control subjects, MetS subjects had greater ROCK activities, as measured by pMBS/MBS (Figs. 1C and 1D). Among the inflammatory markers measured, plasma hs-CRP levels were greater in MetS subjects compared with those of control subjects, but not IL-6 or TNF-alpha (Table 2). Adiponectin levels were lower in MetS subjects. The cutoff value for ROCK activity that predicted the presence of MetS was >0.39 by receiver-operating characteristic analysis (area under curve = 0.76 ± 0.07, range 0.63 to 0.89, p = 0.001) (Fig. 2). The sensitivity and specificity rates for this ratio in detecting MetS in our cohort were 70% and 70%, respectively.
Figure 1. ROCK Activity Is Greater Among Asian Subjects With MetS.
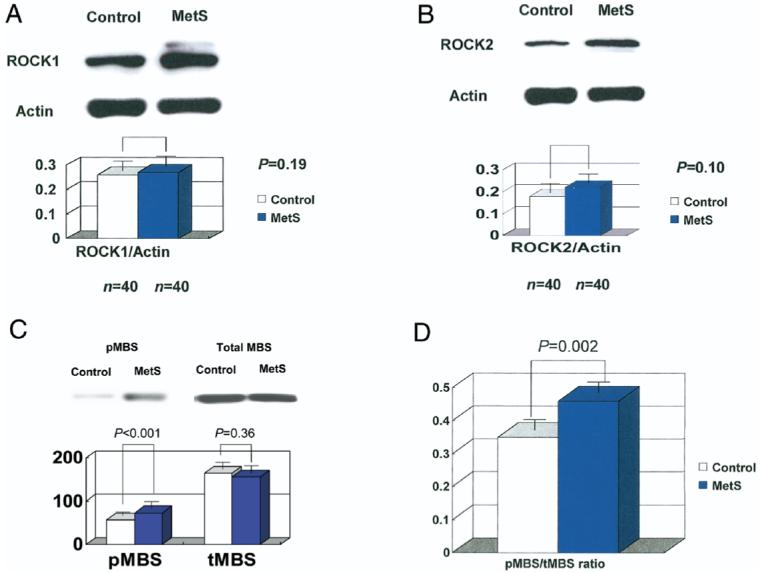
(A) Baseline protein expression of Rho kinase (ROCK)1 by immunoblotting method; (B) baseline protein expression of ROCK2 by immunoblotting method; (C) phosphorylation levels of MBS (pMBS) and total MBS (tMBS) were determined by immunoblotting methods; (D) ROCK activity, expressed as pMBS/MBS, between metabolic syndrome (MetS) patients and controls. Three repeated experiments were performed in duplicate.
Table 2. Baseline Inflammatory Markers of Metabolic Syndrome Subjects and Control Subjects.
| Control (n = 40) | MetS (n = 40) | p Value | |
|---|---|---|---|
| hs-CRP (mg/l) | 2.8 (1.1-3.9) | 5.5 (3.1-7.2) | 0.01 |
| IL-6 (pg/ml) | 1.7 (0.9-1.9) | 1.8 (1.1-2.1) | 0.77 |
| TNF-α (pg/ml) | 12.0 (10.1-14.1) | 12.8 (9.9-15.2) | 0.91 |
| Adiponectin (μg/ml) | 5.9 (4.2-7.5) | 4.9 (3.2-6.1) | 0.01 |
Values are expressed as geometric means with corresponding 95% confidence intervals (in parentheses).
hs-CRP = high-sensitivity C-reactive protein; IL = interleukin; TNF = tumor necrosis factor.
Figure 2. ROC Analysis to Determine the Cutoff Value to Differentiate MetS.
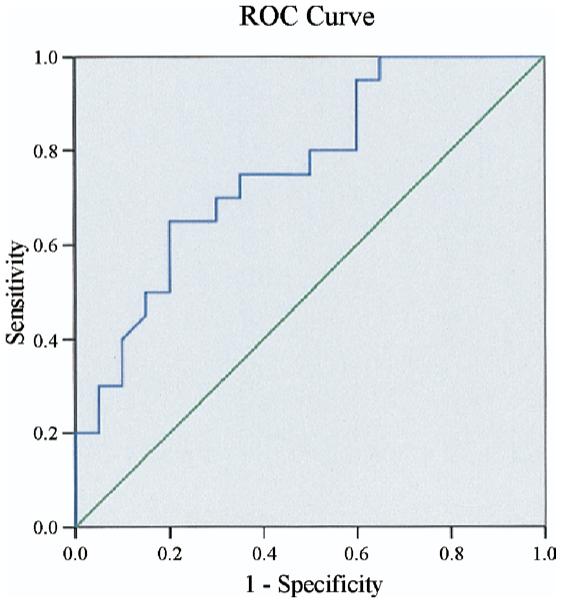
The best cutoff value for Rho kinase activity to differentiate the presence of metabolic syndrome (MetS) was 0.39; both sensitivity and specificity rates were 70%. The area under the curve = 0.76 ± 0.07, p = 0.001. ROC = receiver-operating characteristic.
To determine whether ROCK activity is a novel risk marker for MetS and whether it correlates with components of MetS, we performed an association analysis to determine the correlation coefficient of ROCK activity with components of MetS (Table 3). Among the associated factors, BMI, waist circumference, fasting glucose, hs-CRP, and TG levels were all positively associated with increased levels of ROCK activity. In contrast, adiponectin and HDL-C levels were negatively associated with ROCK activity. After adjusting for age and smoking, those subjects with a greater number of MetS components (≥3) had higher odds ratios for elevated ROCK activity when compared with those with <3 components. These findings suggest that elevated ROCK activity requires the presence of several risk components that are associated with MetS (Table 4).
Table 3. Partial Correlation Coefficient Adjusted for Smoking Status Between Clinical and Biochemical Parameters With Rho Kinase Activity Among Metabolic Syndrome Subjects.
| Covariants | Coefficient | p Value (2-tail) |
|---|---|---|
| BMI | 0.523 | <0.001 |
| Fasting glucose | 0.410 | 0.009 |
| Waist circumference | 0.412 | 0.009 |
| Adiponectin | -0.412 | 0.009 |
| hs-CRP | 0.359 | 0.023 |
| HDL-C | -0.352 | 0.026 |
| TG | 0.356 | 0.024 |
| Age | 0.157 | 0.333 |
Table 4. Adjusted Odds Ratios of Greater ROCK Activity With the Number of MetS Components.
| Number of MetS Components | Odds Ratio (95% CI) for Greater ROCK Activity (phospho-MBS/MBS >0.39)* |
|---|---|
| 0 | 1.0 |
| 1 | 1.15 (0.94-1.46) |
| 2 | 1.29 (0.99-1.93) |
| 3 | 1.89 (1.34-2.66)‡ |
| ≥4 | 2.70 (1.98-4.18)† |
| Trend | <0.001 |
Risks are compared with subjects without any risk factor component of metabolic syndrome (MetS) and adjusted for age and smoking status.
p < 0.01;
p < 0.001.
CI = confidence interval; MBS = myosin binding subunit; ROCK = Rho kinase.
Discussion
We have shown that ROCK activity is greater among Taiwanese subjects with MetS. Increased levels of ROCK activity (pMBS/MBS ratio >0.39), independently predict the diagnosis of MetS. In addition, higher ROCK activity was associated with several components of MetS, such as greater BMI and waist circumference, and correlated with greater hs-CRP and lower adiponectin levels. These findings indicate that ROCK activity is a novel risk marker for MetS and suggest that ROCK may be involved in the development and progression of MetS.
Although the precise mechanism by which ROCK activity is increased among MetS subjects is not known, several possible mechanisms could explain the observed findings. For example, increased ROCK activity is associated with hypertension and phosphorylation of IRS-1 by ROCK, which prevents insulin signaling and glucose transporter-4 translocation, could lead to altered glucose metabolism (19,26). Interestingly, inhibition of ROCK ameliorates insulin sensitivity in obese, but not lean, rats suggesting that ROCK activity is increased by obesity (28). Another possibility that links elevated ROCK activity with MetS is inflammation. Several inflammatory molecules and adipocytokines, including TNF-alpha, IL-6, and hs-CRP, have been shown to be associated with insulin resistance and MetS (10-14). However, in the present cohort, higher hs-CRP, but not TNF-alpha or IL-6, was associated with greater ROCK activity. Interestingly, some studies showed that hs-CRP, but not TNF-alpha or IL-6, is associated with MetS (14,29,30). Nevertheless, the lack of association between ROCK and TNF-alpha or IL-6 might be due to both the wide range of distribution of TNF-alpha and IL-6 in our cohort and the small number of subjects in the present study.
Rho kinase activity was greater among MetS subjects, which may correlate with insulin resistance. In our study, most of our patients were obese with greater BMI and waist circumference values, 2 contributors to MetS and insulin resistance. Insulin resistance acts as bridge between obesity and each component of MetS via different mechanisms, including altering lipid metabolism (19,25) and adipokine secretions (14). Indeed, weight loss can result in clinical meaningful improvements in multiple metabolic parameters and blood pressure (31). Obesity itself can precipitate an inflammatory response and lead to free radical generation (32), thus further augmenting ROCK signaling. Indeed, obesity is one of the major components of MetS. Interestingly, ROCKs are involved in adipocyte differentiation (19), which also may affect the pathogenesis of MetS. As mentioned previously, increased ROCK activity could lead to the phosphorylation of IRS-1 and subsequently impaired the glycogen synthase or glucose transportation in peripheral tissues, thereby increasing insulin resistance.
In our current study, despite increase in leukocyte ROCK activity in MetS subjects, ROCK1 and ROCK2 expression were similar in control and MetS subjects. These findings suggest that the activation of ROCK rather than induction of ROCK expression is the underlying mechanism that is associated with components of the metabolic syndrome. Indeed, agents or conditions that increase ROCK activity generally do not affect ROCK expression because the regulation of ROCKs occurs through their association with activated Rho guanosine triphosphatase in response to G-proteincoupled receptors or growth factors. Thus, conditions associated with components of the metabolic syndrome, such as hypertension, smoking, and dyslipidemia, are more likely to lead to the activation of the Rho/ROCK pathway rather than induction of ROCK expression. It remains to be determined how components of MetS lead to the activation of ROCK.
Study limitations
Some limitations of this study should be noted. First, the present case-control study did not allow for inferring causality, which should be considered hypothesis generating and requires further confirmation by prospective studies and, if possible, therapeutic clinical trials. Second, all subjects in the present study were Taiwanese. Thus, the present results may not extrapolate to other ethnic groups. Nevertheless, our finding showing that ROCK activity is an important serological marker of MetS may help clarify the diagnosis of MetS in future patient populations.
Conclusions
Our results show that ROCK activity is elevated among MetS human subjects and associated with some inflammatory markers. It remains to be determined whether increased ROCK activity correlates with increase cardiovascular event rates in MetS and whether reduction of ROCK activity is associated with therapeutic benefits in subjects with MetS.
Acknowledgments
This work was supported by grants from the National Institutes of Health (HL052233). Dr. Liu is a recipient of a Research Fellowship from the National Health Research Institute (NHRI) of Taiwan.
Abbreviations and Acronyms
- BMI
body mass index
- HBSS
Hanks’ balanced salt solution
- HDL-C
high-density lipoprotein cholesterol
- hs-CRP
high-sensitivity C-reactive protein
- IL
interleukin
- IRS
insulin receptor substrate
- MBS
myosin binding subunit
- MetS
metabolic syndrome
- ROCK
Rho kinase
- TG
triglycerides
- TNF
tumor necrosis factor
REFERENCES
- 1.Alberti KG, Zimmet P, Shaw J, for the IDF Epidemiology Task Force Consensus Group The metabolic syndrome—a new worldwide definition. Lancet. 2005;366:1059–62. doi: 10.1016/S0140-6736(05)67402-8. [DOI] [PubMed] [Google Scholar]
- 2.Lakka HM, Laaksonen DE, Lakka TA, et al. The metabolic syndrome and total and cardiovascular disease mortality in middle-aged men. JAMA. 2002;288:2709–16. doi: 10.1001/jama.288.21.2709. [DOI] [PubMed] [Google Scholar]
- 3.Expert Panel on Detection, Evaluation, and Treatment of High Blood Cholesterol in Adults Executive summary of the third report of the National Cholesterol Education Program (NCEP) Expert Panel on Detection, Evaluation, and Treatment of High Blood Cholesterol in Adults (Adult Treatment Panel III) JAMA. 2001;285:2486–97. doi: 10.1001/jama.285.19.2486. [DOI] [PubMed] [Google Scholar]
- 4.Ford ES, Giles WH, Dietz WH. Prevalence of the metabolic syndrome among US adults: findings from the third National Health and Nutrition Examination Survey. JAMA. 2002;287:356–9. doi: 10.1001/jama.287.3.356. [DOI] [PubMed] [Google Scholar]
- 5.Rakugi H, Ogihara T. The metabolic syndrome in the Asian population. Curr Hypertens Rep. 2005;7:103–9. doi: 10.1007/s11906-005-0082-4. [DOI] [PubMed] [Google Scholar]
- 6.WHO Expert Consultation Appropriate body-mass index for Asian populations and its implications for policy and intervention strategies. Lancet. 2004;363:157–63. doi: 10.1016/S0140-6736(03)15268-3. [DOI] [PubMed] [Google Scholar]
- 7.Misra KB, Endemann SW, Ayer M. Leisure time physical activity and metabolic syndrome in Asian Indian immigrants residing in northern California. Ethn Dis. 2005;15:627–34. [PubMed] [Google Scholar]
- 8.Tillin T, Forouhi N, Johnston DG, McKeigue PM, Chaturvedi N, Godsland IF. Metabolic syndrome and coronary heart disease in South Asians, African-Caribbeans and white Europeans: a UK population-based cross-sectional study. Diabetologia. 2005;48:649–56. doi: 10.1007/s00125-005-1689-3. [DOI] [PubMed] [Google Scholar]
- 9.Lorenzo C, Okoloise M, Williams K, Stern MP, Haffner SM, for the San Antonio Heart Study The metabolic syndrome as predictor of type 2 diabetes the San Antonio Heart Study. Diabetes Care. 2003;26:3153–9. doi: 10.2337/diacare.26.11.3153. [DOI] [PubMed] [Google Scholar]
- 10.Picchi A, Gao X, Belmadani S, et al. Tumor necrosis factor-alpha induces endothelial dysfunction in the prediabetic metabolic syndrome. Circ Res. 2006;99:69–77. doi: 10.1161/01.RES.0000229685.37402.80. [DOI] [PubMed] [Google Scholar]
- 11.Langenberg C, Bergstrom J, Scheidt-Nave C, Pfeilschifter J, Barrett-Connor E. Cardiovascular death and the metabolic syndrome: role of adiposity-signaling hormones and inflammatory markers. Diabetes Care. 2006;29:1363–9. doi: 10.2337/dc05-2385. [DOI] [PubMed] [Google Scholar]
- 12.Matsuzawa Y. The metabolic syndrome and adipocytokines. FEBS Lett. 2006;580:2917–21. doi: 10.1016/j.febslet.2006.04.028. [DOI] [PubMed] [Google Scholar]
- 13.Kahn SE, Zinman B, Haffner SM, et al. Obesity is a major determinant of the association of C-reactive protein levels and the metabolic syndrome in type 2 diabetes. Diabetes. 2006;55:2357–64. doi: 10.2337/db06-0116. [DOI] [PubMed] [Google Scholar]
- 14.Matsushita K, Yatsuya H, Tamakoshi K, et al. Comparison of circulating adiponectin and proinflammatory markers regarding their association with metabolic syndrome in Japanese men. Arterioscler Thromb Vasc Biol. 2006;26:871–6. doi: 10.1161/01.ATV.0000208363.85388.8f. [DOI] [PubMed] [Google Scholar]
- 15.Haffner SM. The metabolic syndrome: inflammation, diabetes mellitus, and cardiovascular disease. Am J Cardiol. 2006;97:3A–11A. doi: 10.1016/j.amjcard.2005.11.010. [DOI] [PubMed] [Google Scholar]
- 16.Yudkin JS. Adipose tissue, insulin action and vascular disease: inflammatory signals. Int J Obes Relat Metab Disord. 2003;27:S25–28. doi: 10.1038/sj.ijo.0802496. [DOI] [PubMed] [Google Scholar]
- 17.Rikitake Y, Liao JK. Rho-kinase mediates hyperglycemia-induced plasminogen activator inhibitor-1 expression in vascular endothelial cells. Circulation. 2005;111:3261–8. doi: 10.1161/CIRCULATIONAHA.105.534024. [DOI] [PMC free article] [PubMed] [Google Scholar]
- 18.Hiroki J, Shimokawa H, Higashi M, et al. Inflammatory stimuli upregulate Rho-kinase in human coronary vascular smooth muscle cells. J Mol Cell Cardiol. 2004;37:537–46. doi: 10.1016/j.yjmcc.2004.05.008. [DOI] [PubMed] [Google Scholar]
- 19.Sordella R, Jiang W, Chen GC, Curto M, Settleman J. Modulation of Rho GTPase signaling regulates a switch between adipogenesis and myogenesis. Cell. 2003;113:147–58. doi: 10.1016/s0092-8674(03)00271-x. [DOI] [PubMed] [Google Scholar]
- 20.Noma K, Oyama N, Liao JK. Physiological role of ROCKs in the cardiovascular system. Am J Physiol Cell Physiol. 2006;290:C661–8. doi: 10.1152/ajpcell.00459.2005. [DOI] [PMC free article] [PubMed] [Google Scholar]
- 21.Uehata M, Ishizaki T, Satoh H, et al. Calcium sensitization of smooth muscle mediated by a Rho-associated protein kinase in hypertension. Nature. 1997;389:990–4. doi: 10.1038/40187. [DOI] [PubMed] [Google Scholar]
- 22.Mallat Z, Gojova A, Sauzeau V, et al. Rho-associated protein kinase contributes to early atherosclerotic lesion formation in mice. Circ Res. 2003;93:884–8. doi: 10.1161/01.RES.0000099062.55042.9A. [DOI] [PubMed] [Google Scholar]
- 23.Rikitake Y, Oyama N, Wang CY, et al. Decreased perivascular fibrosis but not cardiac hypertrophy in ROCK1+/- haploinsufficient mice. Circulation. 2005;112:2959–65. doi: 10.1161/CIRCULATIONAHA.105.584623. [DOI] [PMC free article] [PubMed] [Google Scholar]
- 24.Rikitake Y, Kim HH, Huang Z, et al. Inhibition of Rho kinase (ROCK) leads to increased cerebral blood flow and stroke protection. Stroke. 2005;36:2251–7. doi: 10.1161/01.STR.0000181077.84981.11. [DOI] [PMC free article] [PubMed] [Google Scholar]
- 25.Furukawa N, Ongusaha P, Jahng WJ, et al. Role of Rho-kinase in regulation of insulin action and glucose homeostasis. Cell Metab. 2005;2:119–29. doi: 10.1016/j.cmet.2005.06.011. [DOI] [PubMed] [Google Scholar]
- 26.Begum N, Sandu OA, Ito M, Lohmann SM, Smolenski A. Active Rho kinase (ROK-alpha) associates with insulin receptor substrate-1 and inhibits insulin signaling in vascular smooth muscle cells. J Biol Chem. 2002;277:6214–22. doi: 10.1074/jbc.M110508200. [DOI] [PubMed] [Google Scholar]
- 27.Noma K, Goto C, Nishioka K, et al. Smoking, endothelial function, and Rho-kinase in humans. Arterioscler Thromb Vasc Biol. 2005;25:2630–5. doi: 10.1161/01.ATV.0000189304.32725.bd. [DOI] [PubMed] [Google Scholar]
- 28.Kanda T, Wakino S, Homma K, et al. Rho-kinase as a molecular target for insulin resistance and hypertension. FASEB J. 2006;20:169–71. doi: 10.1096/fj.05-4197fje. [DOI] [PubMed] [Google Scholar]
- 29.Salmenniemi U, Ruotsalainen E, Pihlajamäki J, et al. Multiple abnormalities in glucose and energy metabolism and coordinated changes in levels of adiponectin, cytokines, and adhesion molecules in subjects with metabolic syndrome. Circulation. 2004;110:3842–8. doi: 10.1161/01.CIR.0000150391.38660.9B. [DOI] [PubMed] [Google Scholar]
- 30.Choi KM, Lee J, Lee KW, et al. Comparison of serum concentrations of C-reactive protein, TNF-alpha, and IL-6 between elderly Korean women with normal and impaired glucose tolerance. Diabetes Res Clin Pract. 2004;64:99–106. doi: 10.1016/j.diabres.2003.10.007. [DOI] [PubMed] [Google Scholar]
- 31.Matteucci E, Rosada J, Pinelli M, Giusti C, Giampietro O. Systolic blood pressure response to exercise in type 1 diabetes families compared with healthy control individuals. J Hypertens. 2006;24:1745–51. doi: 10.1097/01.hjh.0000242398.60838.5d. [DOI] [PubMed] [Google Scholar]
- 32.Milagro FI, Campion J, Martinez JA. Weight gain induced by high-fat feeding involves increased liver oxidative stress. Obesity (Silver Spring) 2006;14:1118–23. doi: 10.1038/oby.2006.128. [DOI] [PubMed] [Google Scholar]