

Abstract
A library of “hydraphile” synthetic ion channel analogues that differ in overall length from ∼28-58 Å has been prepared. A new and convenient ion-selective electrode (ISE) method was used to assay Na+ release. Liposomes were formed from three different phospholipids: 1,2-dimyristoleoyl-sn-glycero-3-phosphocholine (DMPC), 1,2-dioleoyl-sn-glycero-3-phosphocholine (DOPC), and 1,2-dierucoyl-sn-glycero-3-phosphocholine (DEPC). The acyl chains of the lipids comprise cis-unsaturated 14:1, 18:1, or 22:1 residues, respectively. Sodium release was measured for each liposome system with each of the synthetic channels. Peak activity was observed for shorter channels in liposomes formed from DMPC and for longer channels in DEPC. A separate study was then conducted in DMPC liposomes in the presence of the putative membrane-thickening agents cholesterol and decane. Peak activity was clearly shifted to longer channel lengths upon addition of 20 or 40 mol % cholesterol or n-decane to the liposome preparation.
Introduction
Gorter and Grendel recognized in 1925 that the boundary membrane of erythrocytes is a bilayer.1 Nearly 50 years later, Singer and Nicolson offered a “fluid mosaic” model for the plasma membrane.2 Extensive study of the plasma membrane has led to a detailed understanding of its components and composition in various organisms. Aspects of membrane structure, including in vivo thickness and phase behavior, remain poorly defined despite numerous and careful studies. As proposed detailed structures for membrane proteins emerge, their interactions with membranes in general and membrane lipids in particular remain an important and unresolved question. Lipid rafts, which were not anticipated by theories of membrane structure, remain a conundrum. Their importance in protein localization, protein activation, signal transduction, and membrane fusion add real immediacy to the structural details of membrane heterogeneity and dynamics.
Despite great interest, the determination of structural details for fluid, heterogeneous, supramolecular complexes such as the phospholipid bilayer membrane remain incomplete. Numerous recent studies and reviews point to the lack of a clear understanding of membrane thickness and phospholipid headgroup surface area. Nagle, Tristram-Nagle, and their co-workers have made the case in recent reviews3 that certain “accepted” membrane parameters are not uniformly reported in the literature. Indeed, they note3b: “some readers may challenge our assertion that lipid bilayer structure should still be considered an active area. It has a long and rich history. Many prominent biophysicists have published in it and moved on. Users of bilayer structural data have many references to choose from and each user has a favorite.” This variability3a in membrane organization and thickness is likely to be amplified by interactions with peptides or proteins embedded within them.
It is important to bear in mind that much information concerning membrane structure has been acquired from X-ray studies of powdered membranes. Even when humidified, these membranes are not as dynamic as they would be in liposomes. Small angle neutron scattering (SANS) is useful in this context and has been applied to liposomes.4 We present here an alternative approach to the assay of membrane thickness, which relies upon a family of synthetic, cation-conducting channel compounds.
The unique, synthetic channel system to which we have given the family name “hydraphile” has a number of advantages over natural peptide or protein channels. First, a family of hydraphile channels has now been studied in detail.5 Their ability to transport protons and cations has been confirmed by fluorescence methods,6 by NMR, by bilayer voltage clamp,7 and by whole-cell patch clamping.8 Many of the family members are biologically active in contexts that comport with channel formation.9 Recent computational studies by others generally confirm the experimental conclusions.10 The hydraphile channels are active over a range of lengths and sidearm functions. Accordingly, we prepared a family of hydraphiles that were identical in all respects except for overall length. We prepared vesicles from phospholipid monomers of various lengths and then directly observed Na+ efflux from the liposomes as a measure of efficacy. In this way, we have obtained a dynamic measure of bilayer thickness that may be compared with previous values, often obtained from X-ray crystallographic data.11
Results
Synthesis of the Hydraphile Channel Compounds
Seven compounds that are well established as synthetic ion channel formers6-9 were prepared for use in the present study and are shown below. Five of them (1-5) were prepared as reported previously.8,12 The preparation was accomplished by monode-benzylation by partial hydrogenolysis of N,N’-dibenzyl-4,13-diaza-18-crown-6, followed by alkylation of the secondary macroring nitrogen atom with the appropriate dibromoalkane. Using a shorthand that we previously reported,13 we can describe this conversion schematically as PhCH2〈N18N〉CH2Ph → PhCH2-〈N18N〉H → PhCH2〈N18N〉(CH2)nBr. Coupling of the latter bromide with 4,13-diaza-18-crown-6 affords PhCH2〈N18N〉-(CH2)n〈N18N〉(CH2)n〈N18N〉CH2Ph, 1-7. Compounds 6 and 7 have not been previously described, and their syntheses are recorded in detail in the Experimental Section.

Analytical Method Used for Sodium Ion Transport Assay
Because the scope of the present study is rather large, we required an analytical method that was reliable but more convenient than either the NMR or bilayer clamp methods, both of which are labor intensive. Although we have used ion-selective electrodes (ISE) to measure ion receptor interactions in solution for more than two decades,14 the use of ISEs for dynamic measurements of ion flux is relatively recent. Breukink et al. reported the use of a K+ ISE to examine the membrane-destabilizing activity of nisin, but the report did not include analytical details.15 Silberstein et al. used ISE methodology to assay the membrane-destabilizing abilities of several viral and peptide pore formers.16 In part following their lead, we have developed an ISE method that uses a sodium selective electrode to assay release of Na+ from large unilamellar vesicles (LUV). To our knowledge, this is the first report in which a sodium-selective ISE is used to quantitate ion channel activity.
Liposomes were prepared as described below from phospholipids having different fatty acyl chain lengths. The vesicles were prepared in an aqueous solution containing 750 mM NaCl/15 mM N-2-hydroxyethylpiperazine-N’-2-ethanesulfonic acid (HEPES) at pH 7.0. This aqueous solution was entrapped as the vesicles were formed. The vesicles were extruded through a 0.2 μm polycarbonate membrane filter. The initial buffer solution was exchanged for a sodium-free buffer by passing the liposomes over a Sephadex G25 column. The external buffer was choline chloride (750 mM) and HEPES (15 mM, pH 7.0). Vesicle concentration was measured as reported,17 and vesicle size was measured by a Coulter N4MD submicron particle analyzer. The vesicles used in the transport studies had diameters of ∼200-250 nm (∼2000-2500 Å), and the observed sizes were larger when the lipid chain length was longer.
Sodium transport was measured by inserting a combination pH/sodium electrode (see Experimental Section) into a beaker containing buffered vesicle solution (lipid concentration 0.4 mM, total volume 2 mL). The baseline was established by recording for 5 min prior to addition of the channel, which was added as a 2-propanol solution. Sodium flux was recorded for 25 min. A value for total sodium release was obtained by n-octylglucoside-induced lysis of the vesicles. The data were collected in millivolt units and converted to concentration by using the electrode’s calibration curve. The concentration data were normalized to the final sodium release value after vesicle lysis.
Vesicle Studies
The vesicles used in the studies presented here were formed from the following phospholipids: 1,2-dimyristoleoyl-sn-glycero-3-phosphocholine, 1,2-dioleoyl-sn-glycero-3-phosphocholine, and 1,2-dierucoyl-sn-glycero-3-phosphocholine. The acyl chains comprise cis-unsaturated 14:1, 18:1, or 22:1 residues, respectively. Experiments were also conducted in which either cholesterol (20 or 40 mol %) or n-decane (25% w/w) was added to the dimyristoleoyl lipids.
Concentration Dependence of Na+ Transport by Benzyl Channel 3
It was first necessary to demonstrate that the ISE method gave a reproducible account of Na+ release from vesicles. This was done in vesicles formed as described below from 1,2-dioleoyl-sn-glycero-3-phosphocholine (DOPC). The internal Na+ concentration was 750 mM, and release was measured in separate experiments using the following concentrations of dibenzyl (C12) channel 3: 2, 4, 8, 12, 16, and 20 μM. Figure 1 shows the results. Data were normalized to full sodium release after vesicle lysis (see above) and plotted as fractional Na+ release (1 = full release) on the ordinate. Each line is the average of at least three separate determinations, conducted at each concentration. Concentration-dependent release was observed, and full Na+ release by 3 occurred in <900 s at [3] = 20 μM.
Figure 1.
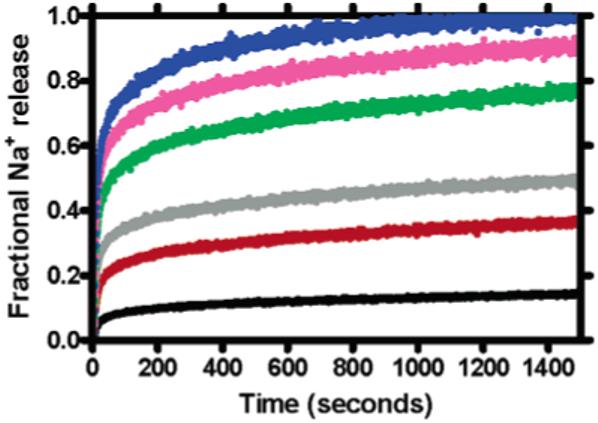
Sodium release from DOPC vesicles mediated by benzyl channel 3 at concentrations of 2, 4, 8, 12, 16, and 20 μM.
Dependence of Na+ Transport on Spacer Chain Length in DOPC Vesicles
All transport studies were conducted at least in triplicate. Transport studies were conducted under identical conditions of concentration, pH, temperature, etc., to the extent these could be controlled. Data are reported as percent transport monitored at 1500 s as an arbitrarily selected basis for comparison. The error bars in Figure 2 show the variation in the data.
Figure 2.
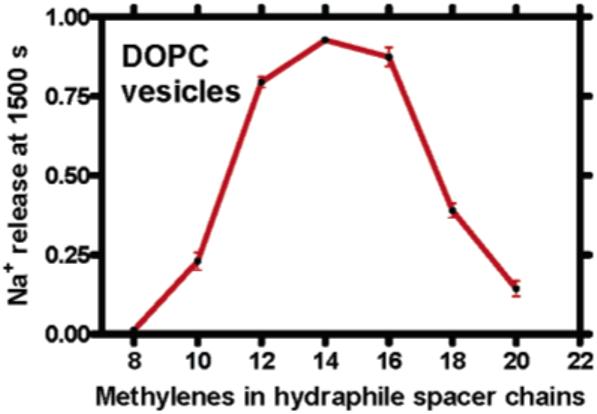
Release from DOPC vesicles mediated by compounds 1-7. The data points show fractional Na+ release measured at 1500 s when 12 μM of compound was present. Each point represents at least three replicates.
Choice of Phospholipid Monomers for Liposome Formation
The scope of this study required that each of the seven channels was assayed in at least three sets of liposomes. Thus, one series required a minimum of 21 separate experiments. In the work reported here, three closely related phospholipids were used. These had different chain lengths, a single cis-double bond, and identical headgroups. The phospholipids chosen were 1,2-dimyristoleoyl-sn-glycero-3-phosphocholine (Z14:1, DMPC), 1,2-dioleoyl-sn-glycero-3-phosphocholine (Z18:1, DOPC), and 1,2-dierucoyl-sn-glycero-3-phosphocholine (Z22:1, DEPC). The three phospholipid structures chosen for the experimental survey are illustrated. Table 1 records phase transition temperatures (ΔTm) and estimated hydrophobic bilayer widths for each of the lipids used in this study. The lipids were chosen so that room-temperature experiments could be conducted above ΔTm (i.e., in the gel phase). The study also included examining the influence of n-decane and cholesterol on the effective thickness of bilayers formed from DMPC. Although the effort was limited to three phospholipids, more than 100 series of measurements were required to obtain the data reported here.
Table 1.
Phase Transition Temperatures (ΔTm) and Estimated Bilayer Lengths
Range of bilayer widths represents the scope of values found in the literature.
Van Dijk, P. W. M.; de Kruijff, B.; Van Deenen, L. L. M.; De Gier, J.; Demel, R. A. Biochim. Biophys. Acta 1976, 455, 576-587.
Tomita, T.; Wantabe, M.; Yasuda, T. Biochim. Biophys. Acta 1992, 1104, 325-330.
Reference 11b.

Effect of Channel Spacer Chain and Lipid Length on Sodium Transport from Liposomes
Vesicles of ∼200-250 nm diameter were formed from DMPC, DOPC, or DEPC as described below. Release of Na+ from the vesicles was monitored for 25 min by using a sodium-selective ISE. The concentration of 1-7 used in each case was 12 μM, and the ionophore was introduced as a solution in 2-propanol. The results are shown in Figure 3.
Figure 3.
Sodium release monitored at 1500 s for compounds 1-7 (12 μM) in DMPC, DOPC, and DEPC vesicles.
The effect of membrane-thickening agents on Na+ transport from DMPC liposomes by 1-7 was also assayed. Cholesterol was added at concentrations of 20 or 40 mol % relative to DMPC. The experiments with n-decane used a ratio of n-decane/phospholipid that was 1:3 (w/w). In both cases, liposomes were prepared by mixing the diluent with the phospholipids prior to vesicle formation so that uniform distribution of the excipient would be achieved.
Discussion
Use of Hydraphiles as a Membrane Probe
The hydraphiles are now a well-established and well-characterized class of synthetic channels.6-9,12 These channels show open-shut behavior characteristic of protein channels. They exhibit selectivity for cations over anions and for Na+ over K+. The hydraphiles are all symmetrical structures so they are inherently nonrectifying. The aggregation state was assessed for two fluorescent hydraphiles and found to be ∼1.7 This implies that they function as monomers. They have also shown a fascinating range of biological activity. For many years, peptide pore formers such as gramicidin and melittin have been favored as channel models in the biological community. This was in part because synthetic channels were not available and in part because the pore formers were naturally occurring and therefore inherently biological. More recently, a variety of synthetic peptides have been studied, and these may be obtained in chemical purity and with specific lengths and sequences. Synthetic channels offer the prospect that they may be more finely manipulated by the chemist and thus may serve as a more sensitive probe of a given biological effect.
The hydraphiles used in the present study all are members of the benzyl channel family. The shorthand we use to represent compound 1 (structure shown above) is PhCH2〈N18N〉(CH2)8-〈N18N〉(CH2)8〈N18N〉CH2Ph. Results obtained to date show that the channel’s span is defined by the width of the central macrocycle and the two oligomethylene chains appended to it.
Measurements of Approximate Hydraphile Lengths
We attempted computerized molecular modeling of 1-7 to measure the distance between proximal nitrogens in the two distal macrocycles. The calculations we attempted gave energyminimized structures in which the molecule was folded back upon itself rather than in an extended conformation. We abandoned this strategy and turned instead to the Cambridge Structural Database (CSD) to obtain dimensions of substructural units that are reported in the solid state.
Since we have assumed the hydraphiles are fully extended across the lipid bilayer and that the central relay is only transiently complexed, we measured the N-N distance across the macrocycle for several substituted diazacrowns in the CSD, using the included software package ConQuest 1.4. For the five uncomplexed crown structures measured (CSD descriptors: BADDOZ, BEXMUM, EFEDAU, EFEDIC, GOXWAR), the N-N distance varied from 6.799 to 7.736 Å; the average N-N distance was 7.292 Å. A typical C-C bond length (e.g., ethane) is 1.54 Å. We measured the chain length of several saturated lipid chains to determine the lineal distance spanned by the saturated C-C bonds. The average length spanned by a C-C bond was found to be 1.262 Å. The C-N bond of carbon attached to macroring nitrogen is expected to be shorter than a C-C bond, owing to the greater electronegativity of nitrogen. Measurements of alkylated macrocycles in the solid state consistently gave a C-N bond length of 1.47 Å. Estimates of hydraphile length were made by summing the N-N distance across the central relay, adding four times the C-N bond distance, and then the appropriate number of C-C bonds. The estimated lengths are shown in Table 2.
Table 2.
Estimated Overall Span Lengths for 1-7
| compd No. | spacer chain length | estimated length (Å)a |
|---|---|---|
| 1 | C8 | 28.3 |
| 2 | C10 | 33.3 |
| 3 | C12 | 38.4 |
| 4 | C14 | 43.4 |
| 5 | C16 | 48.5 |
| 6 | C18 | 53.5 |
| 7 | C20 | 58.6 |
See text for method used.
Methodology Development
The Na+ release assay requires that several variables be controlled. In particular, three variables were optimized as part of this study. These include: (1) internal and external salt concentrations, (2) pH, and (3) solvent for channel inoculation. The salt concentrations for both internal and external buffer systems were varied from 500 mM to 1.0 M. At the lower end of this concentration range, electrode response became sluggish. At the highest concentrations, Na+ release occurred in the electrode’s dead time. In the studies presented here, internal [Na+] = 750 mM.
Each hydraphile has six nitrogen atoms that may be protonated. The pKa values for closely related structures were determined and reported previously.6 The hydraphiles function in the pH 7-8 range. Acidity values in this range were studied, and pH = 7.0 was chosen for the buffer solutions. At this pH value, both electrode response and channel function were acceptable.
The macrocyclic subunits of each hydraphile are crown ethers, which can complex a variety of cations. We wished to avoid competing cations. We tested both KOH and NH4OH, which decreased the transport activity of the hydraphiles. We ultimately found that (CH3)4NOH could be used effectively to adjust the buffer solutions to pH 7.0.
A final concern is the solvent used to add the hydraphiles to the aqueous buffer. The solvent chosen should not inhibit ion transport nor contain ionizable protons at pH = 7. Water/compound solubility was required for compound delivery. In addition, the solvent could not compromise the structural integrity of the liposomes. Compounds 1-7 are not soluble in DMSO, the solvent commonly used for peptide delivery into an aqueous medium. A range of solvents was surveyed, including acetonitrile, ethanol, n-propanol, n-butanol, trifluoroethanol, and others. 2-Propanol was ultimately adopted for these studies, but care was exercised to keep the solvent amount below 15 μL. When amounts greater than 20 μL were used, isopropyl alcohol caused slight ion leakage from the vesicles.
There are literature reports16,18 of detergent interference with sodium-selective electrode response. Triton X-100 proved problematic in this respect. Use of a 10% aqueous solution of n-octylglucoside eliminated these problems and was found to afford complete lysis of the liposomes in <10 s. A thorough rinse of the electrode with an aqueous buffer solution proved to be sufficient to remove residual detergent from the electrode.
Channel Response as a Function of Lipid Chain Length
Figure 3 plots the Na+ release rate observed at 1500 s for compounds 1-7 in liposomes prepared from DMPC, DOPC, and DEPC. Each phospholipid (structures shown above) contains a cis (Z) double bond that prevents the extended conformation from being as long as would be the case if both chains were saturated. The individual chain lengths are 14 carbons (Z14:1, DMPC), 18 carbons (Z18:1, DOPC), and 22 carbons (Z22:1, DEPC). The shortest chains are present in DMPC, the activity profile of which is shown as the blank line in Figure 3. Compound 1 (eight-carbon spacer chains) is inactive, but essentially complete release is obtained when any of 2-5 (10-16 carbon spacer chains) is present. Activity decreases for the two longest hydraphiles, 6 and 7, although both release Na+ from the liposomes.
The activity profile is significantly different for 1-7 for the intermediate length DOPC phospholipid vesicles (red line). Again, 1 is inactive, but 2 (10 carbon spacers) releases Na+ only to the extent of ∼20%. Maximal ion release reaches only 80-90% for 3-5 (12-16 carbon spacers) and then falls off rapidly. A similar shift in activity is apparent for the longest chain phospholipids, DEPC (blue line). In the latter case, a gradual increase in activity is apparent for 1 (inactive), 2 (∼10% release), 3 (∼50%), and 4 (60%). Maximal release in this liposome system is observed for 5 (∼95%), but activity diminishes rapidly as chain length increases. The leveling of activity observed for the longest hydraphiles [6 (C18) and 7 (C20)] may result from the channels being longer than the membrane is thick. Indeed, independent molecular dynamics simulations10 of the hydraphile channels show that 7 resides in a single leaflet of the bilayer and is therefore unable to adopt a stable transmembrane conformation. Clearly, these channels continue to function but do not increase in efficacy beyond a certain length.
Overall, it is clear that longer chained hydraphiles are required for activity in liposomes prepared from longer chained phospholipids. Compound 1 is essentially inactive in all three liposome preparations. Compound 2 exhibits near maximal activity in DMPC liposomes but shows <20% release in DOPC. Even so, this is twice the 9% release apparent in DEPC vesicles. A similar trend is observed for 3. Table 3 records the average Na+ release as a percentage of release after vesicular lysis for 1-7 in all three liposome preparations. The data shown in the table are an alternate representation of the graph of Figure 3.
Table 3.
Percent Activities Observed for 1-7 in DMPC, DOPC, and DEPC Membranes
| phospholipid |
|||
|---|---|---|---|
| compd No. | DMPC | DOPC | DEPC |
| 1 | 4 | 1 | 0 |
| 2 | 98 | 17 | 9 |
| 3 | 109a | 73 | 47 |
| 4 | 105a | 86 | 64 |
| 5 | 104a | 82 | 96 |
| 6 | 85 | 32 | 77 |
| 7 | 43 | 12 | 52 |
Ratio of observed release to value after lysis is slightly greater than 1.
Membrane-Thickening Agents
The ability of cholesterol to thicken a bilayer has been documented.19 It is proposed that cholesterol partitions into the PC bilayer with the 3-hydroxyl group hydrogen bonding to the ester carbonyl group of the phospholipid (recently reviewed20). When the lipids are in the liquid crystalline phase, above Tm, the downward placement of cholesterol is thought to increase acyl chain ordering by restricting the flexibility of adjacent phospholipid acyl chains. Changes in cholesterol levels have been demonstrated to affect many different biological processes, including ion channel function,21 membrane enzyme activity,22 the accessibility of membrane bound substrates,23 and receptor display.24
We have used our ISE-based method to probe the effect that cholesterol incorporation has on hydraphile-mediated ion transport. Figure 4 (above) shows the influence of added cholesterol (20 or 40 mol %) on transport by 1-7 in DMPC liposomes. An increase in apparent membrane thickness was observed when either 20 or 40 mol % cholesterol was added, but the effect was greater when more steroid was present. The profile shown in Figure 3 for DMPC is shifted to the right (see Figure 4), indicating an effective increase in membrane thickness. Moreover, the putative membrane-thickening agent n-decane shows a similar shift in activity (Figure 5), confirming its effect on the bilayer.
Figure 4.
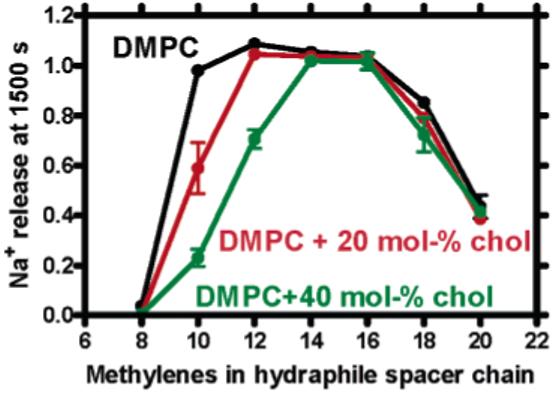
Sodium release monitored in DMPC membranes at 1500 s for 1-7 in the presence of 0, 20, or 40 mol % cholesterol.
Figure 5.
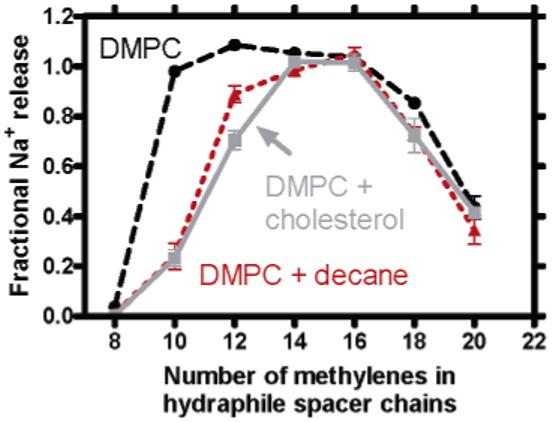
Sodium release monitored at 1500 s from DMPC liposomes for 1-7 in the presence of 40 mol % cholesterol or 25% w/w decane.
It seems unlikely to us that the results presented here reflect changes in membrane fluidity. It is known that the presence of cholesterol in a bilayer to the extent of >25 mol % promotes the formation of an ordered liquid phase. However, this concentration of cholesterol does not limit the mobility of integral membrane proteins above Tm.25 Cornelius has examined the effects of both membrane fluidity and membrane thickness and shown that membrane thickness rather than lipid fluidity is critical for ATPase activity.22 Further, decane gives results (see Figure 5) similar to those observed for cholesterol but is not known to significantly impact membrane fluidity. Finally, if fluidity was the key determinant of these results, all lengths of channels should be affected. Taken together, it appears that bilayer thickness, not changes in fluidity, account for the observed results.
Conclusion
We report here a methodology that permits a direct measure of Na+ release from phospholipid vesicles. The method, which uses an ion-selective electrode to measure Na+ transport, provides a rapid and reproducible technique to obtain concentration-dependent ion release data. We have used this methodology to measure the Na+ transport of a series of synthetic hydraphiles that differed only in their overall length. The results thus obtained were validated by comparison with length-dependence data previously obtained by NMR methods. We have further tested lipids that vary in length, from C14 to C22 acyl chains, and observed significant changes in the activity profiles of the hydraphiles. When liposomes of shorter chain lengths were prepared, shorter hydraphiles showed increased Na+ transport. As the lipid length increased, the shorter hydraphiles became less active or inactive in the thicker membranes. This trend was confirmed by using liposomes formed from dimyristoleylphosphtidylcholine diluted with the putative membrane-thickening agents cholesterol and n-decane. In all cases, the activity profile for Na+ release was shifted to the right, indicating that the shorter hydraphiles cannot form active channels in wider membranes.
Experimental Section
1H, 13C, and 23Na NMR spectra (in ppm (δ) downfield from internal Me4Si) were recorded at 300, 75, and 132.3 MHz respectively, in CDCl3, unless otherwise stated. Data are presented as follows: chemical shift, peak multiplicity (b = broad, s = singlet, d = doublet, t = triplet, m = multiplet, bs = broad singlet, etc.), assignment, integration. Melting points were determined in open capillaries and are uncorrected. Thin layer chromatographic (TLC) analyses were performed on aluminum oxide 60 F-254 neutral (type E) or on silica gel 60-F-254 (0.2-mm thickness). Preparative chromatography columns were packed with activated aluminum oxide (MCB 80-325 mesh, chromatographic grade, AX 611) or Kieselgel 60 (70-230 mesh). Flash chromatography columns were packed with silica gel Merck grade 9385, 230-400 mesh, 60 Å.
All reagents were the best grade commercially available and were distilled, crystallized, or used without further purification, as appropriate. THF and diethyl ether were distilled from sodium metal and benzophenone.
1,2-Dimyristoleoyl-sn-glycero-3-phosphocholine, 1,2-dioleoyl-sn-glycero-3-phosphocholine, and 1,2-dierucoyl-sn-glycero-3-phosphocholine were purchased from Avanti Polar Lipids as chloroform solutions. Decane, cholesterol, HEPES, and the inorganic salts NaCl and cholineCl were all purchased from Sigma-Aldrich. The water that was used for all buffer preparations was of Milli-Q Plus quality, which is essential to avoid salt contamination in the buffer systems. N-Octylglucoside was purchased from CalBioChem.
Vesicle Preparation
The vesicles used were prepared using the reverse evaporation method of Szoka and Papahadjopoulos.26 Vesicles comprised cis-unsaturated 14:1, 18:1, or 22:1 lipids. 1,2-Dimyristoleoyl-sn-glycero-3-phosphocholine, 1,2-dioleoyl-sn-glycero-3-phosphocholine, and 1,2-dierucoyl-sn-glycero-3-phosphocholine were obtained as CHCl3 solutions, which were dried to lipid films and stored at ambient temperature under high vacuum. The vesicles were prepared by dissolving a dry lipid film in 0.3 mL of diethyl ether and 0.3 mL of buffer (750 mM NaCl/15 mM HEPES, pH 7.0). The mixture was sonicated for ∼20 s to give an opaque solution. The organic solvent was removed under reduced pressure, and the solution was passed through a mini extruder containing a 0.2-μm polycarbonate membrane filter. The residual, external buffer solution was exchanged for a sodium-free buffer (750 mM cholineCl/15 mM HEPES, pH 7.0) via passage over a Sephadex G25 column. Vesicle concentration was measured as reported,17 and vesicle size was measured by a Coulter N4MD submicron particle analyzer. The vesicles used in the transport studies had diameters of ∼200-250 nm, depending on lipid tail length.
For experiments using dimyristoleoyl lipids and either cholesterol or decane, the appropriate amount of additive (20 or 40 mol % for cholesterol or 25% w/w for n-decane) was added to the dry lipid film. The lipid and additive were then dissolved in 0.3 mL of dry Et2O, and the vesicles were formed and characterized as outlined above.
Na+ Transport Measurements
All data were collected by Axoscope 7.0 using a Digidata 1322A series interface. Sodium transport was measured using a Micro-Combination pH/sodium electrode (Thermo-Orion) in aqueous sodium-free buffer (750 mM cholineCl/15 mM HEPES, pH 7.0). After equilibration in external buffer, the electrode was placed in a 5-mL disposable beaker containing external buffer and vesicle solution to achieve a lipid concentration of 0.4 mM and a total volume of 2 mL. To set the baseline, the voltage output was recorded for 5 min prior to addition of the channel. The channel solution in 2-propanol was added, and channel conductivity was measured over an appropriate time range, typically 25 min. Addition of 200 μL of 10% aqueous n-octylglucoside induced complete lysis of the vesicles to achieve total sodium release. All experiments were performed at room temperature.
Data Analysis
All data were analyzed using OriginPro 7. The data, which were collected in units of millivolts, were first converted to units of concentration, using the calibration curve for the electrode. A new calibration curve was generated every few weeks to account for the changing temperature of the room, diminishing electrode performance with age, and any other condition that might affect its performance. After converting from millivolt to concentration, the data were normalized to the total sodium concentration, as determined by lysing the vesicles with n-octylglucoside.
Hydraphile Preparation
N,N’-Bis[10-(N’-benzyldiaza-18-crown-6)octyl]diaza-18-crown-6, [C6H5CH2〈N18N〉(CH2)8〈N18N〉(CH2)8-〈N18N〉CH2C6H5], 1, was prepared as reported in detail in ref 12b.
N,N’-Bis[10-(N’-benzyldiaza-18-crown-6)decyl]diaza-18-crown-6, [C6H5CH2〈N18N〉(CH2)10〈N18N〉(CH2)10〈N18N〉CH2C6H5], 2, was prepared as reported in detail in ref 8.
N,N’-Bis[12-(N’-benzyldiaza-18-crown-6)dodecyl]diaza-18-crown-6, [C6H5CH2〈N18N〉(CH2)12〈N18N〉(CH2)12〈N18N〉CH2C6H5], 3, was prepared as previously reported.8
N,N’-Bis[14-(N’-benzyldiaza-18-crown-6)tetradecyl]diaza-18-crown-6, [C6H5CH2〈N18N〉(CH2)14〈N18N〉(CH2)14〈N18N〉CH2C6H5], 4, was prepared as reported in detail in ref 8.
N,N’-Bis[16-(N’-benzyldiaza-18-crown-6)hexadecyl]diaza-18-crown-6, [C6H5CH2〈N18N〉(CH2)16〈N18N〉(CH2)16〈N18N〉CH2C6H5], 5, was prepared as reported in detail in ref 8.
Preparation of the N,N’-Bis[18-(N’-benzyldiaza-18-crown-6)-octadecyl]diaza-18-crown-6, [C6H5CH2〈N18N〉(CH2)18〈N18N〉(CH2)18-〈N18N〉CH2C6H5], 6. CH3OCO(CH2)16COOCH3
MeOH (100 mL) was dried over 4 Å molecular sieves for ∼30 min prior to use. 1,16-Octadecanedicarboxylic acid (5.02 g, 16.0 mmol) was dissolved with heating in dry MeOH. Concentrated H2SO4 (1.2 mL) was added to the solution, and the reaction was heated to reflux under N2 for 2 h. The reaction was cooled to room temperature, and a white precipitate formed upon cooling. The solvent was removed in vacuo to afford a white solid. The product was dissolved in EtOAc, washed (3 × 75 mL) with saturated NaHCO3, and dried over Na2SO4, and the solution was evaporated to dryness. The crude diester was dried under high vacuum over-night to give 5.29 g (97%) of a white powder, mp 57-58 °C (lit. 58-59 °C). 1H NMR: 1.25 (s, 24H), 1.61 (bt, 4H), 2.30 (t, 4H), 3.66 (s, 6H). 13C NMR: 24.95, 29.14, 29.25, 29.45, 29.58, 29.63, 34.12, 51.42.
HO(CH2)18OH
The diester CH3O(CH2)18OCH3 (3.56 g, 10.4 mmol) was dissolved in freshly distilled THF (under N2), Red-Al (12.5 mL, 41.6 mmol) was added, and the reaction was stirred at room temperature for 3 h. Water was added dropwise until gas evolution ceased; a white solid formed at this time. The mixture was stirred for an additional 30 min and then filtered through a pad of Celite. EtOAc was added, and the reaction was washed 3× with H2O to remove the white solid, which dispersed into the aqueous layer. The organic layer was dried over Mg2SO4 and evaporated in vacuo to afford 2.43 g (82%) of a white solid, mp 99 °C (lit. 98-99 °C) after drying under high vacuum overnight. 1H NMR: 1.25 (s, 28H), 1.56 (m, 4H), 3.64 (t, 4H). 13C NMR: 25.73, 29.41, 29.63, 32.80, 63.11.
Br(CH2)18Br
Acetic anhydride (30 mL) was slowly added to concentrated HBr (15 mL) and HO(CH2)18OH at 0 °C. The reaction mixture was brought to reflux and stirred for 5 h before being cooled to room temperature. The reaction was concentrated in vacuo under reduced pressure to afford a brown solid upon drying. The product was chromatographed by SiO2 (Hexanes) to afford a white solid (2.95 g, 85.8%), mp 59 °C (lit. 59-60 °C). 1H NMR: 1.26 (s, 28H), 1.42 (bm, 4H), 1.85 (m, 4H), 3.41 (t, 4H). 13C NMR: 28.17, 28.76, 29.43, 29.54, 29.64, 32.83, 34.07.
PhCH2〈N18N〉 (CH2)18Br
PhCH2〈N18N〉 H (750 mg, 2.13 mmol) and 1,18-dibromooctadecane (1.05 g, 2.55 mmol) were dissolved in n-PrCN (50 mL). To this solution were added Na2CO3 (7.5 g, 21.3 mmol) and a catalytic amount of KI. The reaction was stirred for 3 h at reflux (N2) and cooled to room temperature. The solvent was evaporated in vacuo, and the residual orange oil was dissolved in CH2Cl2. The organic solution was washed with 5% NaHCO3 (2 × 50 mL). The organic layer was dried over Mg2SO4, and the solvent was removed in vacuo to afford an orange oil. The product was purified by SiO2 chromatography (hexanes → 5% Et3N/acetone) to afford 730 mg (50%) of an oily yellow-orange solid with mp near ambient temperature. 1H NMR: 1.25 (s, 28H), 1.42 (bm, 2H), 1.85 (m, 2H), 2.50 (bt, 2H), 2.80 (t, 8H), 3.40 (t, 2H), 3.58-3.67 (m, s, 18H). 13C NMR: 27.11, 27.47, 28.16, 28.75, 29.41, 29.52, 29.66, 32.82, 34.06, 53.72, 53.87, 55.99, 59.91, 70.00, 70.67, 126.80, 128.12, 128.81, 139.61. IR (νmax cm-1): 2924, 2853, 1454, 1352, 1126.
PhCH2〈N18N〉(CH2)18〈N18N〉(CH2)18〈N18N〉CH2Ph, 6
PhCH2-〈N18N〉(CH2)18Br (730 mg, 1.07 mmol) and diazacrown (133 mg, 0.508 mmol) were dissolved in ∼30 mL of n-PrCN. To this solution were added Na2CO3 (1.09 g, 10.16 mmol) and catalytic KI. The reaction was stirred under reflux (N2) for 4 d, cooled, and evaporated. The resulting orange oil was dissolved in CH2Cl2, washed with 5% NaHCO3 (2 × 25 mL), dried over Mg2SO4, and evaporated to an orange oil. Chromatography (SiO2, 1% Et3N/acetone → 2% Et3N/acetone) gave 6 (56 mg, 7% yield) as a white solid, mp 52-53 °C. 1H NMR: 1.17 and 1.37 (s, bs, 64H), 2.42 (bs, 8H), 2.73 (t, 24H), 3.54 (pt, s, 52H). 13C NMR: 227.18, 29.69, 53.22, 53.38, 53.79, 59.62, 69.84, 70.53, 127.04, 128.24, 128.90. IR (νmax cm-1): 2924, 2853, 1643, 1454, 1113. Calcd: C, 70.35; H, 10.85; N, 5.72. Found: C, 70.12; H, 10.55; N, 5.67%.
Preparation of the N,N’-Bis[20-(N’-benzyldiaza-18-crown-6)-eicosyl]diaza-18-crown-6, [C6H5CH2〈N18N〉(CH2)20〈N18N〉(CH2)20-〈N18N〉CH2C6H5, 7. CH3OCO(CH2)18COOCH3
Methanol (100 mL) was dried over 4 Å molecular sieves for ∼30 min prior to use. 1,18-Octadecanedicarboxylic acid (4.99 g, 14.6 mmol) was dissolved with heating in MeOH. Concentrated H2SO4 (0.3 mL) was added, and the reaction was heated under reflux (2 h) and cooled to room temperature, whereupon a white precipitate formed. Evaporation of the solvent gave a white solid that was dissolved in EtOAc, washed with saturated NaHCO3 (3 × 75 mL), and dried over Na2SO4, and the solvent was removed in vacuo. The resulting diester (4.6 g, 86%) was isolated as a white solid after drying in vacuo overnight, mp 63-64 °C (lit. 65-66 °C). 1H NMR: 1.25 (s, 28H), 1.61 (bt, 4H), 2.30 (t, 4H), 3.66 (s, 6H). 13C NMR: 24.95, 29.14, 29.25, 29.45, 29.66, 29.63, 34.11, 51.42.
HO(CH2)20OH
The diester CH3O(CH2)20OCH3 (3.27 g, 8.83 mmol) was dissolved in freshly distilled THF (N2), Red-Al (10.6 mL, 35.3 mmol) was added, and the reaction was stirred for 3 h. The reaction was quenched by careful addition of H2O and stirred for an additional 30 min. The mixture was filtered through Celite, EtOAc was added to the mother liquor, and the resulting mixture was washed with H2O (3 × 50 mL). The organic layer was dried (Mg2SO4) and then evaporated to afford the diol (1.73 g, 62.5%) as a white solid after drying, mp 101-102 °C (lit. 102-103 °C). 1H NMR: 1.25 (s, 32H), 1.56 (mt, 4H), 3.64 (t, 4H). 13C NMR: 25.73, 29.41, 29.60, 29.66, 63.11.
Br(CH2)20Br
Acetic anhydride (25 mL) was added (dropwise, 0 °C) to concentrated HBr (12 mL) and HO(CH2)20OH. The reaction mixture was stirred under reflux for 5 h, cooled, and concentrated to a brown solid. The dibromide was chromatographed (SiO2, hexanes) to afford a white solid (1.94 g, 79.7%), mp 65 °C (lit. 66-67 °C). 1H NMR: 1.25 (s, 28H), 1.42 (bt, 4H), 1.85 (m, 4H), 3.41 (t, 4H). 13C NMR: 28.17, 28.6, 29.43, 29.54, 29.66, 32.85, 34.06.
PhCH2〈N18N〉(CH2)20Br
PhCH2〈N18N〉H (750 mg, 2.13 mmol) and 1,20-dibromoeicosane (886 mg, 2.02 mmol) were dissolved in n-PrCN (50 mL). To this solution were added Na2CO3 (6.8 g, 63.9 mmol) and catalytic KI. The reaction was heated (reflux, N2) for 3 h, cooled, and evaporated to an orange oil, which was dissolved in CH2Cl2 and washed with 5% NaHCO3 (2 × 25 mL). The organic layer was dried (Mg2-SO4) and evaporated to an orange oil. Chromatography (SiO2, hexanes → 5% Et3N/acetone) gave the dibromide (640 mg, 44%) as an orange oil. 1H NMR: 1.25 (s, 28H), 1.42 (bm, 4H), 1.85 (m, 2H), 2.49 (t, 2H), 2.80 (t, 8H), 3.40 (t, 2H), 3.58-3.67 (m, s, 16H), 7.24-7.34 (m, 5H). 13C NMR: 27.50, 28.16, 28.75, 29.41, 29.52, 29.60, 29.67, 32.83, 34.05, 53.73, 53.90, 56.02, 59.92, 70.03, 70.70, 126.80, 128.14, 128.82. IR νmax (cm-1): 2924, 2853, 1454, 1351, 1126.
PhCH2〈N18N〉(CH2)20〈N18N〉(CH2)20〈N18N〉CH2Ph, 7
PhCH2-〈N18N〉(CH2)20Br (640 mg, 0.899 mmol) and 4,13-diaza-18-crown-6 (112 mg, 0.427 mmol) were dissolved in n-PrCN (30 mL), and Na2CO3 (4.7 g, 4.27 mmol) and catalytic KI were added. After being heated (reflux) for 5 d, the mixture was cooled and evaporated to an orange oil. The oil was dissolved in CH2Cl2, washed with 5% NaHCO3 (2 × 25 mL), dried (Mg2SO4), and evaporated, and the orange oil was chromatographed (SiO2, acetone → 2% Et3N/acetone) to afford 7 (40 mg, 4%) as a white solid, mp 47-48 °C. 1H NMR: 1.18 (s, 72H), 2.50 (bs, 8H), 2.73 (t, 24H), 3.54 (pt, s, 52H). 13C NMR: 27.49, 29.67, 29.41, 34.06, 53.75, 59.91, 70.02, 70.70, 128.14, 128.82 IR (νmax cm-1): 2924, 2853, 1454, 1353, 1114. Calcd. C, 70.91; H, 10.98; N, 5.51. Act. C, 71.14; H, 11.02; N, 5.51.
Acknowledgment
We thank the NIH for grants (GM 36262 and 63190) and for training grant support of M.E.W. through T32GM08785.
References
- (1).Gorter E, Grendel F. J. Exp. Med. 1925;41:439–443. doi: 10.1084/jem.41.4.439. [DOI] [PMC free article] [PubMed] [Google Scholar]
- (2).Singer SJ, Nicolson GL. Science. 1972;175:720–731. doi: 10.1126/science.175.4023.720. [DOI] [PubMed] [Google Scholar]
- (3)(a).Nagle JF, Tristram-Nagle S. Curr. Opin. Struct. Biol. 2000;10:474–480. doi: 10.1016/s0959-440x(00)00117-2. [DOI] [PMC free article] [PubMed] [Google Scholar]; (b) Nagle JF, Tristram-Nagle S. Biochim Biophys Acta. 2000;1469:159–95. doi: 10.1016/s0304-4157(00)00016-2. [DOI] [PMC free article] [PubMed] [Google Scholar]; (c) Tristram-Nagle S, Liu Y, Legleiter J, Nagle JF. Biophys. J. 2002;83:3324–35. doi: 10.1016/S0006-3495(02)75333-2. [DOI] [PMC free article] [PubMed] [Google Scholar]; (d) Tristram-Nagle S, Nagle JF. Chem. Phys. Lipids. 2004;127:3–14. doi: 10.1016/j.chemphyslip.2003.09.002. [DOI] [PMC free article] [PubMed] [Google Scholar]
- (4)(a).Pencer J, Hallett FR. Phys. Rev. E. 2000;61:3003–3008. doi: 10.1103/physreve.61.3003. [DOI] [PubMed] [Google Scholar]; (b) Balgavy P, Dubnickova M, Kucerka N, Kiselev MA, Yaradaikin SP, Uhrikova D. Biochim. Biophys. Acta. 2001;1512:40–52. doi: 10.1016/s0005-2736(01)00298-x. [DOI] [PubMed] [Google Scholar]; (c) Kucerka N, Kiselev MA, Balgavy P. Eur. Biophys. J. 2004;33:328–34. doi: 10.1007/s00249-003-0349-0. [DOI] [PubMed] [Google Scholar]
- (5).Gokel GW. Chem. Commun. 2000:1–9. [Google Scholar]
- (6).Murillo O, Watanabe S, Nakano A, Gokel GW. J. Am. Chem. Soc. 1995;117:7665–7679. [Google Scholar]
- (7).Abel E, Maguire GEM, Meadows ES, Murillo O, Jin T, Gokel GW. J. Am. Chem. Soc. 1997;119:9061–9062. [Google Scholar]
- (8).Leevy WM, Pajewski R, Huettner JE, Schlesinger PH, Gokel GW. doi: 10.1021/ja046626x. in press. [DOI] [PubMed] [Google Scholar]
- (9).Leevy WM, Donato GM, Ferdani R, Goldman WE, Schlesinger PH, Gokel GW. J. Am. Chem. Soc. 2002;124:9022–9023. doi: 10.1021/ja017052o. [DOI] [PubMed] [Google Scholar]
- (10)a).Srinivas G, Lopez C, Klein M. J. Phys. Chem. B. 2004;108:4231–4235. [Google Scholar]; (b) Srinivas G, Klein ML. Nanotechnol. 2004;15:1289–1295. [Google Scholar]
- (11)(a).Fettiplace R, Andrews DM, Haydon DA. J. Membr. Biol. 1971;5:277–296. doi: 10.1007/BF01870555. [DOI] [PubMed] [Google Scholar]; (b) Caffrey M, Feigenson GW. Biochemistry. 1981;20:1949–1961. doi: 10.1021/bi00510a034. [DOI] [PubMed] [Google Scholar]; (c) Lewis BA, Englelman DM. J. Mol. Biol. 1983;166:211–217. doi: 10.1016/s0022-2836(83)80007-2. [DOI] [PubMed] [Google Scholar]; (d) Nezil FA, Bloom M. Biophys. J. 1992;61:1176–1183. doi: 10.1016/S0006-3495(92)81926-4. [DOI] [PMC free article] [PubMed] [Google Scholar]; (e) Wiener MC, White SH. Biophys. J. 1992;61:434–447. doi: 10.1016/S0006-3495(92)81849-0. [DOI] [PMC free article] [PubMed] [Google Scholar]
- (12)(a).Murray CL, Gokel GW. Chem. Commun. 1998:2477–2478. [Google Scholar]; (b) Murray CL, Gokel GW. J. Supramol. Chem. 2001;1:23–30. [Google Scholar]
- (13).Hernandez JC, Trafton JE, Gokel GW. Tetrahedron Lett. 1991:6269–6272. [Google Scholar]
- (14)(a).Dishong DM, Gokel GW. J. Org. Chem. 1982;47:147–148. [Google Scholar]; (b) Schultz RA, White BD, Dishong DM, Arnold KA, Gokel GW. J. Am. Chem. Soc. 1985;107:6659–6668. [Google Scholar]
- (15).Breukink E, Kraaij CV, Demel RA, Siezen RJ, Kuipers OP, Kruijff BD. Biochemistry. 1997;36:6968–6976. doi: 10.1021/bi970008u. [DOI] [PubMed] [Google Scholar]
- (16).Silberstein A, Mirzabekov T, Anderson WF, Rozenberg Y. Biochim. Biophys. Acta. 1999;1461:103–112. doi: 10.1016/s0005-2736(99)00152-2. [DOI] [PubMed] [Google Scholar]
- (17).Stewart JCM. Anal. Biochem. 1980;104:10–14. doi: 10.1016/0003-2697(80)90269-9. [DOI] [PubMed] [Google Scholar]
- (18).Gruber HJ, Wilmsen HU, Schurga A, Pilger A, Schindler H. Biochim. Biophys. Acta. 1995;1240:266–276. doi: 10.1016/0005-2736(95)00189-1. [DOI] [PubMed] [Google Scholar]
- (19).Smondyrev AM, Berkowitz ML. Biophys. J. 1999;77:2075–2089. doi: 10.1016/S0006-3495(99)77049-9. [DOI] [PMC free article] [PubMed] [Google Scholar]
- (20).Ohvo-Rekila H, Ramstedt B, Leppimaki P, Slotte JP. Prog. Lipid Res. 2002;41:66–97. doi: 10.1016/s0163-7827(01)00020-0. [DOI] [PubMed] [Google Scholar]
- (21)(a).O’Connell KMS, Martens JR, Tamkun M. Trends Cardiovasc. Med. 2004;14:37–42. doi: 10.1016/j.tcm.2003.10.002. [DOI] [PubMed] [Google Scholar]; (b) Martens JR, O’Connell K, Tamkun M. Trends Pharmacol. Sci. 2003;25:16–21. doi: 10.1016/j.tips.2003.11.007. [DOI] [PubMed] [Google Scholar]; (c) Venegas B, Gonzalez-Damian J, Celis H, Ortega-Blake I. Biophys. J. 2003;85:2323–2332. doi: 10.1016/s0006-3495(03)74656-6. [DOI] [PMC free article] [PubMed] [Google Scholar]
- (22).Cornelius F. Biochemistry. 2001;40:8842–8851. doi: 10.1021/bi010541g. [DOI] [PubMed] [Google Scholar]
- (23)(a).Pilot JD, East JM, Lee AG. Biochemistry. 2001;40:8188–8195. doi: 10.1021/bi0103258. [DOI] [PubMed] [Google Scholar]; (b) Lehto MT, Sharom FJ. Biochemistry. 2002;41:1398–1408. doi: 10.1021/bi011579w. [DOI] [PubMed] [Google Scholar]
- Pike LJ, Casey L. Biochemistry. 2002;41:10315–10322. doi: 10.1021/bi025943i. [DOI] [PubMed] [Google Scholar]
- (25).Ipsen JH, Karlstrom G, Mouritsen OG, Wennerstrom HW, Zuckermann MJ. Biochim. Biophys. Acta. 1987;905:162–172. doi: 10.1016/0005-2736(87)90020-4. [DOI] [PubMed] [Google Scholar]
- (26).Szoka FJ, Papahadjopoulos D. Proc. Natl. Acad. Sci. U.S.A. 1978;75:4194–4198. doi: 10.1073/pnas.75.9.4194. [DOI] [PMC free article] [PubMed] [Google Scholar]