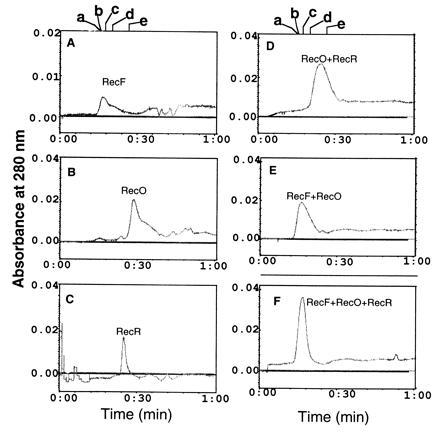
Figure 2.

Elution profiles of RecF, RecO, and RecR proteins on Superose-12 sizing columns. RecF (1.5 μM) or RecO (6 μM) or RecR (6 μM) in a final volume of 100 μl of buffer I was loaded on Superose-12 HR 10/30 (Pharmacia) and eluted at a flow rate of 0.5 ml/min in the same buffer. Elution time is shown on the x axis and eluted proteins were collected by absorption at 280 nm. For detecting complexes, RecF, RecO, and RecR (each at 6 μM) in the indicated combinations were mixed in buffer I and incubated for 30 min on ice prior to loading on to the column. A, RecF; B, RecO; C, RecR; D, RecO–RecR complex; E, RecF–RecO complex; F, RecF–RecO–RecR complex. The trailing shoulder peak of RecO (B) indicate some interaction of RecO with the resin. The position of molecular mass standards labeled a–e is shown above A and D. a, Ferritin, 400 kDa; b, catalase, 230 k:da; c, aldolase, 130 kDa; d, ovalbumin, 45 kDa; e, chymotrypsin, 25 kDa.
